IPO Note | Logistics
October 30, 2017
Mahindra Logistics Limited
SUBSCRIBE
sue Open: October 31, 2017
Is
Asset light model backed by heavy growth
Issue Close: November 02, 2017
Mahindra Logistics Limited (MLL) is a part of Mahindra & Mahindra group and
works as a 3rd party logistics services provider. MLL was incorporated in 2007 and
Issue Details
has become one of largest 3rd party logistics solutions providers in India. MLL
follows an asset light business model in which most assets (vehicles and
Face Value: `10
warehouses) are owned /provided by its business partners. The company operates
in two business segments i.e. Supply Chain Management (SCM) and corporate
Present Eq. Paid up Capital: `71.1cr
People Transport Solutions (PTS).
Offer for Sale: *1.9cr shares (*`821.62cr -
**`829.36cr)
Operating in an attractive industry: Domestic logistics industry, valued at
`6.4trillion, is expected to grow by ~13% to reach `9.2trillion by 2020. Within the
Fresh issue:Nil
industry, the 3rd party logistics segment is expected to witness a growth of ~21%.
Post Eq. Paid up Capital: `71.1cr
The industry is highly fragmented and post GST implementation, organized large
Issue size (amount): *`821.62cr -**`829.36cr
players are expected to see improved cost structure and gain market share. We
believe that MLL is operating in an industry with tailwinds.
Price Band: `425-429
Impressive growth in non-Mahindra revenues: MLL was dependent on its parent
Lot Size: 34 shares and in multiple thereafter
Mahindra and Mahindra to derive its revenue. In the last few years however,
Post-issue implied mkt. cap:
*`3,023cr
-
company has successfully diversified its business and 45% of its revenues are
**`3,052cr
derived by non-Mahindra clients. Company has hired global consultant McKinsey
Promoter and promoter group holding Pre-
to devise its sales strategy which has clearly helped the company to diversify and
Issue: 74.64%
report a healthy growth rate of 17.5% in the top-line over last three years.
Employee
reservation:
1.25
lakh
Strong return profile: While MLL reported EBITDA margins of 2.9% in FY2017 and
shares(*`5.3cr - **`5.4cr)
5 year PAT CAGR of 17.2%, the adjusted numbers show a different picture with
Promoter and promoter group holding Post-
3.2% EBITDA margins and PAT CAGR of 25.2%. FY2017 adjusted ROE and ROIC
Issue: 61.05%
also work out to be 17.3% and 40% respectively, far better than its peers.
*Calculated on lower price band
** Calculated on upper price band
Outlook and valuation: At the upper end of the price band (`425-`429), the issue
is priced at 66.2x and 50.8x of its reported and adj. FY2017 earnings. Due to its
asset light model, there is no exact comparable peer; however, the thumb rule for
Book Building
any investment is growth and returns. MLL has exhibited CAGR of 15% and 25%
QIBs
50% of issue
in top-line and adj. bottom-line respectively, which is better than its players i.e.
VRL logistics and Transport Corporation of India. In terms of returns, company
Non-Institutional
15% of issue
has shown a better return profile (ROE & ROIC of 17.3% and 40% v/s. peer
Retail
35% of issue
group avg. - 13% & 14% respectively). Based on its growth story, diversification
strategy, strong parent repute and post GST attractiveness of the logistics sector,
we assign Subscribe rating to the issue.
**Post Issue Shareholding Pattern
Key Financials
Y/E March (` cr)
FY2014
FY2015
FY2016
FY2017
Promoters Group
61.05
Net Sales
1,751
1,931
2,064
2,667
% chg
14.3
10.3
6.9
29.2
DIIs/FIIs/Public & Others
38.95
Net Profit
37
39
36
46
% chg
49.9
5.2
(6.6)
28.1
OPM (%)
2.9
3.0
2.5
2.9
EPS (Rs)
5.9
6.6
5.3
6.6
P/E (x)
83.4
79.2
84.9
66.2
P/BV (x)
24.5
11.5
10.1
8.8
Adj. RoE (%)
29.4
15.2
13.2
17.3
RoCE (%)
38.7
19.0
13.5
16.4
Shrikant Akolkar
EV/Sales (x)
1.7
1.6
1.5
1.1
+91 22 39357800 Ext: 6846
EV/EBITDA (x)
57.8
52.7
58.3
39.7
Source: Company, Angel Research
Please refer to important disclosures at the end of this report
1
Mahindra Logistics| IPO Note
Company background
Mahindra Logistics Limited (MLL) is a part of Mahindra & Mahindra group and
works as a third party logistics services provider (3PL). MLL was incorporated in
2007 and has become one of largest 3rd party logistics solutions providers in
India. MLL follows an asset light business model in which most assets (vehicles and
warehouses) are owned /provided by its business partners. The company operates
in two business segments, Supply Chain Management (SCM) and corporate People
Transport Solutions (PTS). MLL is a 3PL company involved into logistics, ware-
house management, inbound and outbound activities, etc.
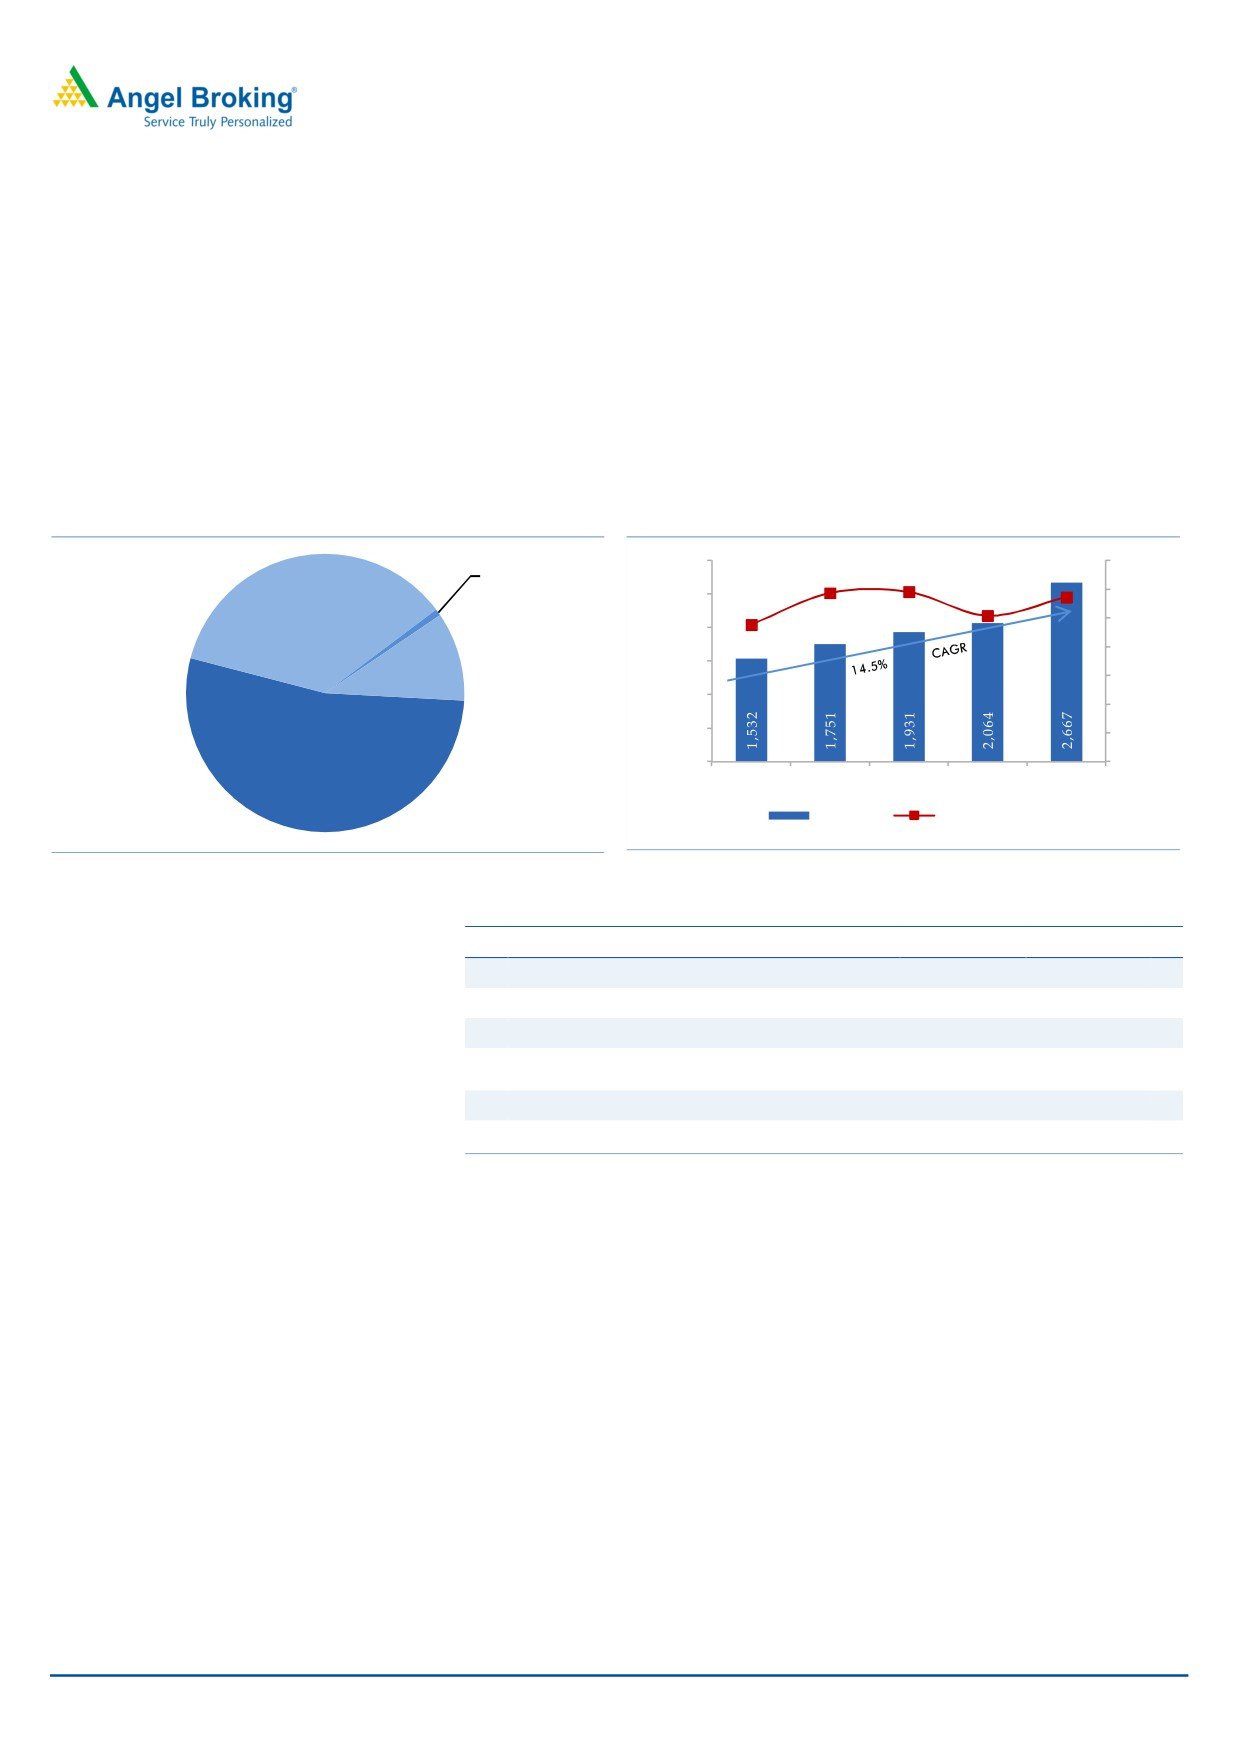
Exhibit 1: Business mix (FY17)
Exhibit 2: Revenue growth and margin profile
3,000
3.5%
PTS Mahindra
2.9%
3.0%
2.9%
SCM Non-
1%
3.0%
2,500
2.5%
Mahindra
2.4%
36%
2.5%
2,000
2.0%
PTS Non-
1,500
Mahindra
1.5%
10%
1,000
1.0%
500
0.5%
SCM Mahindra
0
0.0%
53%
FY13
FY14
FY15
FY16
FY17
Net sales
EBITDA margins
Source: Company, Angel Research, #JVs are not consolidated
Source: Company, Angel Research
Exhibit 3: Evolution of MLL’s business
Year
Milestone
2000
Set-up of the logistics business as a separate division of Mahindra & Mahindra
2009
Logistics business transferred by M&M to MLL
2011
Achieves `1,000cr turnover
Investment by Private equity players Normandy and Kedaara AIF
2014
Enters Ecommerce business
2015
Acquisition of Lords and JV with IVC to for 2X2 Logistics
2017
Achieves `2,500cr turnover
Source: Company, Angel Research
Business segments
Supply Chain Management business (SCM): This segment offers customized and
end-to-end logistics solutions and services including transportation and
distribution, warehousing, in-factory logistics and value added services to clients. It
has a pan-India network comprising 24 city offices and over 350 client and
operating locations as on May 2017. It has a large network of over 1,000 business
partners providing vehicles, warehouses and other assets and services for the SCM
business. Key clients in this business are Volkswagen India Private Limited,
Vodafone India Limited, Thermax Limited, JSW Steel Limited, Ashok Leyland
Limited, Siemens Limited, Bosch Limited, BMW India Private Limited, 3M India
Limited, and Mercedes-Benz India Private Limited.
October 30, 2017
2
Mahindra Logistics| IPO Note
People Transport Solutions (PTS): This segment provides technology enabled
people transportation solutions and services across India to over 100 domestic and
multinational companies operating in the IT, BPOs, KPOs, financial services,
consulting and manufacturing industries. It offers services through a fleet of
vehicles provided by a large network of over 500 business partners. As on May
2017, the company operated PTS business in 12 cities and over 120 client
operating locations across India. Key clients in India for the PTS business include
Tech Mahindra Limited, AXISCADES Engineering Technologies Limited and ANZ
Support Services India Private Limited.
MLL operates two subsidiaries named 2X2 Logistics Private Limited and Lords
Freight (India) Private Limited.
October 30, 2017
3
Mahindra Logistics| IPO Note
Issue details
This is a 100% offer for sale (OFS) issue. Through this IPO, the promoter i.e.
Mahindra and Mahindra will sell total 96.7 lakh shares (`411cr on the lower band
and `415cr on the upper band) while equal no. of shares will be offloaded by PE
investors i.e. Normandy Holdings and Kedaara AIF (Kedaara Capital Alternative
Investment Fund). Normandy Holdings is a fully owned subsidiary of Kedaara
Capital. Promoter, Mahindra and Mahindra’s stake would come down to 58.77%
after the IPO.
Kedara Capital had bought 22.99% stake in the company for `200cr in 2014
(implying the then market cap of `870cr). Kedaara Capital continues to hold
22.99% stake in MLL (pre issue), however after it sells 13.59% stake in the
company through IPO, Kedaara capital’s stake would come down to 9.4%.
Exhibit 4: Selling shareholders and pre and post IPO shareholding pattern
Pre issue
Post-issue
Entity name
Shares offered
No of shares held
% of total shares
No of shares held
% of total shares
Mahindra & Mahindra Limited (Promoter)
51,478,330
72.36%
9,666,173
41,812,157
58.77%
Partners’ Enterprise (Promoter group)
1,622,147
2.28%
nil
1,622,147
2.28%
Promoter and Promoter group
53,100,477
74.64%
9,666,173
43,434,304
61.05%
Normandy
15,686,263
22.05%
9,271,180
6,415,083
9.02%
Kedaara AIF
668,304
0.94%
394,993
273,311
0.38%
Public
1,686,880
2.37%
nil
21,019,226
29.55%
Source: Company, Angel Research
Objects of the fresh issue
Achieve the benefits of listing the Equity Shares on the Stock Exchanges
Enhance visibility and brand image and provide liquidity to the Shareholders
Offer for sale for partial exit of existing shareholders
October 30, 2017
4
Mahindra Logistics| IPO Note
Investment Rationale
Logistics industry to grow at a CAGR of 13% over the next three years: India’s
logistics industry is estimated at `6.4 trillion in FY2017 and it is expected to grow
at a CAGR of 13% to `9.2 trillion in FY2020. The logistics industry is dominated by
transportation (~88% share of the logistics industry), which is expected to remain
high over the next 3-4 years. Large segment of the industry is fragmented, hence
dominated by the unorganized players. In warehousing too, there is scarcity of
quality warehouses. The 3rd party logistics market (3PL) is valued at `325bn in
2017 (~5% of the total logistics sector), which is expected to grow at a CAGR of
~21% to reach to `570bn in 2020 (~6% of the total domestic logistic sector). 3PL
companies are like one stop shop for the companies which can focus on the core
tasks such as manufacturing by outsourcing their logistics operations to the 3PL
companies. This growth push will be offered by sectors such as automobiles, e-
commerce, consumer goods, organized retail and engineering.
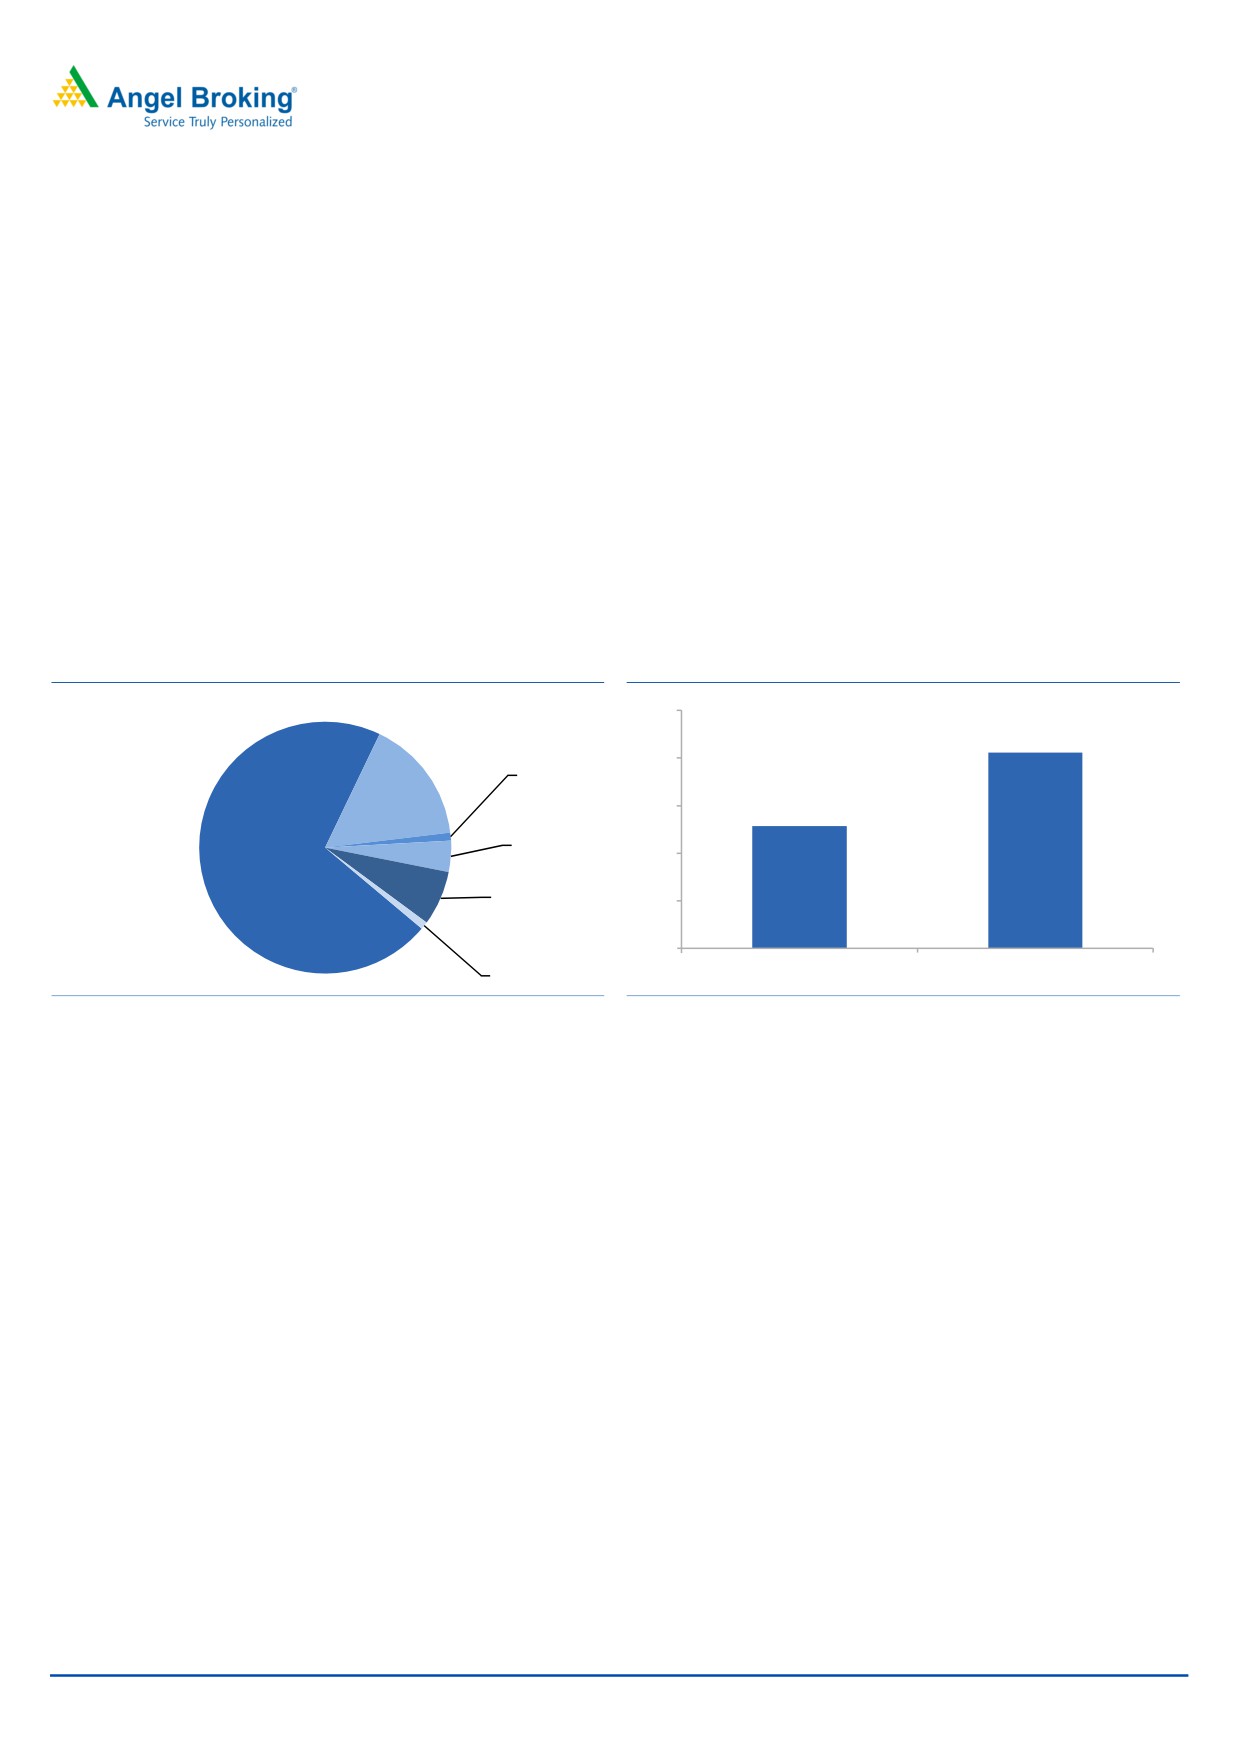
Exhibit 5: Break-up of the domestic logistics sector
Exhibit 6: 3PL to grow faster than logistics industry
25%
FY2017-20 CAGR
21%
Coastal
20%
freight, 1%
Rail freight,
15%
13%
16%
Cold chain,
10%
Road freight,
4%
71%
Wearehousing,
5%
7%
0%
CFS/ICD, 1%
Logistics sector
3PL sector
Source: Company, Angel Research
Source: Company, Angel Research
GST - Game changer for logistics sector: As the sector is largely fragmented, the
share of the unorganized players is very high in this sector. The GST
implementation in July 2017 is expected to help the manufacturing companies to
aggregate state based warehouses into one large, regional warehouse that would
offer cost and operational efficiency in large markets. As logistical inefficiency and
primary transport costs decline, the hub-and-spoke model is expected to
proliferate, which is expected to result in improved serviced levels. Implementation
of GST will result in most business decisions being focused on supply chain
efficiency and not on state-wise tax benefits. Many businesses have already started
considering a complete redesign of their supply chain network. This will be a boon
to the logistics sector and to the large organized players in the sector.
MLL an integrated player with pan India reach: MLL offers end-to-end logistics
solutions and services such as transportation, distribution, warehousing, inbound
and outbound logistics, etc. to its clients. In its SCM business it has a pan-India
network comprising 24 city offices and over 350 client and operating locations as
on May 2017. It has a large network of over 1,000 business partners providing
vehicles, warehouses and the other assets and services for the SCM business. In its
PTS business, company has over 100 domestic and MNC clients and offers
services through a fleet of vehicles provided by a large network of over 500
business partners.
October 30, 2017
5
Mahindra Logistics| IPO Note
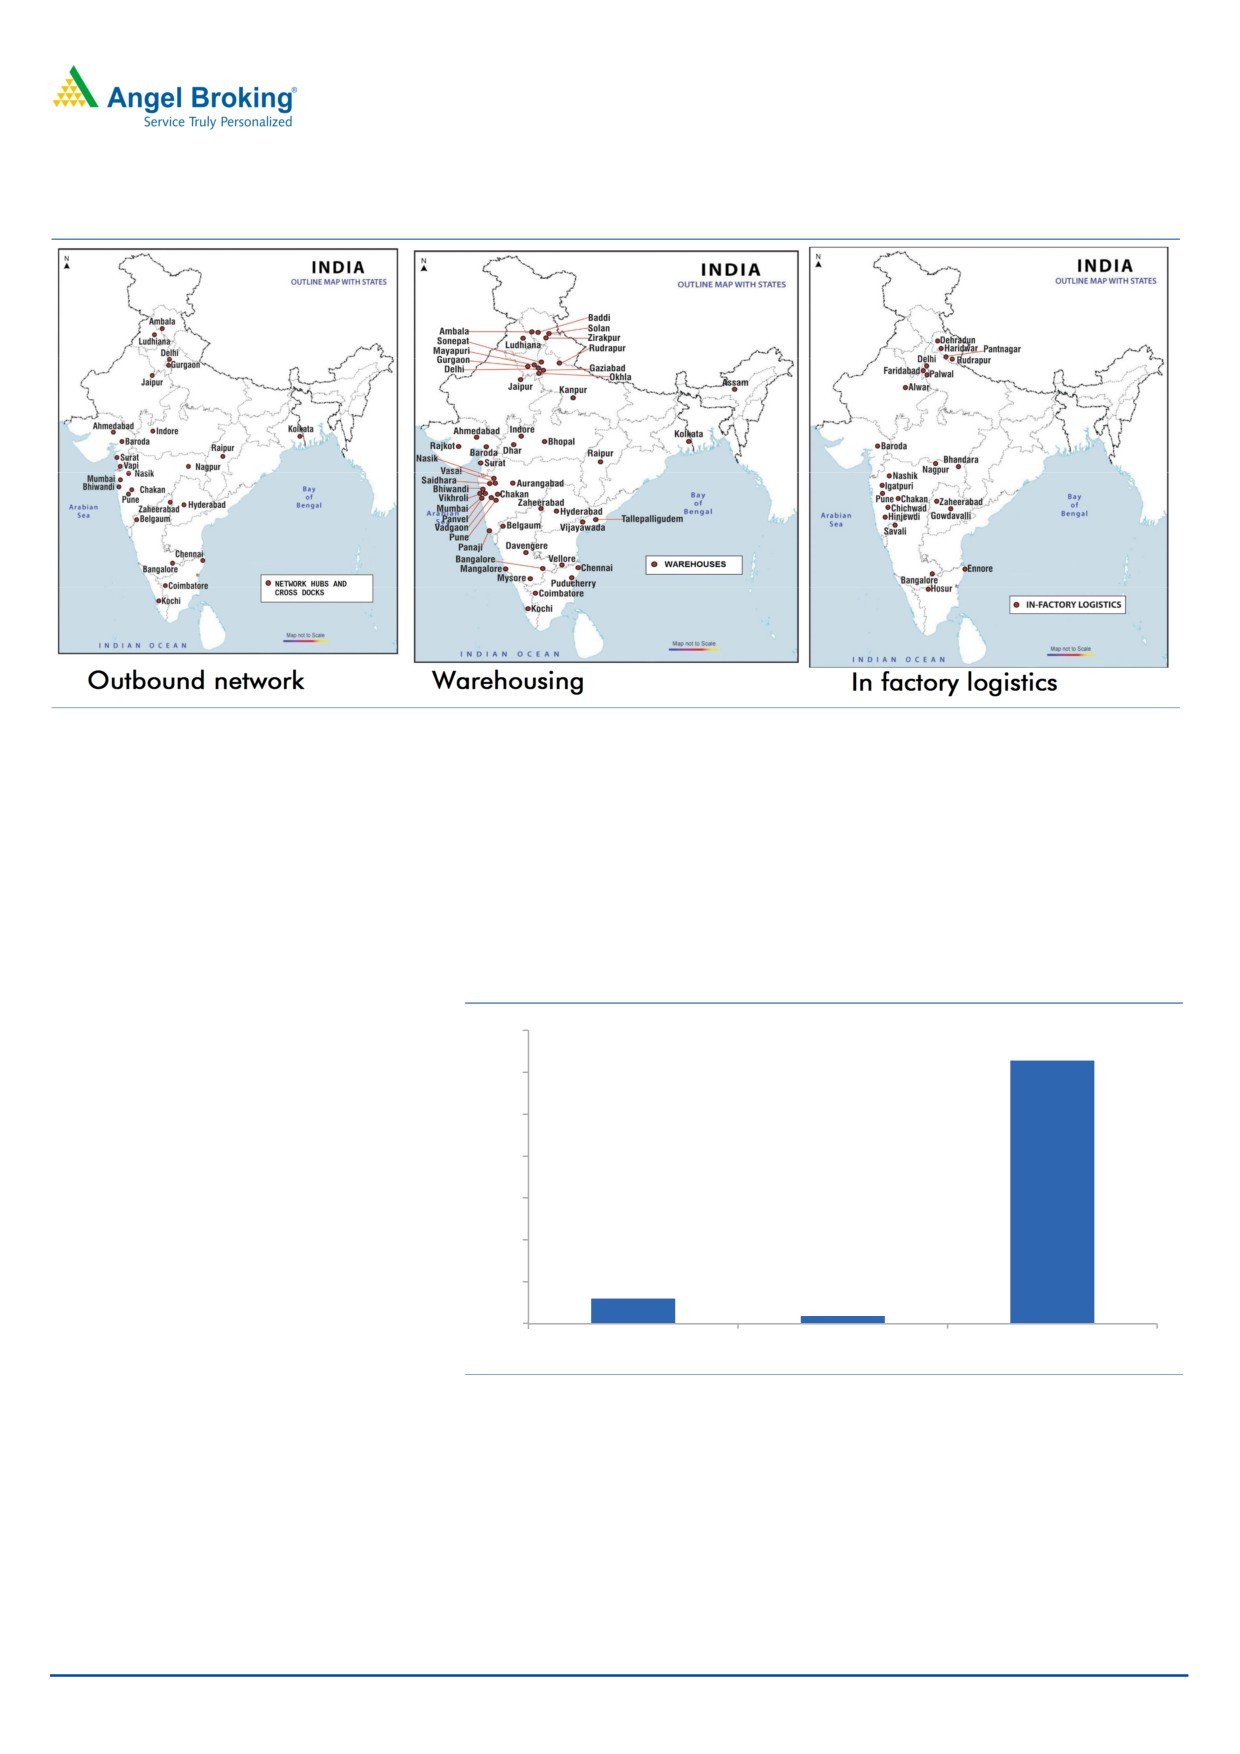
Exhibit 7: MLL’s pan India network
Source: Company, Angel Research
An asset light model: Unlike other players in the logistics industry, MLL operates an
asset light model. It has a large network of over 1,000 business partners who offer
vehicles, warehouses and the other assets and services. Company has over 10.0
million square feet of pan India warehousing space. Company also operates in-
factory stores and line-feed at over 35 manufacturing locations. All the assets are
owned by its large business partners hence, company does not require investing in
the large capex expansion unlike other industry players.
Exhibit 8: MLL’s fixed asset T/O (x) is far higher than its peers
35.0
31.4
30.0
25.0
20.0
15.0
10.0
3.0
5.0
0.9
0.0
Transport Corp.
Sical
MLL
Source: Company, Angel Research, Capitaline, # based on FY17 numbers
This asset light model has given the company capabilities to serve over
200
domestic and multinational companies operating in several industry verticals in
India. The asset light model offers considerable benefits such as improved
scalability and flexibility of offerings to suit varied sectors and customers. With the
advent of GST, the asset light model looks better placed as it has been tested with
great success in the pre-GST era. We believe that asset light model is scalable and
hence, large organized service providers like MLL will be better positioned to
acquire a larger share of the logistics market in the long term.
October 30, 2017
6
Mahindra Logistics| IPO Note
MLL has exhibited a track record of faster growth - MLL, despite having a high
dependence on its strong parent, has shown a faster revenue growth due to its
diversification in other industries. The company’s emphasis has been to grow the
non-Mahindra business, which has clearly helped it to grow faster than the industry
and within a few years of operations, the company has become one of the largest
players in the industry (B2B logistics).
While the other industry players were growing at the rate less than 10%, MLL has
managed to grow at the rate of 15% between FY2013-17. The company hired
global consultant McKinsey in 2015 to scale up its business, especially that of the
non-Mahindra segment and results are clearly visible with the 17.5% top-line
CAGR between FY2015-17. During this period, its non-Mahindra revenue in SCM
business grew at 64.5% CAGR. In FY2015, Mahindra group contributed 70% of its
business, which has changed to 54% by FY2017.
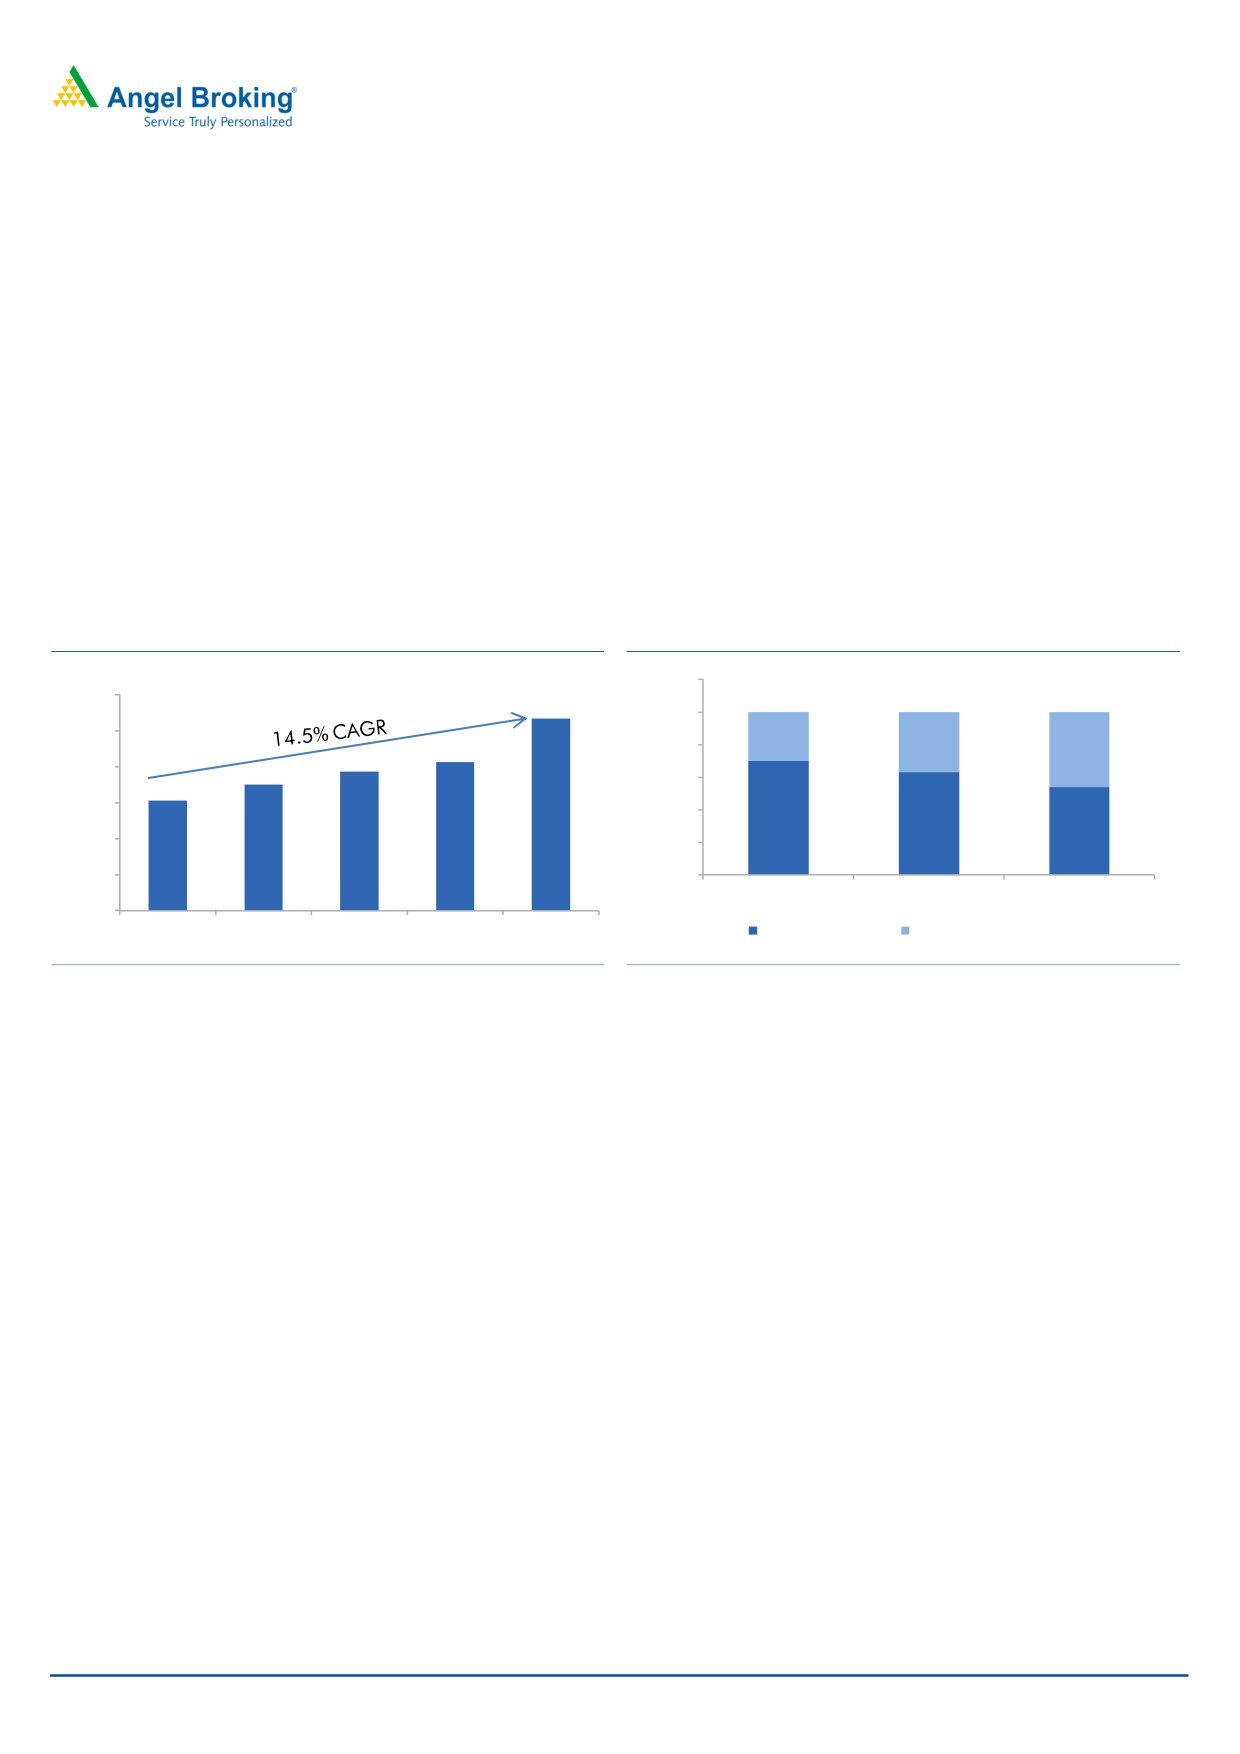
Exhibit 9: 14.5% revenue growth
Exhibit 10: Decreasing dependence on MnM
120.0%
3,000
100.0%
2,500
80.0%
29.9%
36.8%
46.0%
2,000
60.0%
1,500
40.0%
70.1%
63.2%
54.0%
1,000
20.0%
500
0.0%
FY15
FY16
FY17
0
FY13
FY14
FY15
FY16
FY17
Mahindra revenue
Non-Mahindra revenue
Source: Company, Angel Research
Source: Company, Angel Research
Financial performance: Owing to the diversification in the various industries and
growing non-Mahindra revenue, company reported 14.5% CAGR in the net sales
over FY2013-17. During this period, its peers grew by <10% rate, indicating that
asset light model garnered higher market share in the 3PL industry. On the
margins front, company saw margins improving from 2.4% in FY2013 to 2.9% in
FY2017. Adjusted for the consultant fees paid to McKinsey, the FY2017 EBITDA
margins work out to be 3.6%, indicating a 125bps appreciation in the EBITDA
margins since FY2013. The company’s PAT CAGR during this period works out to
be 17.2%, however adjusted PAT CAGR works out to be 25.2%.
October 30, 2017
7
Mahindra Logistics| IPO Note
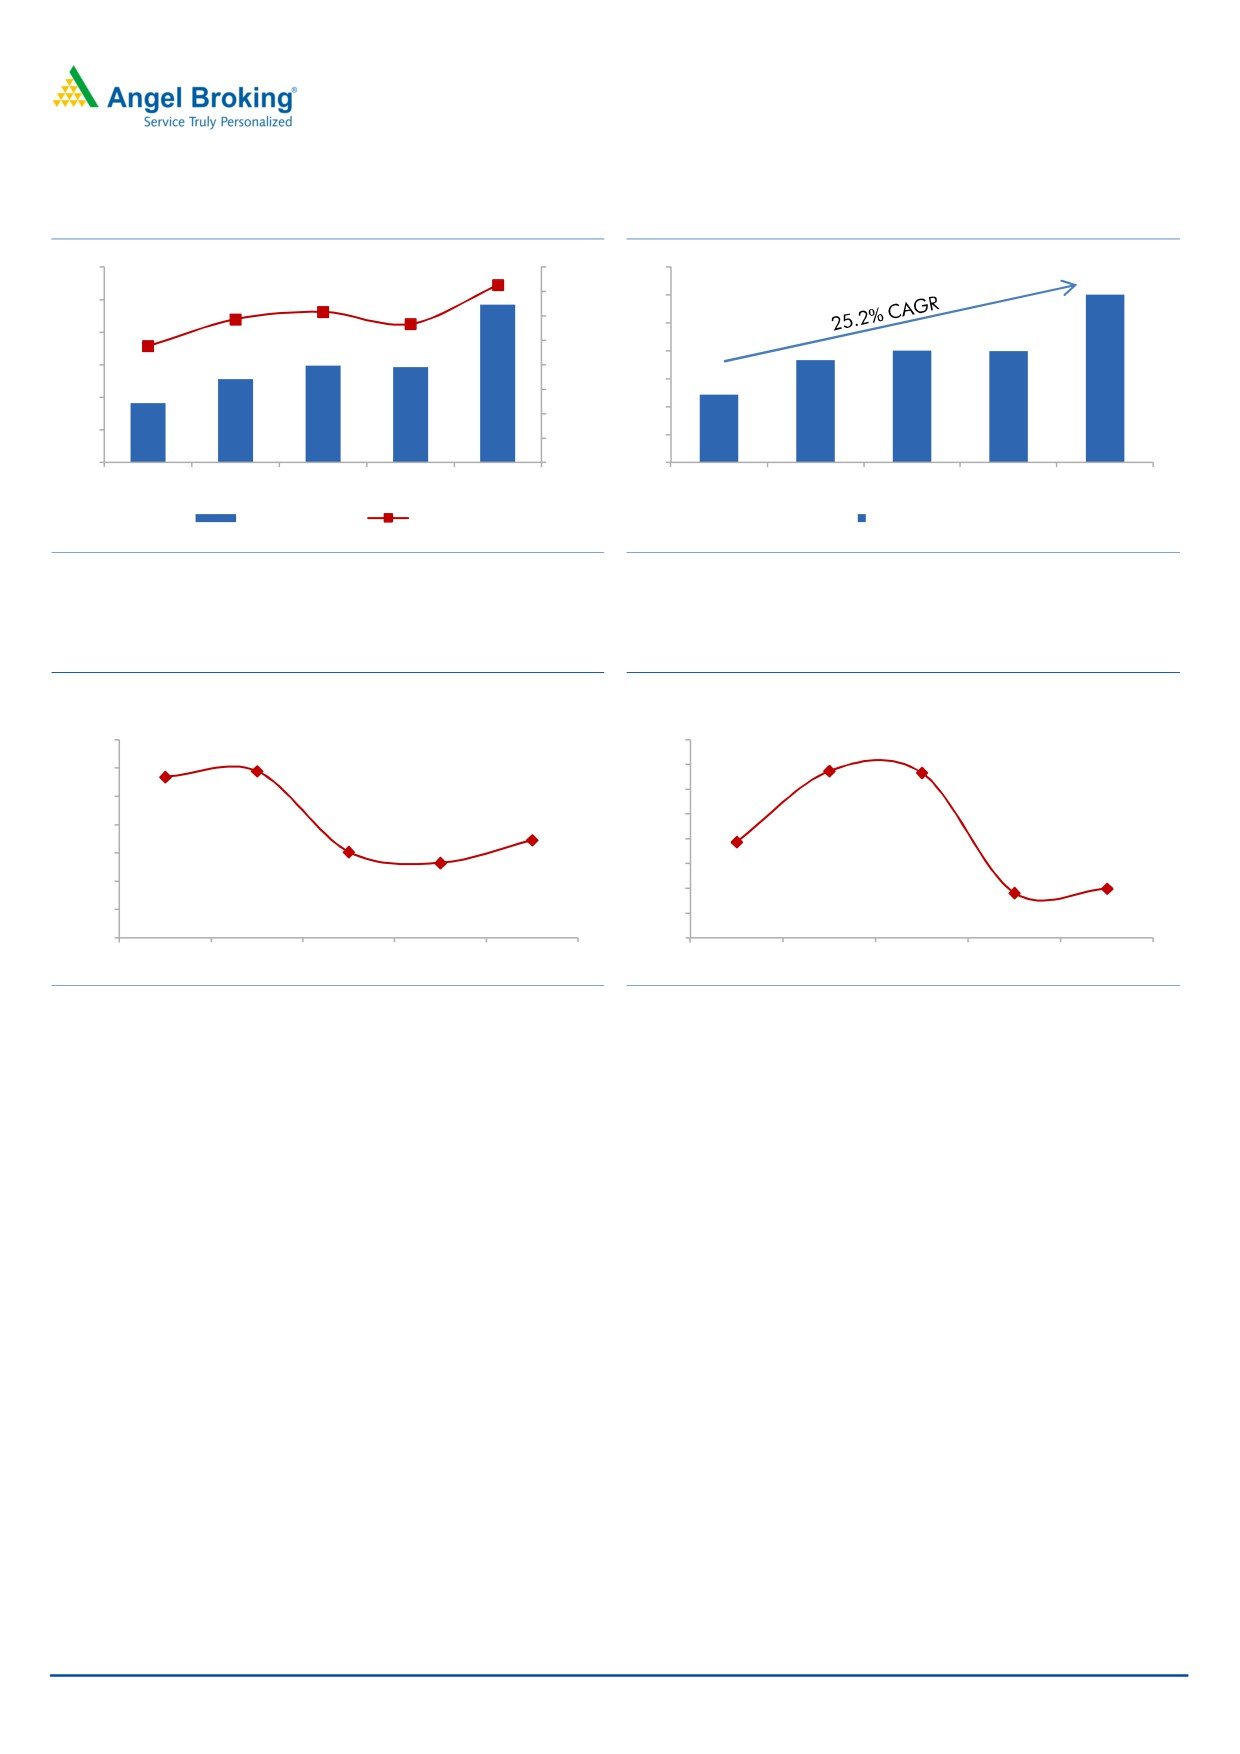
Exhibit 11: 125bps expansion in adj. EBITDA margins
Exhibit 12: 25.2% CAGR in Adj. PAT
120
3.6%
4.0%
70
3.1%
3.5%
2.9%
60
100
2.8%
3.0%
2.4%
50
80
2.5%
40
60
2.0%
30
1.5%
40
20
1.0%
20
10
0.5%
36
51
60
58
97
24
37
40
40
60
0
0.0%
0
FY13
FY14
FY15
FY16
FY17
FY13
FY14
FY15
FY16
FY17
Adjusted EBITDA
Margins
Adjusted PAT
Source: Company, Angel Research
Source: Company, Angel Research
MLL
Exhibit 13: Adj. ROE
Exhibit 14: Adj. ROIC
Adj ROE
Adj. ROIC
35.0%
160%
29.4%
135%
133%
28.4%
30.0%
140%
120%
25.0%
17.3%
100%
77%
20.0%
15.2%
13.2%
80%
15.0%
60%
40%
36%
10.0%
40%
5.0%
20%
0.0%
0%
FY13
FY14
FY15
FY16
FY17
FY13
FY14
FY15
FY16
FY17
Source: Company, Angel Research
Source: Company, Angel Research
Outlook and Valuation:
At the upper end of the price band (`425-`429), the issue is priced at 66.2x and
50.8x of its reported and adj. FY2017 earnings. Due to its asset light model, there
is no exact comparable peer; however, the thumb rule for any investment is growth
and returns. MLL has exhibited CAGR of 15% and 25% in top-line and adj.
bottom-line respectively, which is better than its players i.e. VRL logistics and
Transport Corporation of India. In terms of returns, company has shown a better
return profile (ROE & ROIC of 17% and 40% v/s. peer group avg. - 13% & 14%
respectively). Based on its growth story, diversification strategy, strong parent
repute and post GST attractiveness of the logistics sector, we assign Subscribe
rating to the issue.
Downside risks
Slowdown in the parent’s business
Consolidation by mid-sized players in the sector
October 30, 2017
8
Mahindra Logistics| IPO Note
Income statement
Y/E March (` cr)
FY14
FY15
FY16
FY17
Net Sales
1,751
1,931
2,064
2,667
% chg
14.3
10.3
6.9
29.2
Total Expenditure
1,699
1,874
2,012
2,590
Personnel Expenses
88
123
151
188
Others Expenses
1,611
1,751
1,861
2,402
EBITDA
51
57
52
76
% chg
40.7
11.1
(8.1)
45.7
(% of Net Sales)
2.9
3.0
2.5
2.9
Depreciation& Amortisation
3
6
8
15
EBIT
48
51
44
62
% chg
44.0
5.9
(13.5)
39.9
(% of Net Sales)
2.7
2.6
2.1
2.3
Other income
6
9
13
10
Interest & other Charges
0
0
1
3
Recurring PBT
54
59
56
68
% chg
50.1
9.1
(5.5)
21.2
Exceptional Items
-
-
-
-
PBT (reported)
54
59
56
68
Tax
18
21
20
22
(% of PBT)
32.6
35.0
35.7
32.1
PAT before MI
37
39
36
46
Minority Interest (after tax)
-
-
-
-
PAT after MI(reported)
37
39
36
46
Exceptional Items
-
-
-
-
Reported PAT
37
39
36
46
% chg
49.9
5.2
(6.6)
28.1
(% of Net Sales)
2.1
2.0
1.7
1.7
Basic EPS (`)
6.3
6.6
5.4
6.7
Fully Diluted EPS (`)
5.9
6.6
5.3
6.6
% chg
45.2
12.5
(19.1)
24.4
Source: DRHP, Angel Research
October 30, 2017
9
Mahindra Logistics| IPO Note
Balance Sheet
Y/E March (` cr)
FY14
FY15
FY16
FY17
SOURCES OF FUNDS
Equity Share Capital
59
60
60
68
Reserves& Surplus
65
205
242
280
Shareholder's Funds
124
265
302
348
Minority Interest
-
4
3
5
Total Loans
-
4
24
28
Other long term liabilities
2
2
2
0
Long-term provisions
6
9
12
13
Deferred Tax Liability
-
0
-
-
Total Liabilities
133
283
342
394
APPLICATION OF FUNDS
Gross Block
19
30
61
85
Less: Acc. Depreciation
5
9
16
29
Net Block
14
21
45
56
Intangible assets
1
5
5
6
Investments
0
110
68
58
Capital Work in Progress
0
0
2
1
Other noncurrent assets
32
26
55
79
Current Assets
287
357
416
618
Sundry Debtors
153
199
245
412
Cash
87
52
24
50
Loans & Advances
-
10
27
25
Other Assets
47
95
120
130
Current liabilities
202
236
249
423
Net Current Assets
85
121
167
194
Total Assets
133
283
342
394
Source: DRHP, Angel Research
October 30, 2017
10
Mahindra Logistics| IPO Note
Cash Flow Statement
Y/E March (` cr)
FY14
FY15
FY16
FY17
Profit before tax
54
59
56
68
Depreciation
3
6
8
15
Change in Working Capital
5
(21)
(67)
(61)
Interest / Dividend (Net)
(6)
(7)
(10)
(4)
Direct taxes paid
(11)
(15)
(38)
(52)
Cash Flow from Operations
49
27
(48)
(29)
(Inc.)/ Dec. in Fixed Assets
(10)
(11)
(35)
(24)
(Inc.)/ Dec. in Investments
6
(154)
36
78
Cash Flow from Investing
(4)
(165)
1
53
Issue of Equity
1.8
101.2
-
1.4
Inc./(Dec.) in loans
-
2.0
19.6
4.4
Dividend Paid (Incl. Tax)
-
-
-
-
Interest / Dividend (Net)
(0.1)
(0.2)
(1.2)
(3.3)
Cash Flow from Financing
2
103
18
2
Inc./(Dec.) in Cash
46
(35)
(28)
27
Opening Cash balances
41
87
52
24
Closing Cash balances
87
52
24
50
Source: DRHP, Angel Research
October 30, 2017
11
Mahindra Logistics| IPO Note
Key Ratios
Valuation Ratio (x)
FY14
FY15
FY16
FY17
P/E (on FDEPS)
83.4
79.2
84.9
66.2
P/CEPS
76.6
68.5
69.0
50.3
P/BV
24.5
11.5
10.1
8.8
Dividend yield (%)
0.0
0.0
0.0
0.0
EV/Sales
1.7
1.6
1.5
1.1
EV/EBITDA
57.8
52.7
58.3
39.7
EV / Total Assets
8.8
5.8
5.2
3.7
Per Share Data (`)
EPS (Basic)
6.3
6.6
5.4
6.7
EPS (fully diluted)
6.3
6.6
5.4
6.7
Cash EPS
5.6
6.3
6.2
8.5
DPS
0.0
0.0
0.0
0.0
Book Value
17.5
37.2
42.4
48.9
Returns (%)
ROCE
38.7
19.0
13.5
16.4
Angel ROIC (Pre-tax) Adj.
134.7
133.3
36.3
39.8
ROE Adj.
29.4
15.2
13.2
17.3
Turnover ratios (x)
Asset Turnover (Gross Block)
91.5
63.6
33.9
31.4
Receivables (days)
32
38
43
56
Payables (days)
39
41
39
53
Working capital cycle (ex-cash) (days)
(8)
(4)
4
4
Solvency ratios (x)
Net debt to equity
(0.7)
(0.2)
(0.0)
(0.1)
Net debt to EBITDA
(1.7)
(0.8)
(0.0)
(0.3)
Interest Coverage (EBIT / Interest)
874.2
139.6
33.4
17.7
Source: DRHP, Angel Research, #ROIC is adjusted for consultancy charges in PL statement and
Income Tax Assets in BS
October 30, 2017
12
Mahindra Logistics| IPO Note
Research Team Tel: 022 - 39357800
DISCLAIMER
Angel Broking Private Limited (hereinafter referred to as “Angel”) is a registered Member of National Stock Exchange of India Limited,
Bombay Stock Exchange Limited and Metropolitan Stock Exchange Limited. It is also registered as a Depository Participant with CDSL
and Portfolio Manager and investment advisor with SEBI. It also has registration with AMFI as a Mutual Fund Distributor. Angel Broking
Private Limited is a registered entity with SEBI for Research Analyst in terms of SEBI (Research Analyst) Regulations, 2014 vide
registration number INH000000164. Angel or its associates has not been debarred/ suspended by SEBI or any other regulatory
authority for accessing /dealing in securities Market. Angel or its associates/analyst has not received any compensation / managed or
co-managed public offering of securities of the company covered by Analyst during the past twelve months.
This document is solely for the personal information of the recipient, and must not be singularly used as the basis of any investment
decision. Nothing in this document should be construed as investment or financial advice. Each recipient of this document should
make such investigations as they deem necessary to arrive at an independent evaluation of an investment in the securities of the
companies referred to in this document (including the merits and risks involved), and should consult their own advisors to determine
the merits and risks of such an investment.
Reports based on technical and derivative analysis center on studying charts of a stock's price movement, outstanding positions and
trading volume, as opposed to focusing on a company's fundamentals and, as such, may not match with a report on a company's
fundamentals. Investors are advised to refer the Fundamental and Technical Research Reports available on our website to evaluate the
contrary view, if any.
The information in this document has been printed on the basis of publicly available information, internal data and other reliable
sources believed to be true, but we do not represent that it is accurate or complete and it should not be relied on as such, as this
document is for general guidance only. Angel Broking Pvt. Limited or any of its affiliates/ group companies shall not be in any way
responsible for any loss or damage that may arise to any person from any inadvertent error in the information contained in this report.
Angel Broking Pvt. Limited has not independently verified all the information contained within this document. Accordingly, we cannot
testify, nor make any representation or warranty, express or implied, to the accuracy, contents or data contained within this document.
While Angel Broking Pvt. Limited endeavors to update on a reasonable basis the information discussed in this material, there may be
regulatory, compliance, or other reasons that prevent us from doing so.
This document is being supplied to you solely for your information, and its contents, information or data may not be reproduced,
redistributed or passed on, directly or indirectly.
Neither Angel Broking Pvt. Limited, nor its directors, employees or affiliates shall be liable for any loss or damage that may arise from
or in connection with the use of this information.
October 30, 2017
13