IPO Note | Pharmaceuticals
14-Jun-17
Eris Lifesciences Limited
SUBSCRIBE
sue Open: June 16, 2017
Is
Strong fundamentals leading to growth rewards
Issue Close: June 20, 2017
Eris Lifesciences is an Ahmedabad based pharma company. It manufactures and
sells branded pharmaceutical products in the chronic and acute therapeutic areas
Issue Details
and has 100% domestic focus. The company’s 66% revenue contribution is from
the chronic segment, while 34% is from the acute segment. It has a formulations
Face Value: `1
facility located in Guwahati.
Present Eq. Paid up Capital: `13.75cr
Focus on niche therapeutic segments: Since its inception, the company has been
focusing on chronic and specialty acute therapeutic segments. This strategy has
Offer for Sale: 2.89cr Shares
played well for the company, as it has gained market share in most of the
Fresh issue: Nil
therapeutic segments of its focus. This has also helped the company to become
Post Eq. Paid up Capital: `13.75cr
32nd largest company by revenue in domestic pharma industry within a decade.
Issue size (amount): *`1,732cr -**1,741 cr.
100% domestic branded generic player: The business of Eris is 100% domestic
and the company has no intention to start exports. This, we believe is a
Price Band: `600-603
differentiated strategy, as it insulates the company form the risk of foreign
Lot Size: 24 shares and in multiple thereafter
regulator as well as higher expenses in terms of R&D. This bodes well in the times
of heightened regulatory issues in the sector.
Post-issue implied mkt. cap:
*`8,250cr
-
**`8,591cr
Strong track record of growth and profitability: Eris has exhibited a growth CAGR
Promoters holding Pre-Issue: 59.2%
of 16.5% in the top-line over the last five years. Company also has a good
EBITDA margin profile, 37% in FY2017, much better than its Indian and MNC
Promoters holding Post-Issue: 55.93%
peers. Moreover, the margins have seen consistent expansion owing to which, its
*Calculated on lower price band
bottom-line CAGR works out to be 42.6% over the last five years (4.1x growth).
** Calculated on upper price band
Company has strong RoE and RoIC ratios as compared to peers, and we believe
that with its specialty focus and marketing & selling capability, it will be able to
Book Building
maintain healthy financial profile going ahead.
QIBs
75% of issue
Outlook and Valuation: On FY2017 EPS of `17.6, the issue is priced at P/E of
Non-Institutional
15% of issue
34.25x, which is at par with its MNC peers but higher than domestic peer, Alkem
Labs. Considering that Eris’ faster growth, superior returns, debt free status, and
Retail
10% of issue
specialty play, we believe that this is a fair valuation. We believe that Eris is likely
to continue growing faster than its competitors owing to its marketing capability,
higher operating leverage and growing market share of its mother brands. While
most pharma companies are currently facing issues on several fronts, this
Post Issue Shareholding Pattern
business model looks attractive with no USFDA concerns and pricing pressure.
Promoters Group
55.9
Considering the company’s superior growth, better margin profile and high return
ratios, we rate this IPO as SUBSCRIBE.
DIIs/FIIs/Public & Others
44.1
Key Financials
Y/E March (` cr)
FY14
FY15
FY16
FY17
Net Sales
509
546
597
725
% chg
29.5
7.2
9.4
21.4
Net Profit
70
89
134
242
% chg
21.0
26.7
49.7
81.2
OPM (%)
19.4
22.3
28.7
37.1
EPS (Rs)
5.1
6.5
9.7
17.6
P/E (x)
117.7
92.9
62.1
34.3
P/BV (x)
47.0
31.2
27.7
15.4
RoE (%)
39.9
33.6
44.6
44.8
Shrikant Akolkar
RoCE (%)
49.2
38.7
46.4
44.2
+91 22 39357800 Ext: 6846
EV/Sales (x)
16.1
14.9
13.6
11.1
EV/EBITDA (x)
83.0
66.9
47.3
29.9
Source: Company, Angel Research
Please refer to important disclosures at the end of this report
1
Eris Lifesciences| IPO Note
Company background
Eris Lifesciences is a Gujarat based Pharma Company. It was started in 2007 by
Mr. Amit Bakshi and in the short period of ten years, it has become one of the
fastest growing companies in the domestic pharma space. It has also ascended to
the 32nd position in terms of market share during this short period. Company
develops, manufactures and commercializes branded pharmaceutical products in
select therapeutic areas within the chronic and acute categories, such as
cardiovascular, anti-diabetics, vitamins, gastroenterology, and anti-infective. Its
primary focus has been on developing products in the super specialties in the
chronic and acute category, which are linked to lifestyle related disorders.
Company has a formulation facility located in Guwahati (Assam), which
contributed 60% of FY2017 revenues (FY2016 - 51.56%). Its manufacturing
partner Sozin Flora Pharma constituted 28.16% of its revenue in FY2016 and
18.67% in FY2017. The rest came from third party manufacturing.
Exhibit 1: Revenue mix based on manufacturing facilities
Manufacturer
FY16
FY17
Guwahati (Captive)
52%
59%
Sozin Flora Pharma (partner) - until August 2016
28%
19%
Third Party Manufacturers
20%
22%
Total
100%
100%
Source: Company, Angel Research
Eris is a 100% domestic branded generic player and has no intent to start
exporting. Recently, in July 2016, company acquired Amay Pharma’s trademarks
of 40 brands in cardiovascular and anti-diabetics space for `32.9cr. Eris has also
purchased 75.5% stake in a musculoskeletal disorder focused pharma company
Kinedex for `77.2cr. Company has indicated that it will foray in neurological pain,
dermatology and gynecology. Eris’ top 10 brands have leading market share
positions, while 10 mother brands represent 72.5% of its revenues. Company had
total 1,501 medical representatives as of March 2017.
Botticelli, ChrysCapital’s investment arm purchased 16.25% equity stake in the
company for `87.27 per share (total `195cr), which is seeking exit from the
company through this IPO.
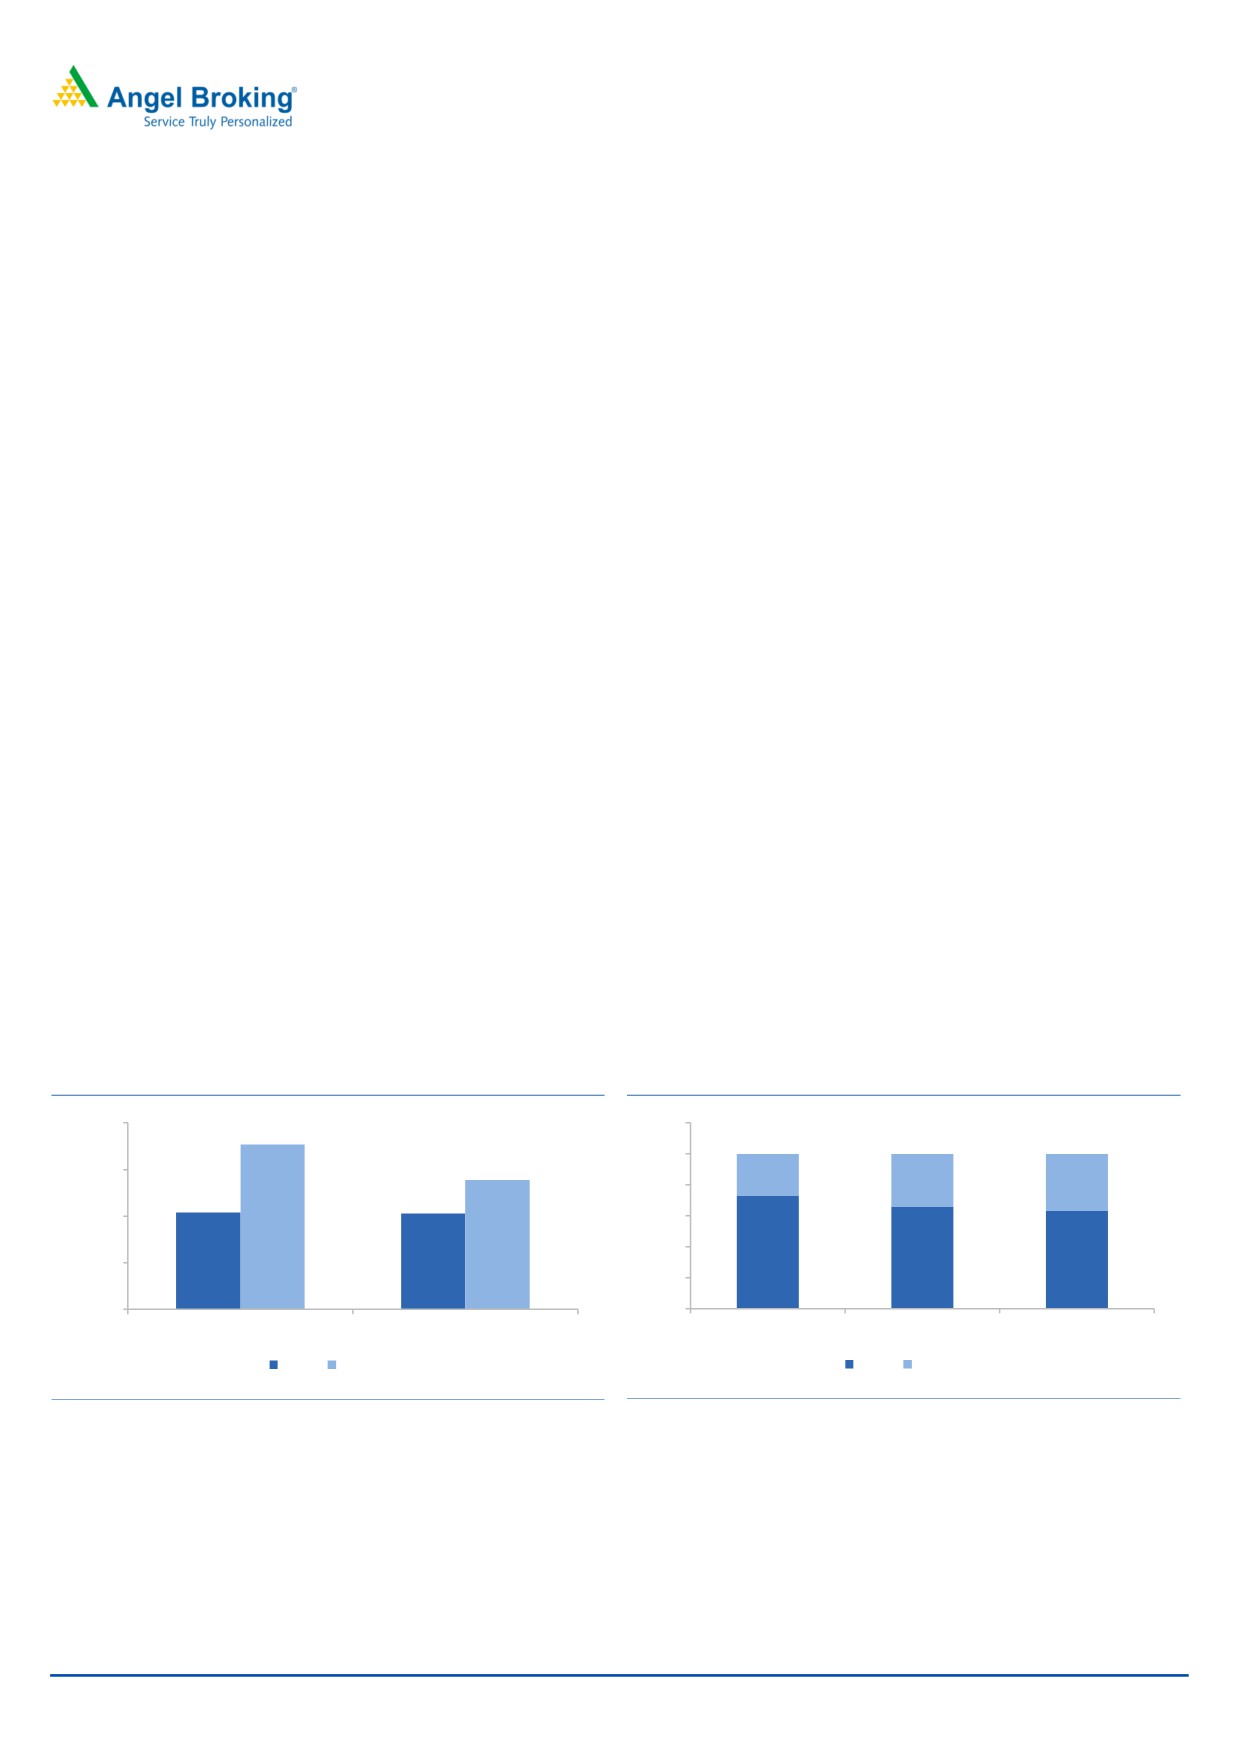
Exhibit 2: Revenue mix (%)
Exhibit 3: Therapeutic segment mix (%)
Gynaecology,
Others - Acute,
Anti-infectives:,
3%
3%
Acute pain-
3%
analgesics, 3%
Gastroenterolo
Acute, 34%
gy, 9%
Cardiovascular
, 33%
Chronic, 66%
Vitamins, 14%
Anti-diabetics,
Others -
29%
Chronic, 4%
Source: Company, Angel Research
Source: Company, Angel Research
June 14, 2017
2
Eris Lifesciences| IPO Note
Issue details
Through this IPO, existing shareholders i.e. ChrysCapital is selling its entire
16.25% shareholding from the company. Promoters are also selling some of their
shares in this IPO. This is a 100% OFS issue and no fresh shares will be issued by
the company.
Exhibit 4: Pre and Post-IPO shareholding of selling shareholders
Selling shareholders
Pre-issue shares held
Percentage of pre-issue capital
Post issue
Percentage of post- issue capital
Amit Indubhushan Bakshi
54,959,000
40.0%
54,271,500
39.5%
Himanshu Jayantbhai Shah
6,972,000
5.1%
6,284,500
4.6%
Inderjeet Singh Negi
6,971,000
5.1%
5,939,833
4.3%
Kaushal Kamlesh Shah
5,500,000
4.0%
4,468,833
3.3%
Mr. Rajendrakumar Rambhai Patel
6,971,000
5.1%
5,939,834
4.3%
Botticelli (ChrysCapital)
22,344,000
16.3%
Nil
Nil
Bhikhabhai Chimanlal Shah
12,429,000
9.0%
11,054,000
8.0%
Hetal Rasiklal Shah
5,500,000
4.0%
4,812,500
3.5%
Total
121,646,000
88.5%
92,771,000
67.5%
Source: Company, Angel Research
Objects of the offer
Achieve the benefits of listing of the equity shares on the stock exchanges
Sale of up to 28,875,000 Equity Shares by the Selling Shareholders
June 14, 2017
3
Eris Lifesciences| IPO Note
Investment Rationale
Chronic segment focus, a right strategy since inception: Since its incorporation,
company has maintained its focus on bringing products primarily focused on
therapeutic areas, which require the intervention of specialists and super
specialists. This means focus on chronic segments like cardiology, diabetology, etc.
The company is also focused on the acute therapeutic segments, which are linked
to the lifestyle diseases such as, Gynecology, gastroenterology, etc. This has
proved beneficial for the company, as it has differentiated itself by focusing on the
segments in which it can use its sales and marketing expertise.
The strategy to focus on the chronic and lifestyle related acute therapies is a right
strategy, as most pharma companies in Indian market are also focusing on the
chronic segment. The Indian Pharma Market (IPM) is also witnessing this change.
While acute is the largest segment in IPM, the growth of this segment has been
slower (10.40%) than that of chronic segment (17.70%) from 2011 to 2016. Due
to the faster growth, share of chronic therapies is going up in the IPM. It is believed
that by 2021, chronic therapies will contribute 37% of IPM revenues v/s. 34% in
2016 and 27% in 2011.
Chronic diseases like cancer, diabetes, cardiovascular, etc. are caused due to the
change in the lifestyle and sometimes they are also not curable. These types of
diseases also require prolonged medication. On the other hand, acute diseases
are the ones where the market is competitive and they are mainly treated by
general practitioners (GPs) and consulting physicians (CPs). Some indications from
acute therapies are also moving to the OTC segment, where the already
established brands have better chance to perform. The chronic therapies, however,
are complex and need special attention by the specialists. This means that
companies with strong relationship with doctors are better placed to benefit from
pricing advantage and can fare better than others.
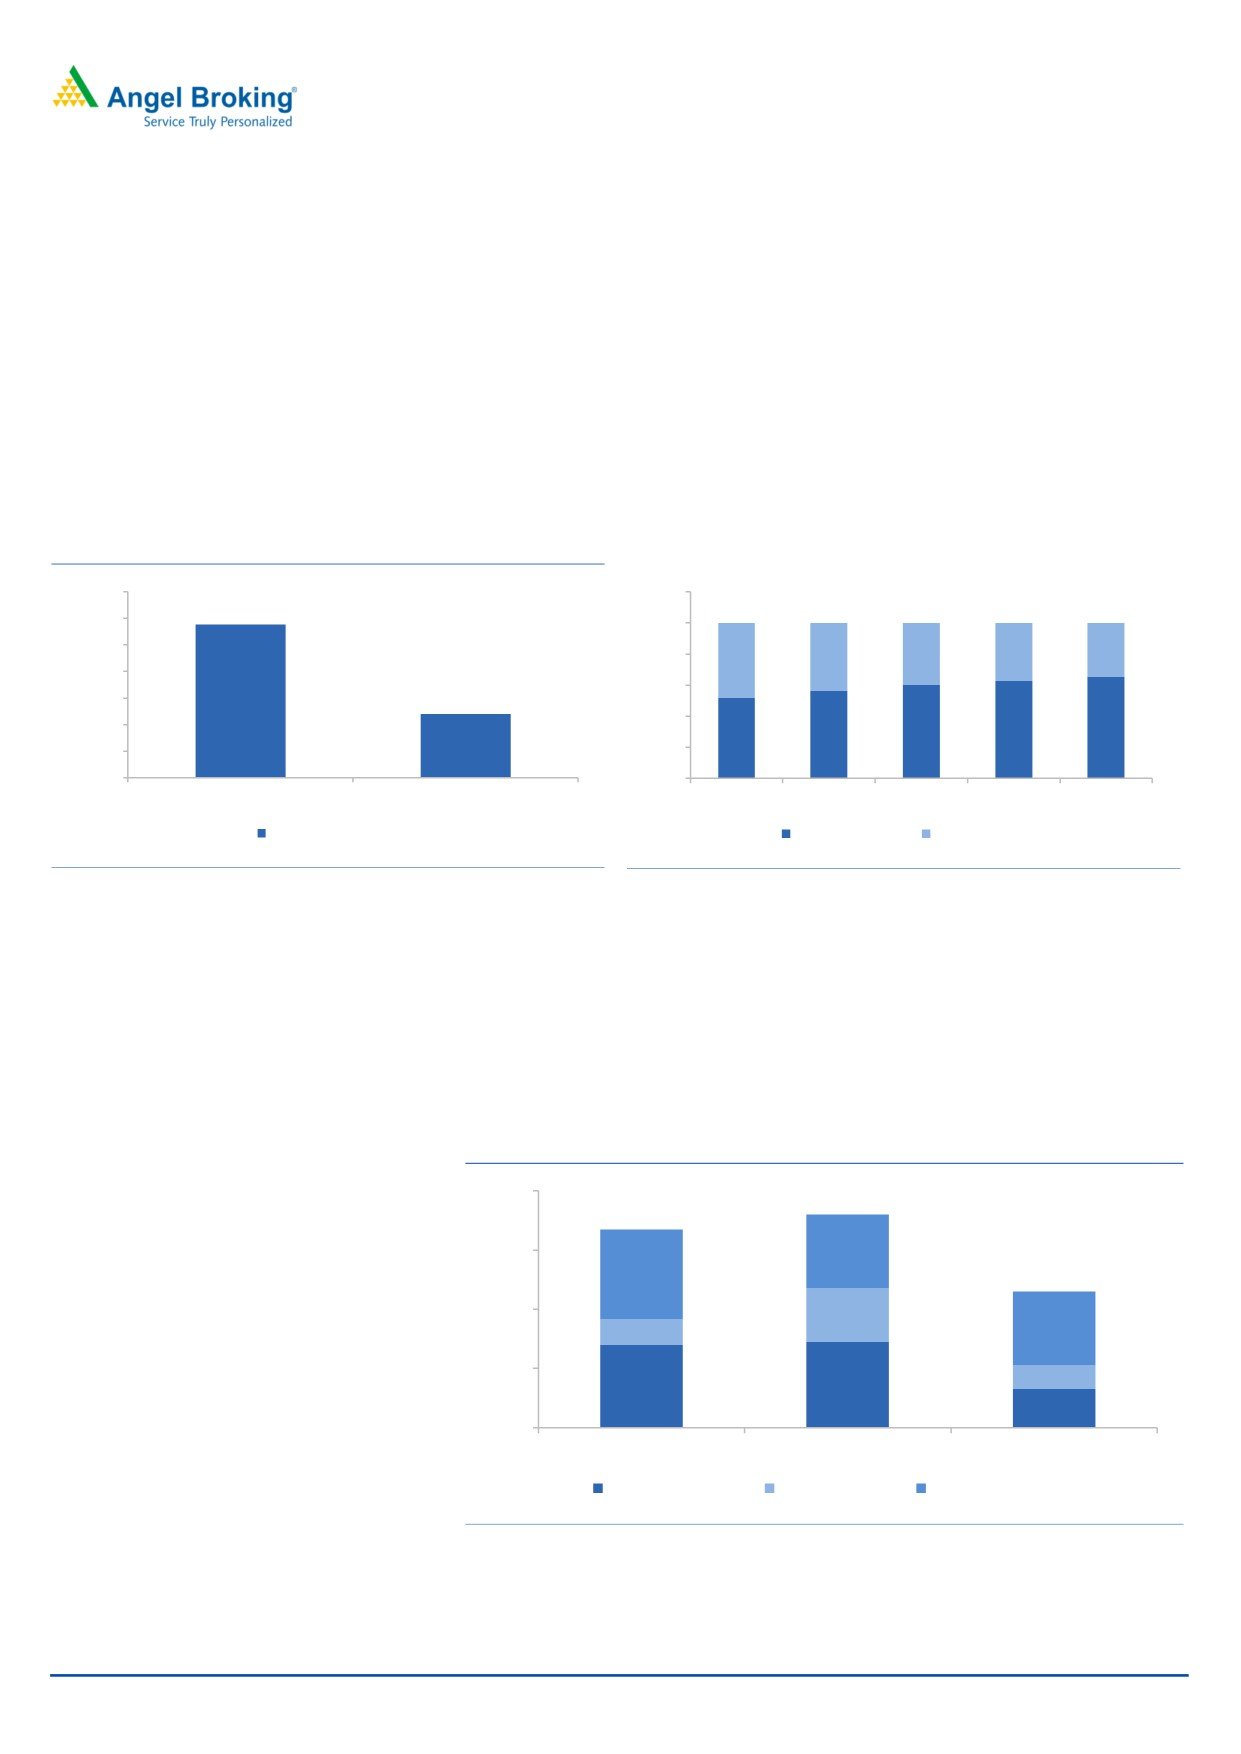
Exhibit 5: Chronic therapies to grow faster...
Exhibit 6: ...shifting IPM revenue mix
20.00%
120%
100%
15.00%
27%
80%
34%
37%
10.00%
60%
40%
73%
5.00%
66%
63%
20%
10%
18%
10%
14%
0.00%
0%
2011-16
2016-21
2011
2016
2021
Acute Chornic
Acute Chornic
Source: Company, Angel Research
Source: Company, Angel Research
June 14, 2017
4
Eris Lifesciences| IPO Note
Strong track record of growth: Eris’ portfolio is tilted more towards the chronic
segment, which represents 66% of its sales. The revenue from the chronic segment
has grown at a CAGR of 29% over FY2013-17. The acute segment revenue
represents the rest 34% business mix and has grown at a CAGR of 12% during the
same period. Due to the higher contribution from the high growth chronic
segment, company has been able to outperform the IPM growth so far. Eris’ top-
line has grown at a CAGR of
21.7% over FY2013-17, giving a strong
outperformance v/s. IPM growth of ~12% during this period.
While the chronic play has benefitted the company, the promoter’s experience in
pharma marketing has also paid the company richly.
Exhibit 7: Eris’ fastest growing segment - Chronic
Exhibit 8: Rising contribution of Chronic in revenue mix
35.00%
120%
28.89%
30.00%
100%
25.00%
80%
44%
40%
37%
34%
48%
20.00%
60%
15.00%
12.02%
40%
10.00%
63%
66%
52%
56%
60%
5.00%
20%
0.00%
0%
Chronic category
Acute category
FY13
FY14
FY15
FY16
FY17
FY13 - FY17 - CAGR
Chronic category
Acute category
Source: Company
Source: Company
Foray in new chronic therapies to help gain further market share: As per IMS
report, IPM largely remains volume growth market than price growth. In FY2015
and FY2016, domestic pharma market grew by 5.6% and 5.8% respectively, in
volume terms, while in pricing terms it grew by 1.7% and 3.6% each. The new
drug launches have also contributed meaningful 6.1% in FY2015 and 5% each in
FY2016 and FY2017. We believe that the companies launching new drugs and
keeping competitive prices will be successful in domestic pharma.
Exhibit 9: India Pharma Market (IPM) - Key growth drivers
16.00
14.4
13.4
12.00
5.00
6.10
9.2
8.00
3.60
1.70
5.00
4.00
1.60
5.60
5.80
2.60
0.00
FY15
FY16
FY17
Volume Growth (%)
Price Growth (%)
New launches (%)
Total
Source: Company, Angel Research, data for FY17
Eris, while consolidating its presence in existing therapeutic areas, intends to focus
on pursuing opportunities in other therapeutic areas such as, chronic neurological
pain, dermatology and gynecology. These, we believe are significantly meaningful
June 14, 2017
5
Eris Lifesciences| IPO Note
opportunities and if the company is able to replicate its success in existing
therapies in these, it will be able to sustain the current growth rate trajectory, and
while doing so, it would also gain market share and rise in the ranks in IPM at a
faster pace.
Exhibit 10: Foray in the new therapies with meaningful market size
Segment
Market size (` cr.) FY13-17 CAGR Current revenue Strategy
Neurology
6,884
12.20%
167.5
Focus on chronic neuropathic pain
Dermatology
7,993
18.20%
NA
New launches
Gynecology
5,571
9.90%
0
Focus on female infertility and endocrine disorders
Osteoarthritis and
1,042
10.70%
0
leverage on Kinedex acquisition
musculoskeletal
Source: Company, Angel Research, data for FY17
Acquisitions in specialty therapeutic segments: Eris has also sought an inorganic
growth route owing to the growth opportunities in the specialty therapies and its
cash rich balance sheet.
Exhibit 11: Recent acquisitions
Company Description
75.48% stake acquired in 2016 for `77.2cr
Rosiflex is the largest brand with `39.6cr sales in FY2017
Kinedex
Major focus on mobility related disorders like musculoskeletal therapies, acquisition likely to help company in gaining market share in
this specialty segment
Acquired 40 brands from Aprica Pharma (erstwhile Amay) in 2016 for `37.9cr.
Aprica
Total revenue `19.3cr in FY2017
Pharma
Major focus on cardiovascular and anti-diabetics, acquisition is likely to consolidate its current position in the CV and anti-diabetic
segments
Source: Company, Angel Research
Most brands of Eris are gaining market share: Eris, since launching its products,
has seen strong growth traction in its mother brands. The DRHP speaks of 15 such
mother brand groups, which represent 85% of its total business. In their respective
categories, these mother brands have seen growth traction. Mother brands
representing
~55% of its business have exhibited a strong growth rate,
outperforming the segment growth. While old brands feature in the top 5 in their
respective categories, recently launched brands like Metital (Gynac) and Cyblex
and Tendia (anti-diabetic) have also quickly gained market share.
Exhibit 12:
Mother brand
Launch year
Market Share
Revenue (` cr.)
CAGR FY13-17
Prescription rank
% of revenue
Glimisave
2007
5.50%
171
29.00%
3
20%
Eritel
2008
5.30%
102
28.50%
4
12%
Olmin
2010
6.80%
49
36.10%
3
6%
LN Bloc
2012
10.80%
36
168.4
2
4%
Tendia
2015
7.20%
29
NA
3
3%
Crevast
2010
2.50%
23
20.40%
6
3%
Cyblex
2014
4.20%
22
NA
6
3%
Marzon
2011
57.00%
19
7.60%
1
2%
Metital
2014
19.70%
12
NA
1
1%
Source: Company, Angel Research, data for FY17
June 14, 2017
6
Eris Lifesciences| IPO Note
Two of its brands, Glimisave (Anti-diabetics) and Eritel (Hypertension), which
represent 31% of FY2017 sales, have seen a growth CAGR of ~29%. This we
believe is an indication that these brands can further go on gaining market share.
Also, going by the track record, there is also a probability that more brands will
gain further market share in future implying that Eris’ branded generics business
has strong potential.
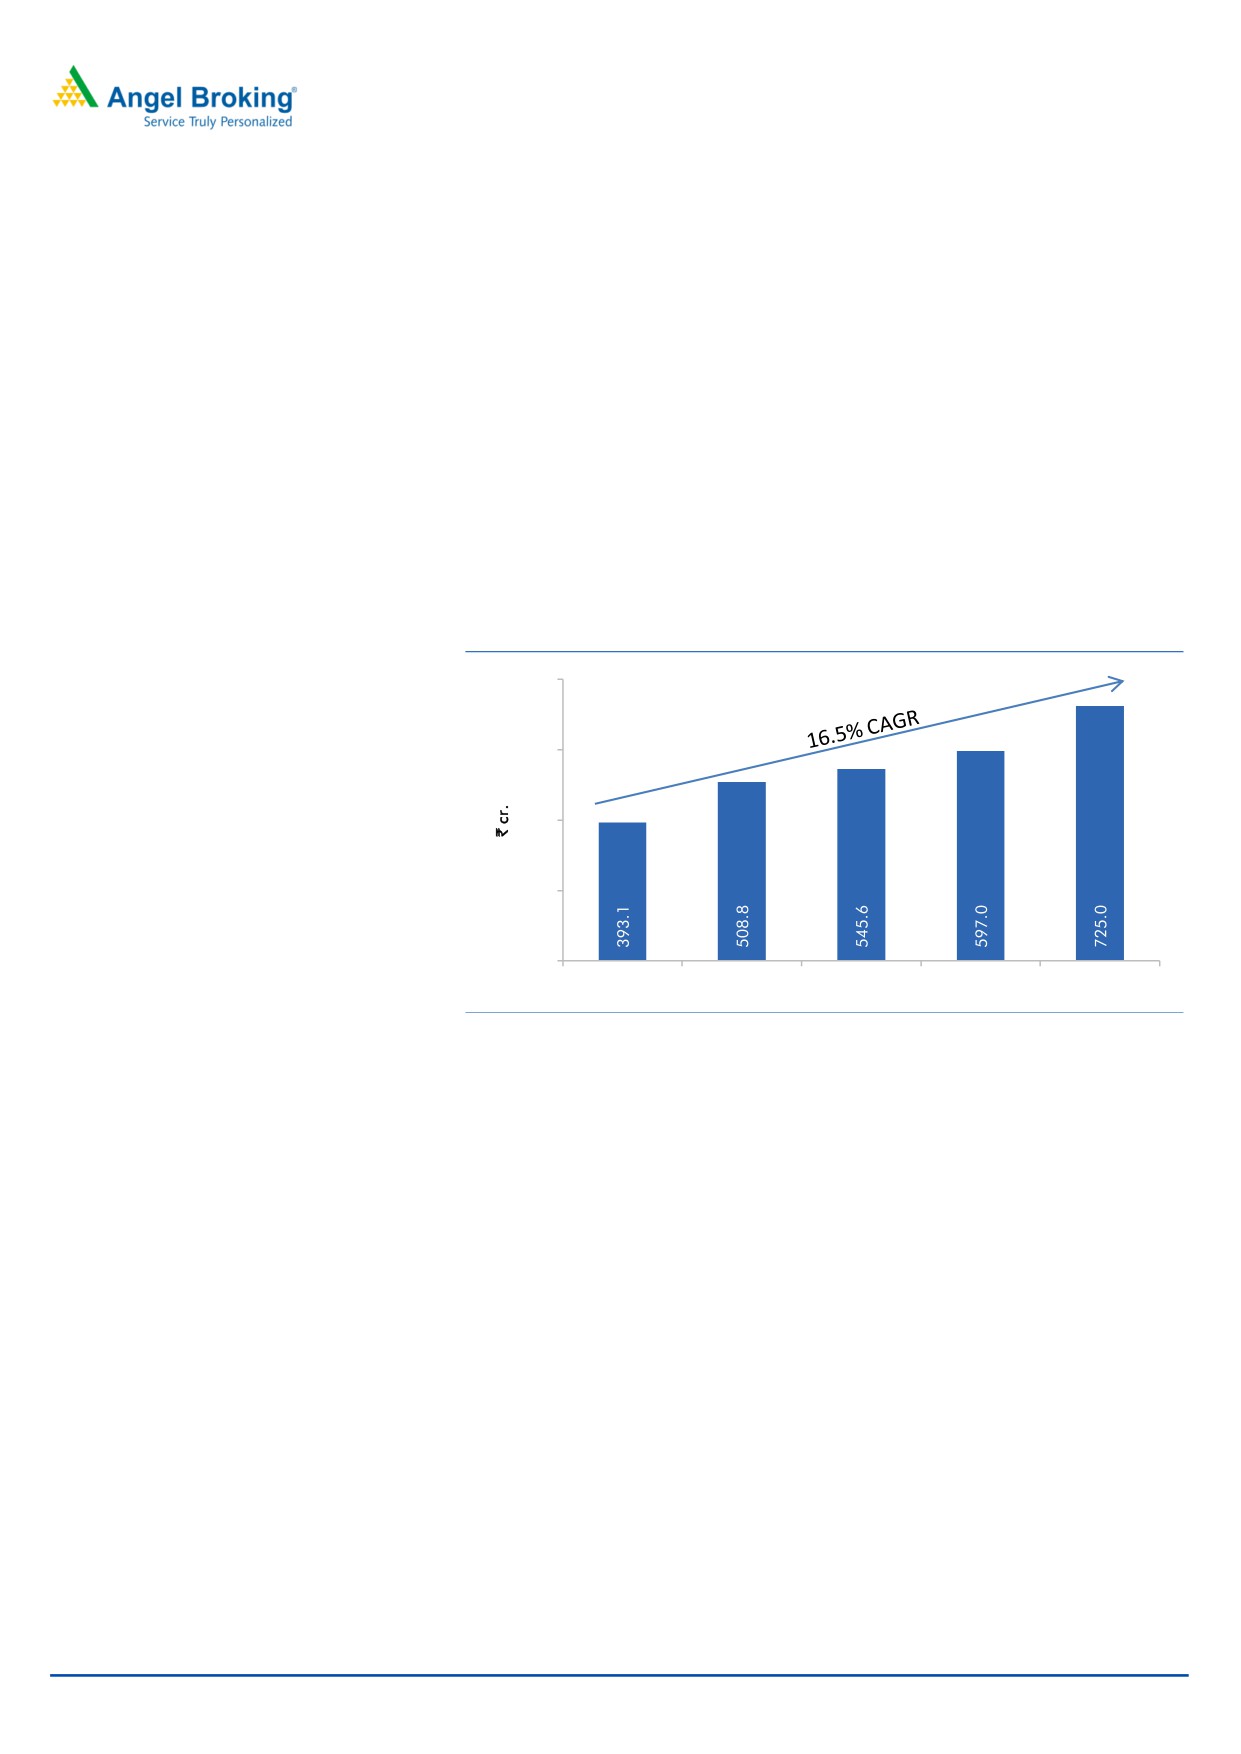
Eris is one of the fastest growing pharma companies in IPM: With its strong
marketing and sales capabilities and strategy to focus on only specialty segments,
company has been able to grow faster than its competitors. With 16.5% CAGR
over FY2013-17, Eris has gained 0.7% market share and it is now ranked as 32nd
company in IPM. During this period, top 35 companies in IPM grew by 12.1%. In
the chronic category, Eris is ranked at 20th position with 1.4% market share and it
is the fastest growing company in the top 25 companies in this category.
Exhibit 13: Net sales CAGR of 16.5% in the last 5 years
800
600
400
200
0
FY13
FY14
FY15
FY16
FY17
Source: Company, Angel research
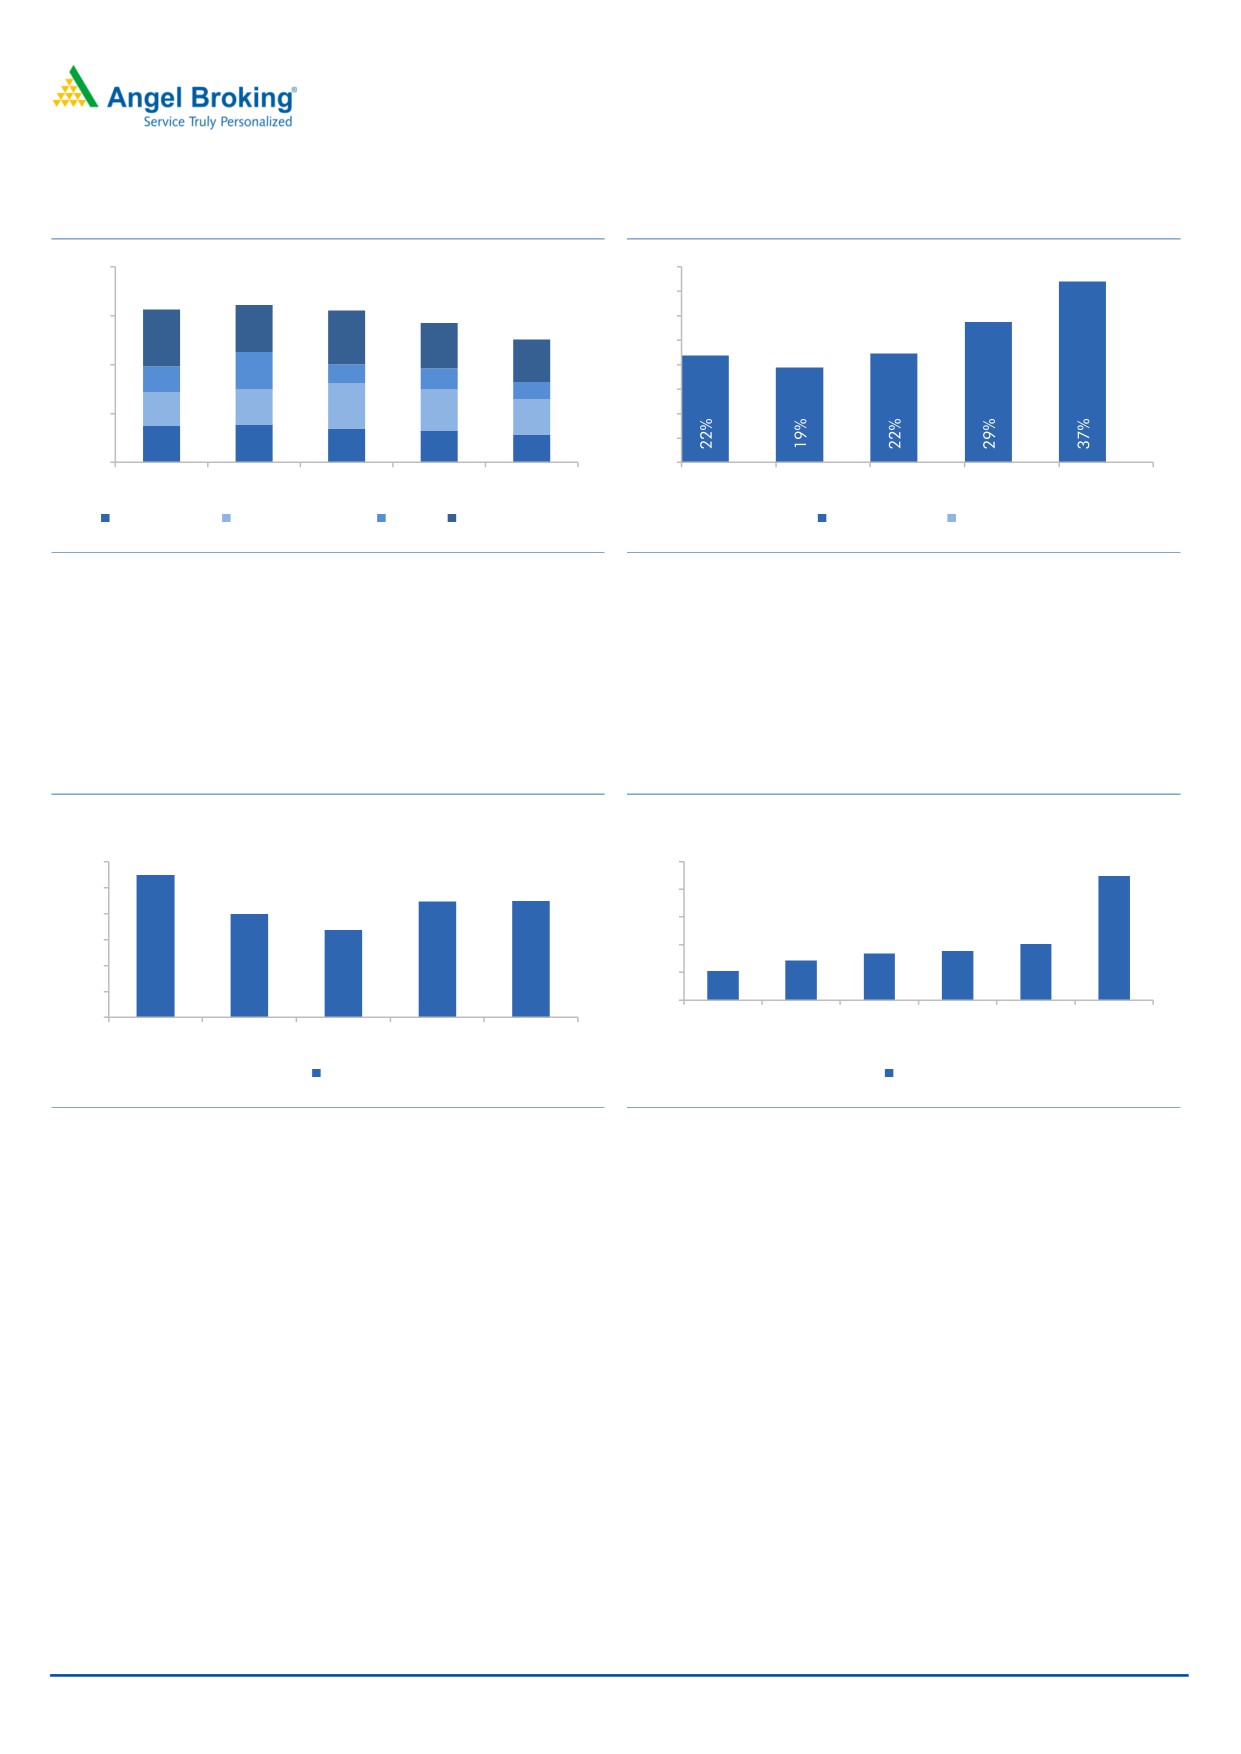
Superior financials vis-à-vis peers: Owing to its superior growth, low cost strategies
and focus on niche therapeutic segments, Eris has exhibited strong record in
profitability and returns. Between FY2014-17, company has consistently seen
improvement in its margins and returns. The EBITDA margins increased from
19.4% in FY2014 to 37.1% in FY2017. This margin profile is far superior to its
peers, who have highest domestic exposure like Alkem labs or MNC pharma
companies.
June 14, 2017
7
Eris Lifesciences| IPO Note
Exhibit 14: Consistent decline in operating costs...
Exhibit 15: ...helping to improve EBITDA margins
100%
40%
35%
75%
30%
24%
29%
28%
25%
23%
50%
22%
20%
19%
10%
13%
11%
9%
15%
17%
18%
23%
25%
21%
18%
10%
5%
19%
19%
17%
16%
14%
0%
0%
FY13
FY14
FY15
FY16
FY17
FY13
FY14
FY15
FY16
FY17
Raw Materials
Employee expenses
SG&A Other expenses
EBITDA margins
FY13
Source: Company, Angel Research
Source: Company, Angel Research
Healthy return ratios: Owing to the superior margin profile, company has
consistently seen return on equity greater than 30% in the last five years. In the last
two years, RoE has been healthy at 44% v/s. its MNC peers having RoE of 10%-
18%.
Exhibit 16: More than 30% ROE for last five years...
Exhibit 17: ...and superior than its peers
RoE
ROE
60.0
50.0
50.0
40.0
40.0
30.0
30.0
20.0
20.0
10.0
10.0
0.0
0.0
Pfizer
GSK
Abbott India Sanofi
Alkem
Eris
FY13
FY14
FY15
FY16
FY17
pharma
RoE
ROE
Source: Company, Angel Research
Source: Company, Angel Research
Eris is a debt free company and has been investing its cash flows in the liquid
investments. So far, management has refrained from fund raising, expect the one
that was raised from ChrysCapital. We believe that the strong cash flows so far
have been the prime reason that the management has taken a conservative
approach. Lately, with two acquisitions, we see some change in the approach and
we see this as a positive change. Moreover, the company has also paid dividends
in the last two years, and if this goes on, ratios are likely to improve further.
The company has a liquid balance sheet, in FY2017, 42% of its total assets were
held in liquid instruments (cash and investments) v/s. 50% in FY2016. Due to this,
we believe that RoIC is a good measure of calculating shareholders returns. Eris’
average RoIC works out to be more than 100% over FY2013-17 v/s. peers RoIC of
<30%. On the return ratios, Eris shows a far superior performance than its peers,
which we like.
June 14, 2017
8
Eris Lifesciences| IPO Note
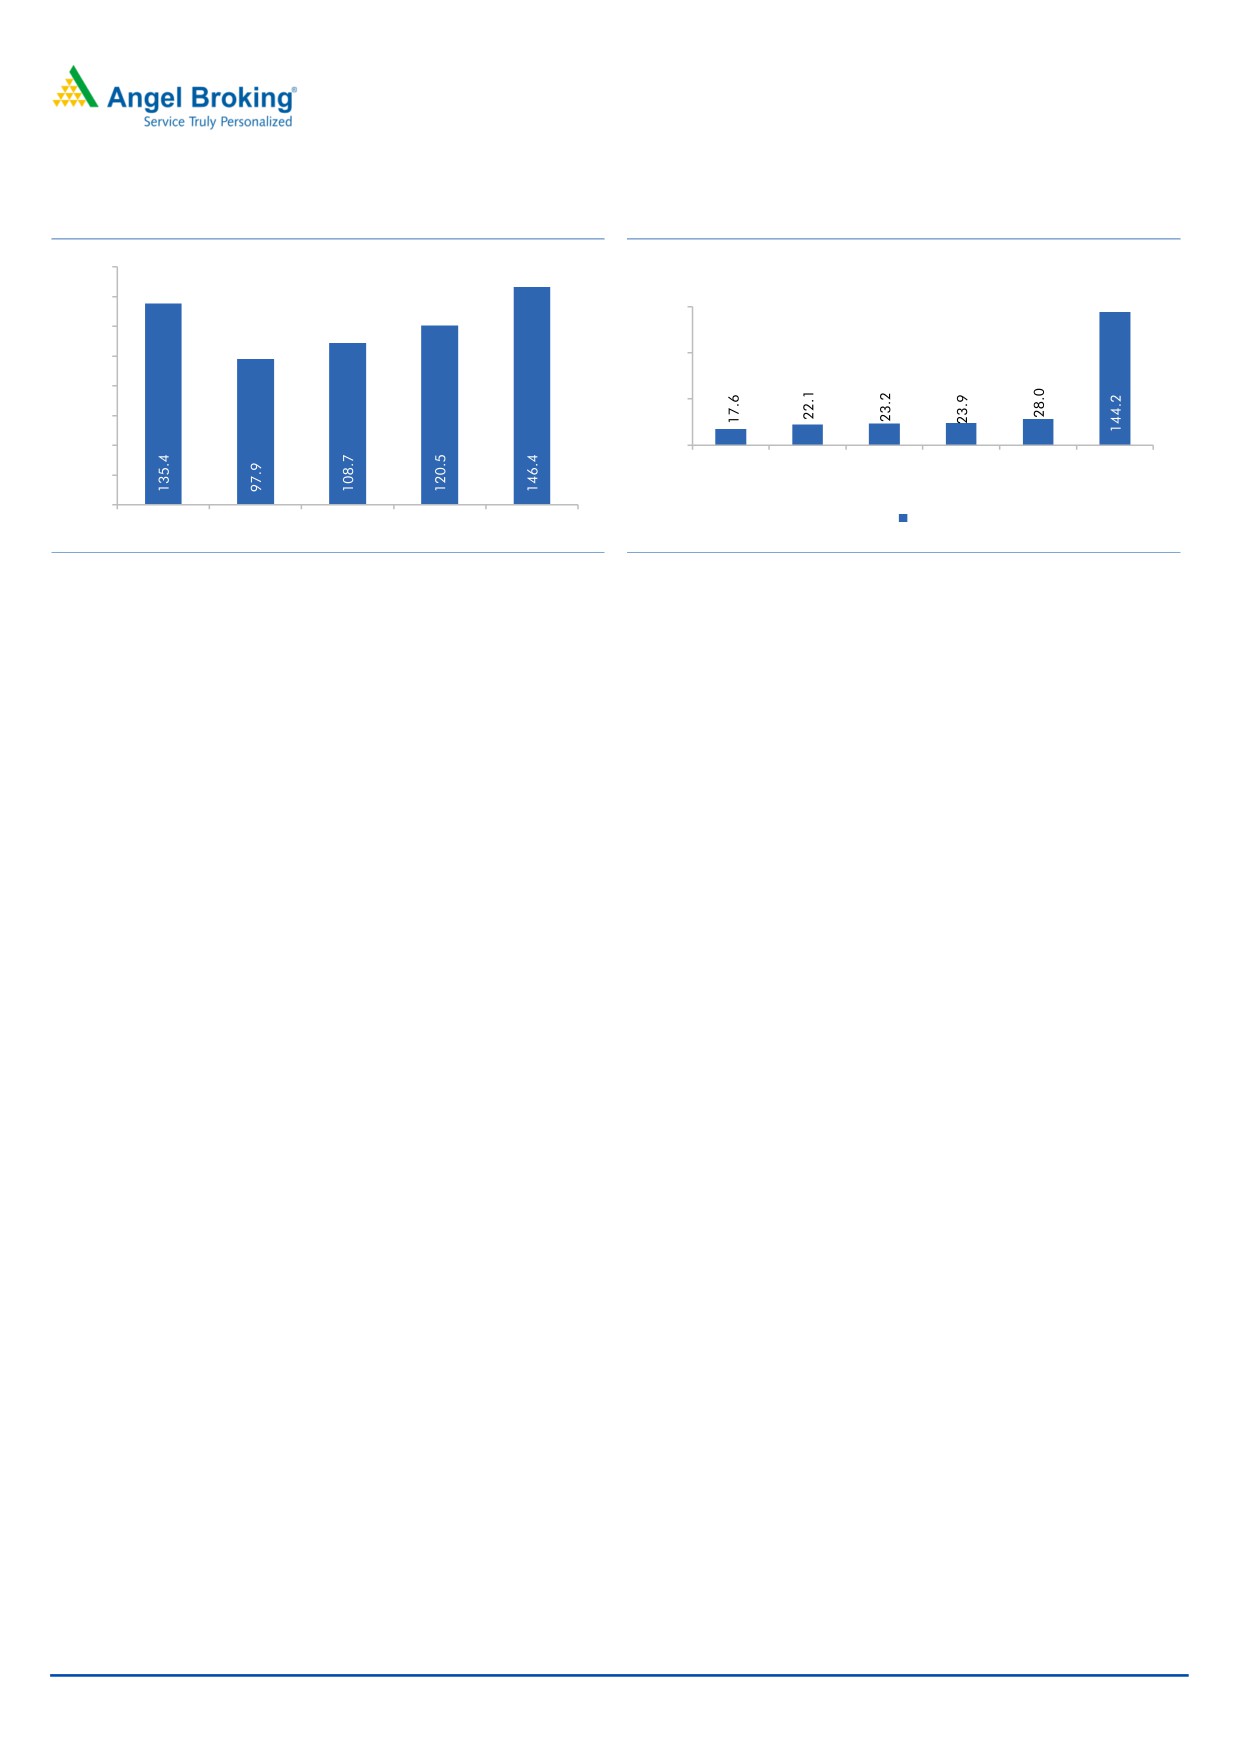
Exhibit 18: Average ~100% ROIC in last five years...
Exhibit 19: ...and leader amongst its peers
160.0
140.0
150.0
120.0
100.0
100.0
80.0
50.0
60.0
40.0
0.0
Pfizer
Alkem
Abbott
Sanofi
GSK
Eris
20.0
India
pharma
0.0
FY13
FY14
FY15
FY16
FY17
Source: Company, Angel Research
Source: Company, Angel Research
Overall we believe that this is a high RoE business and with its major thrust to third
party manufacturing, and consolidating its position in the existing therapeutic
segments, we expect Eris to maintain the same in the near future.
Outlook and Valuation:
On FY2017 EPS of `17.6, the issue is priced at P/E of 34.25x, which is at par with
its MNC peers but higher than domestic peer, Alkem Labs. Considering that Eris’
faster growth, superior returns, debt free status, and specialty play, we believe that
this is a fair valuation. We believe that Eris is likely to continue growing faster than
its competitors owing to its marketing capability, higher operating leverage and
growing market share of its mother brands. While most pharma companies are
currently facing issues on several fronts, this business model looks attractive with
no USFDA concerns and pricing pressure. Considering the company’s superior
growth, better margin profile and high return ratios, we rate this IPO as
SUBSCRIBE.
Downside risks
High dependence on few suppliers and single manufacturing facility in Assam
Change in domestic regulations adverse to the branded generic companies
Increased competition in the chronic segments
June 14, 2017
9
Eris Lifesciences| IPO Note
Income Statement
Y/E March (Rs cr)
FY13
FY14
FY15
FY16
FY17
Total operating income
393
509
546
597
725
% chg
29.5
7.2
9.4
21.4
Total Expenditure
307
410
424
425
456
Cost of Materials
74
99
94
98
104
Personnel
67
91
126
125
132
Others Expenses
166
221
204
203
220
EBITDA
86
99
121
172
269
% chg
15.2
22.8
41.2
56.6
(% of Net Sales)
21.9
19.4
22.3
28.7
37.1
Depreciation& Amortisation
3
5
16
20
24
EBIT
82
94
106
151
245
% chg
14.3
12.5
42.7
62.0
(% of Net Sales)
21.0
18.5
19.4
25.3
33.8
Interest & other Charges
1
0
0
0
0
Other Income
1
4
3
3
19
(% of PBT)
1.7
4.5
3.2
2.2
7.2
Share in profit of Associates
-
-
-
-
-
Recurring PBT
83
98
109
154
264
% chg
18.3
11.3
41.2
70.8
Prior Period & Extraordinary Expense/(Inc.)
-
-
-
-
-
PBT (reported)
83
98
109
154
264
Tax
25
28
20
20
22
(% of PBT)
29.7
28.3
18.4
12.7
8.3
PAT (reported)
58.4
70.5
89.3
134.9
241.9
Add: Share of earnings of associate
-
-
-
-
-
Less: Minority interest (MI)
0
0
0
1
(0)
PAT after MI (reported)
58
70
89
134
242
ADJ. PAT
58.2
70.4
89.2
133.6
242.1
% chg
21.0
26.7
49.7
81.2
(% of Net Sales)
14.8
13.8
16.4
22.4
33.4
Basic EPS (Rs)
4.2
5.1
6.5
9.7
17.6
Fully Diluted EPS (Rs)
4.2
5.1
6.5
9.7
17.6
% chg
21.0
26.7
49.7
81.2
June 14, 2017
10
Eris Lifesciences| IPO Note
Balance Sheet
Y/E March (` cr)
FY13
FY14
FY15
FY16
FY17
SOURCES OF FUNDS
Equity Share Capital
0.1
0.1
0.1
0.1
13.8
Reserves& Surplus
106
176
266
299
526
Shareholder's Funds
106
177
266
299
540
Minority Interest
5
4
4
3
-
Total Loans
10
15
8
27
14
Deferred Tax Liability
-
-
-
-
-
Other long-term liabilities
2
1
1
2
4
Total Liabilities
122
197
279
332
558
APPLICATION OF FUNDS
Net Block
24
71
67
71
55
Capital Work-in-Progress
-
-
-
-
0
Intangibles
3
4
4
1
116
Investments
47
84
167
190
269
Other long-term assets
18
23
21
35
66
Current Assets
80
89
94
95
126
Inventories
43
45
58
48
56
Sundry Debtors
17
22
24
25
49
Cash
5
7
6
10
2
Loans & Advances
15
14
7
12
11
Other Assets
-
-
0
0
8
Current liabilities
50
74
78
66
83
Net Current Assets
30
15
16
29
43
Deferred Tax Asset
0
0
3
6
10
Mis. Exp. not written off
Total Assets
122
197
279
332
558
June 14, 2017
11
Eris Lifesciences| IPO Note
Cash Flow Statement
Y/E March (` cr)
FY13
FY14
FY15
FY16
FY17
Profit before tax
83
98
109
154
264
Depreciation
3
5
16
20
24
Change in Working Capital
(16)
21
(8)
(8)
(16)
Interest / Dividend (Net)
0
0
0
-
-
Direct taxes paid
(36)
(30)
(23)
(35)
(53)
Others
3
(4)
(3)
(0)
(18)
Cash Flow from Operations
38
90
90
131
200
(Inc.)/ Dec. in Fixed Assets
(8)
(52)
(13)
(24)
(50)
(Inc.)/ Dec. in Investments
(28)
(31)
(79)
(20)
(134)
Cash Flow from Investing
(36)
(83)
(92)
(44)
(184)
Issue of Equity
-
-
-
-
-
Inc./(Dec.) in loans
(2)
(2)
0
(1)
(7)
Finance costs
(1)
(0)
(0)
(0)
(0)
Others
-
-
-
(83)
(17)
Cash Flow from Financing
(3)
(2)
0
(84)
(24)
Inc./(Dec.) in Cash
(1)
5
(2)
4
(8)
Opening Cash balances
3
2
7
5
9
Closing Cash balances
2
7
5
9
2
June 14, 2017
12
Eris Lifesciences| IPO Note
Key Ratios
Y/E March
FY13
FY14
FY15
FY16
FY17
Valuation Ratio (x)
P/E (on FDEPS)
142.5
117.7
92.9
62.1
34.3
P/CEPS
133.9
110.1
79.1
53.4
31.2
P/BV
78.2
47.0
31.2
27.7
15.4
Dividend yield (%)
0.0
0.0
0.0
1.0
0.2
EV/Sales
21.0
16.1
14.9
13.6
11.1
EV/EBITDA
96.0
83.0
66.9
47.3
29.9
EV / Total Assets
48.02
30.36
22.75
20.43
12.53
Per Share Data (Rs)
EPS (Basic)
4.2
5.1
6.5
9.7
17.6
EPS (fully diluted)
4.2
5.1
6.5
9.7
17.6
Cash EPS
4.5
5.5
7.6
11.3
19.3
DPS
0.0
0.0
0.0
6.0
1.2
Book Value
7.7
12.8
19.3
21.8
39.3
Returns (%)
ROCE
71.3
49.2
38.7
46.4
44.2
Angel ROIC (Pre-tax)
135.4
97.9
108.7
120.5
146.4
ROE
54.9
39.9
33.6
44.6
44.8
Turnover ratios (x)
Asset Turnover (Net Block)
16.7
7.2
8.1
8.4
13.1
Inventory / Sales (days)
40
32
39
29
28
Receivables (days)
15
16
16
16
25
Payables (days)
20
27
25
15
19
Working capital cycle (ex-cash) (days)
35
21
30
30
33
June 14, 2017
13
Eris Lifesciences| IPO Note
Research Team Tel: 022 - 39357800
DISCLAIMER
Angel Broking Private Limited (hereinafter referred to as “Angel”) is a registered Member of National Stock Exchange of India Limited,
Bombay Stock Exchange Limited and Metropolitan Stock Exchange Limited. It is also registered as a Depository Participant with CDSL
and Portfolio Manager with SEBI. It also has registration with AMFI as a Mutual Fund Distributor. Angel Broking Private Limited is a
registered entity with SEBI for Research Analyst in terms of SEBI (Research Analyst) Regulations, 2014 vide registration number
INH000000164. Angel or its associates has not been debarred/ suspended by SEBI or any other regulatory authority for accessing
/dealing in securities Market. Angel or its associates/analyst has not received any compensation / managed or co-managed public
offering of securities of the company covered by Analyst during the past twelve months.
This document is solely for the personal information of the recipient, and must not be singularly used as the basis of any investment
decision. Nothing in this document should be construed as investment or financial advice. Each recipient of this document should
make such investigations as they deem necessary to arrive at an independent evaluation of an investment in the securities of the
companies referred to in this document (including the merits and risks involved), and should consult their own advisors to determine
the merits and risks of such an investment.
Reports based on technical and derivative analysis center on studying charts of a stock's price movement, outstanding positions and
trading volume, as opposed to focusing on a company's fundamentals and, as such, may not match with a report on a company's
fundamentals. Investors are advised to refer the Fundamental and Technical Research Reports available on our website to evaluate the
contrary view, if any.
The information in this document has been printed on the basis of publicly available information, internal data and other reliable
sources believed to be true, but we do not represent that it is accurate or complete and it should not be relied on as such, as this
document is for general guidance only. Angel Broking Pvt. Limited or any of its affiliates/ group companies shall not be in any way
responsible for any loss or damage that may arise to any person from any inadvertent error in the information contained in this report.
Angel Broking Pvt. Limited has not independently verified all the information contained within this document. Accordingly, we cannot
testify, nor make any representation or warranty, express or implied, to the accuracy, contents or data contained within this document.
While Angel Broking Pvt. Limited endeavors to update on a reasonable basis the information discussed in this material, there may be
regulatory, compliance, or other reasons that prevent us from doing so.
This document is being supplied to you solely for your information, and its contents, information or data may not be reproduced,
redistributed or passed on, directly or indirectly.
Neither Angel Broking Pvt. Limited, nor its directors, employees or affiliates shall be liable for any loss or damage that may arise from
or in connection with the use of this information.
June 14, 2017
14