Angel Top Picks - September 2019
Top Picks
FPI outflows continue unabated for the second month in a row - The Government
Company
CMP (`)
TP (`)
in the Union Budget proposed to increase surcharge on Individuals and trusts
Banking/NBFC
earning more than `2 cr. and `5 cr. Though the Government has rolled back the
ICICI Bank
410
490
surcharge on equity investments FII selling continued unabated in August also as
HDFC Bank
2229
2620
they pulled out `17,592 cr. during the month after pulling out `12,419 cr. in
RBL Bank
327
540
Jul’19. FII flows for calendar year 2019 now stands at `47,311 cr.
Shriram Transport Finance
966
1385
Rate cut, dividend and one time surplus transfer by RBI to help revive Government
Consumption
spending - The RBI announced a 35bps rate cut in it’s monetary policy meet on
Amber Enterprises
825
910
the 7th of Aug’19 and maintained it’s accommodative stance which indicates more
Blue Star
721
1061
rate cuts during the year. The RBI also accepted the recommendations of the Bimal
Safari Industries
560
646
Jalan committee report and announced a dividend of `1.23lakh cr along with a
TTK Prestige
5740
6638
one-time surplus transfer of `52,640 cr. to the Government. Adjusting for the
Media/Automobiles
interim dividend already paid to the Government in March the RBI has transferred
Maruti Suzuki
6,122
7783
a total of `1.48 lakh cr. to the Government against a budgeted `90,000 cr. for
M&M
529
724
FY20. The additional transfer of `58,000 cr. would go a long way in boosting
Real Estate/Infra/Logistics/Power
Government spending which had been lacking for the past two quarters.
GMM Pfaudler
1,479
1,570
Q1FY20 GDP number of 5.0% probably the bottom in terms of growth rate - Rate
Jindal Steel
97
250
cuts and large transfer by the RBI, Improving monsoon situation along with relief
KEI Industries
471
556
for FPI’s from additional surcharge should help in reversing sentiments going
Pharmaceutical
forward. The Q1FY20 GDP growth number at 5.0% probably marks the bottom in
Aurobindo Laboratories
601
890
terms of growth rate. Hence we believe that the worst is over and growth rates
Source: Angel Research;
should start improving from Q2 onwards driven by Government spending while
Note: CMP as of August 30, 2019
private spending is expected to pick up from the second half of FY20.
Escalating US-China trade war is key risk going forward - The trade war between
US and China escalated further with the US President proposing tariffs on
additional Chinese goods worth USD 300bn which would be implemented in two
steps. In the first round the US imposed tariffs of 15% on goods worth UD 112bn
from the 1st of Sep’19. Tariffs on the balance USD 188bn worth of goods will be
imposed from the 15th of Dec’19. Furthermore, tariffs are to be raised from 25% to
30% on the existing USD 250 billion worth of Chinese goods from the 1st of
Oct’19. Post the recent round of escalation in the US China trade war the US yield
curve has inverted with the US 10 year G-Sec currently trading below 1.6% as
compared to the Fed target rate of 2.0-2.25%. The inversion of the yield curve has
raised concerns about possible slowdown in the US economy down the line.
Top pick’s overview
We recommend our top picks as it has outperformed the benchmark BSE 100
since inception. We believe that consumer (both discretionary and non
discretionary) space and private sector banks (both corporate and retail) offers
good growth opportunity going forward despite volatile market environment.
Exhibit 1: Top Picks Performance
Return Since Inception (30th Oct, 2015)
Top Picks Return
37.0%
BSE 100
36.0%
Outperformance
1.0%
Source: Company, Angel Research
Please refer to important disclosures at the end of this report
1
Angel Top Picks | September 2019
Top Picks
September 7, 2019
2
Angel Top Picks | September 2019
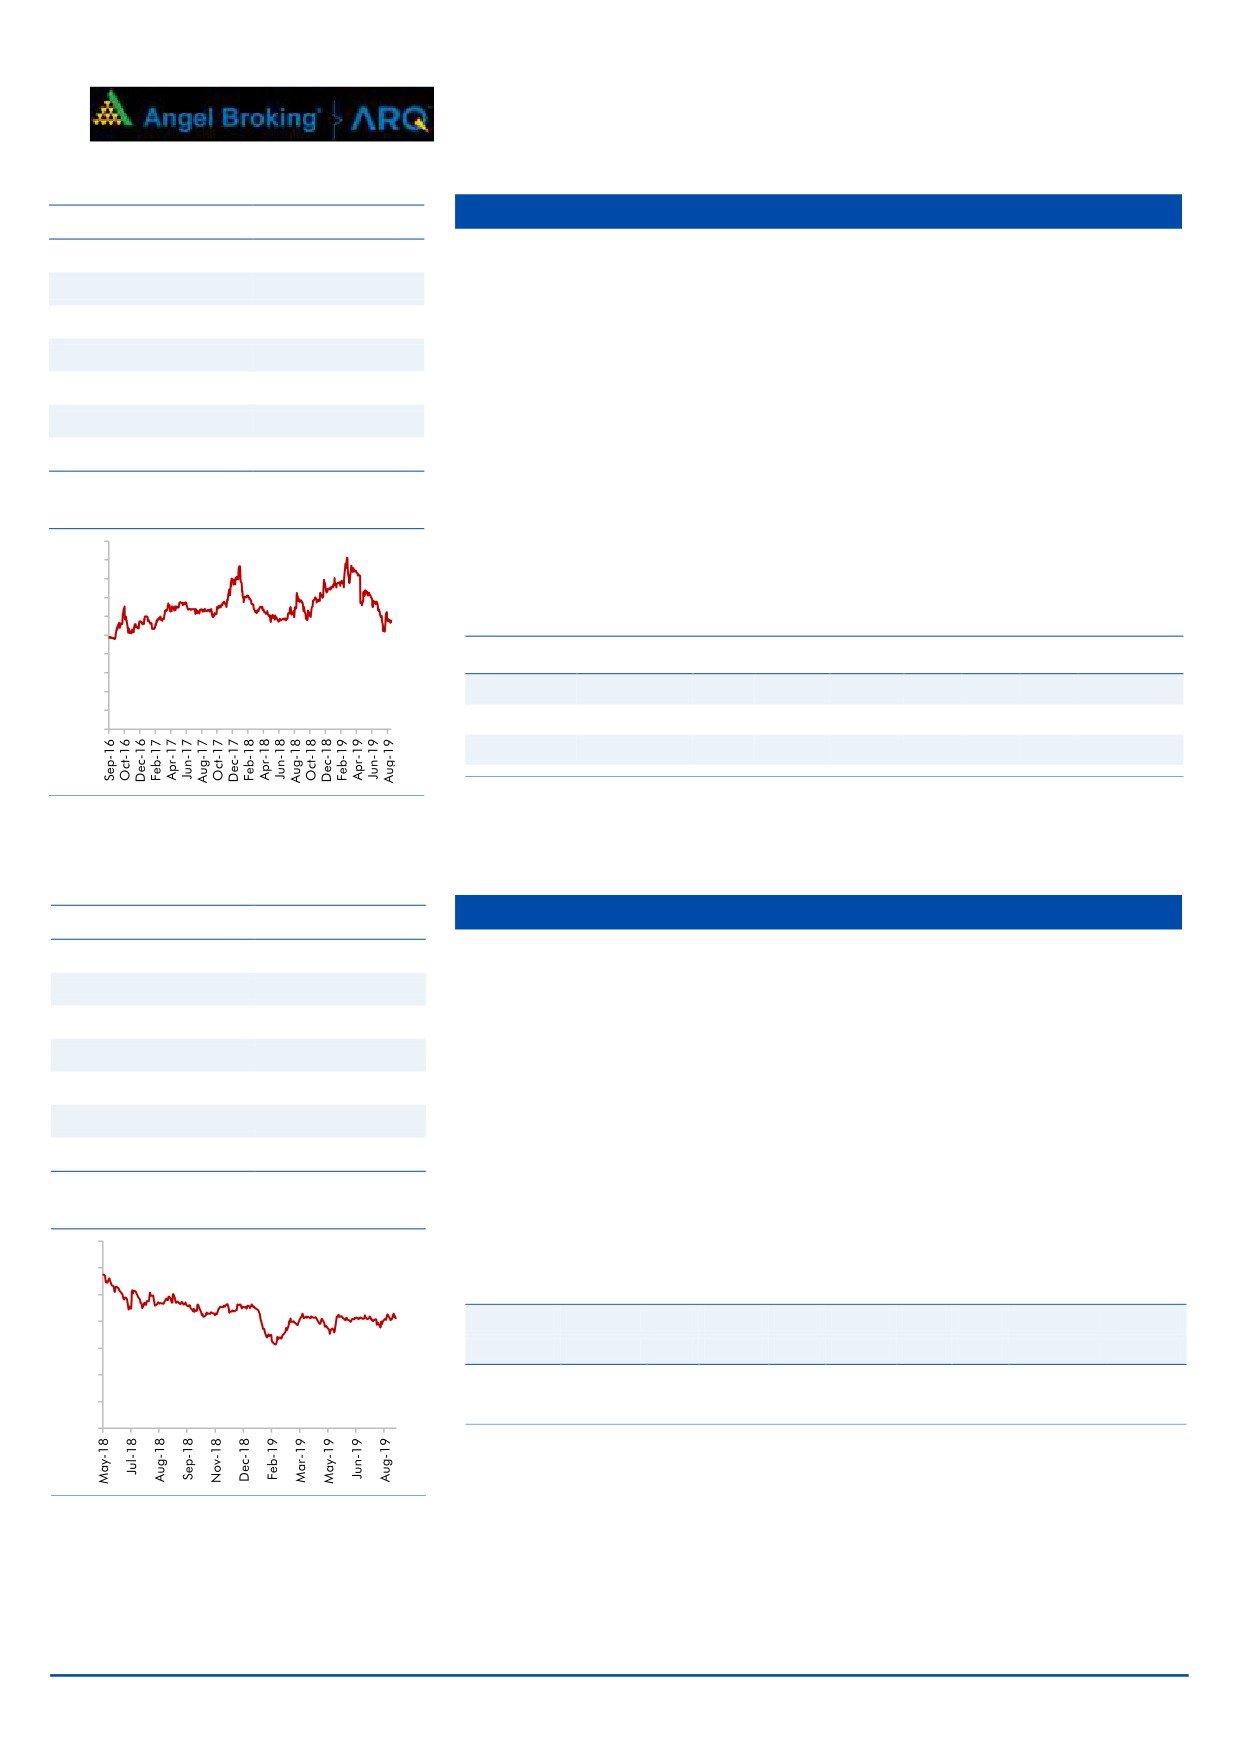
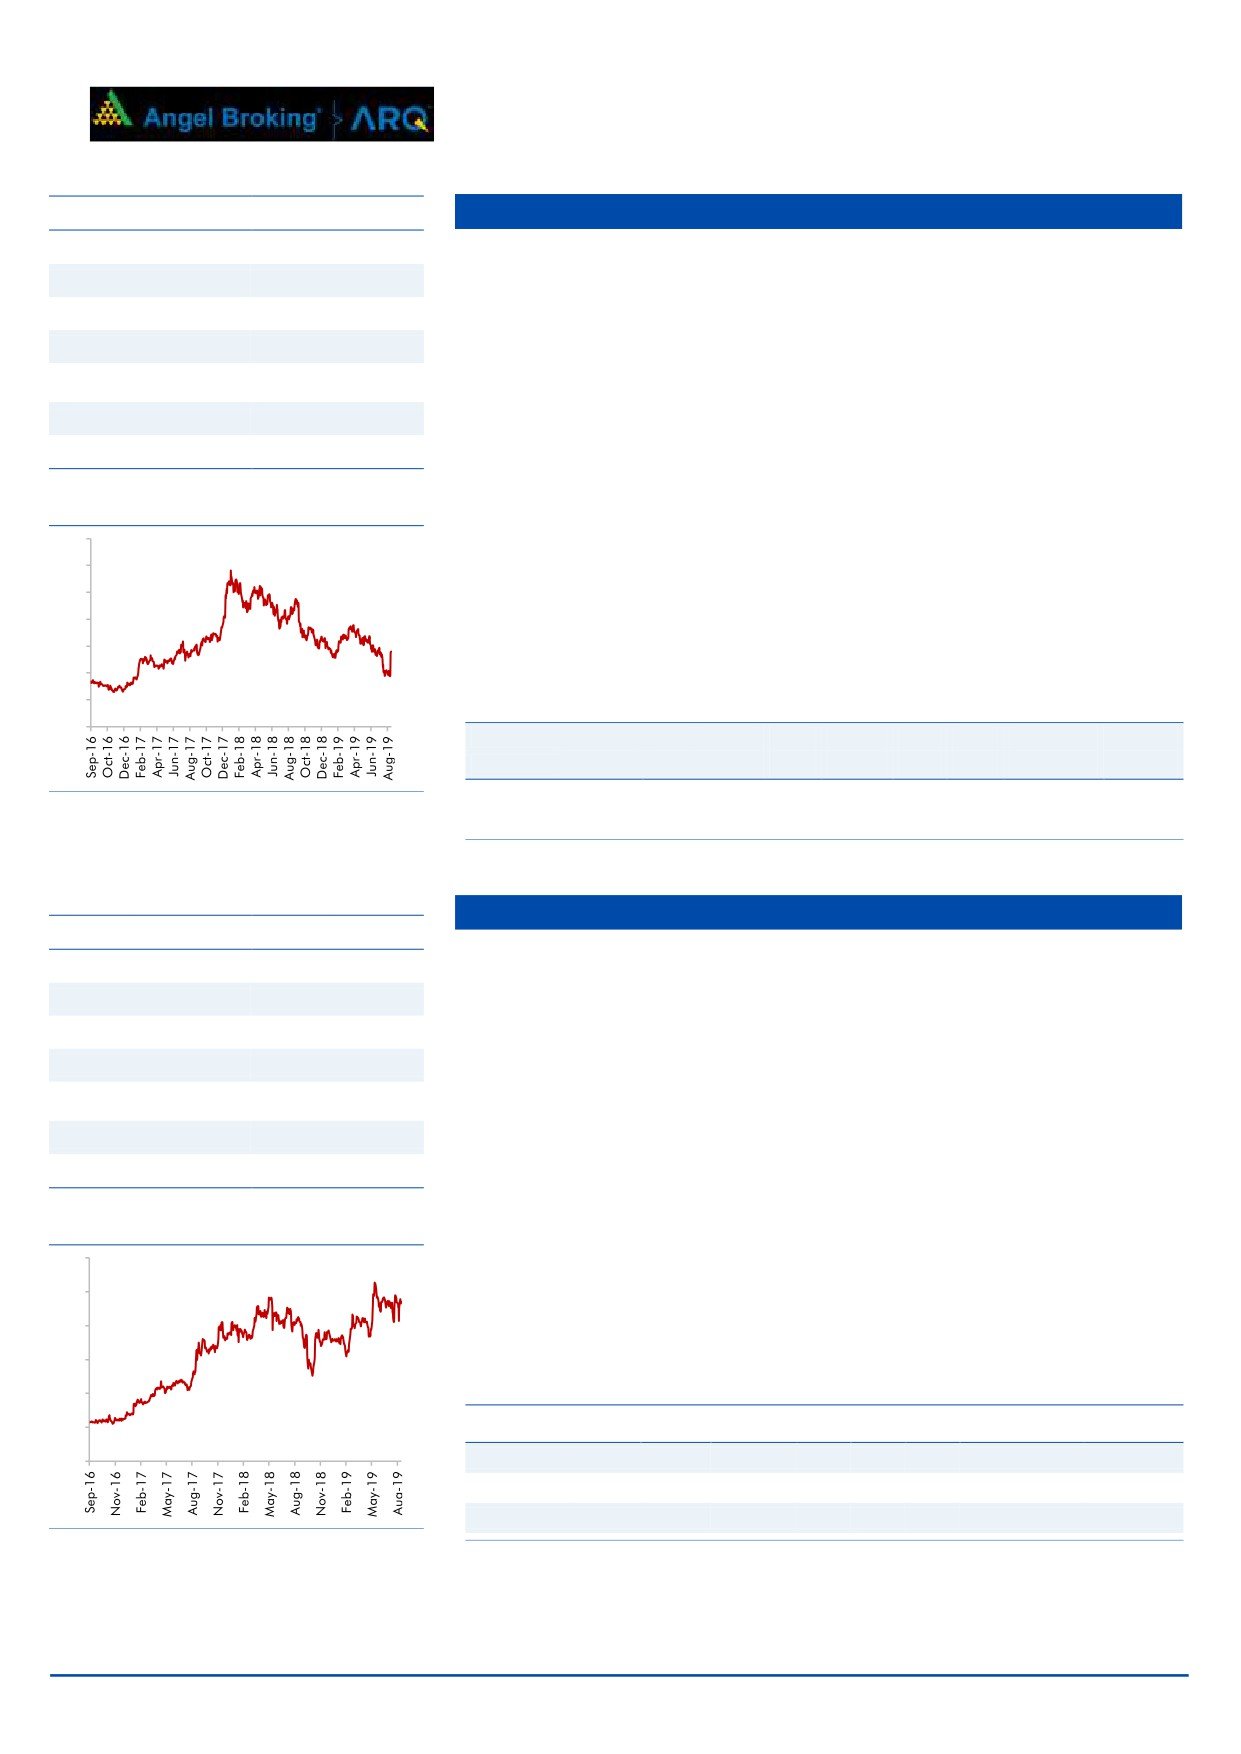
TTK Prestige
Stock Info
CMP
5740
TTK Prestige (TTK) is the leading brands in kitchen appliances with 40%+
TP
6638
market share in organized market. It has successfully transformed from a
single product company to a multi product company offering an entire gamut
Upside
15.7%
of kitchen and home appliances (600+ products).
Sector
Houseware
Market Cap (` cr)
7,956
It has also launched an economy range - ‘Judge Cookware’ to capture the
untapped demand especially at the bottom end of the pyramid. It is expecting
Beta
0.44
good growth in cleaning solution.
52 Week High / Low
7742/4584
It expects to double its revenue in the next five years backed by revival in
3 year-Chart
consumption demand, inorganic expansion and traction in exports.
10,000
9,000
8,000
7,000
6,000
Key Financials
5,000
4,000
Y/E
Sales
OPM PAT
EPS
ROE P/E P/BV EV/Sales
3,000
2,000
March
(` cr)
(%)
(` cr)
(`)
(%)
(x)
(x)
(x)
1,000
FY2020E
2,307.4
13.9
210.4
170.2
15.9
37.6
6.1
3.3
-
FY2021E
2,556.8
13.9
234.9
152.7
15.6
33.7
5.4
3
Source: Company, Angel Research
Source: Company, Angel Research
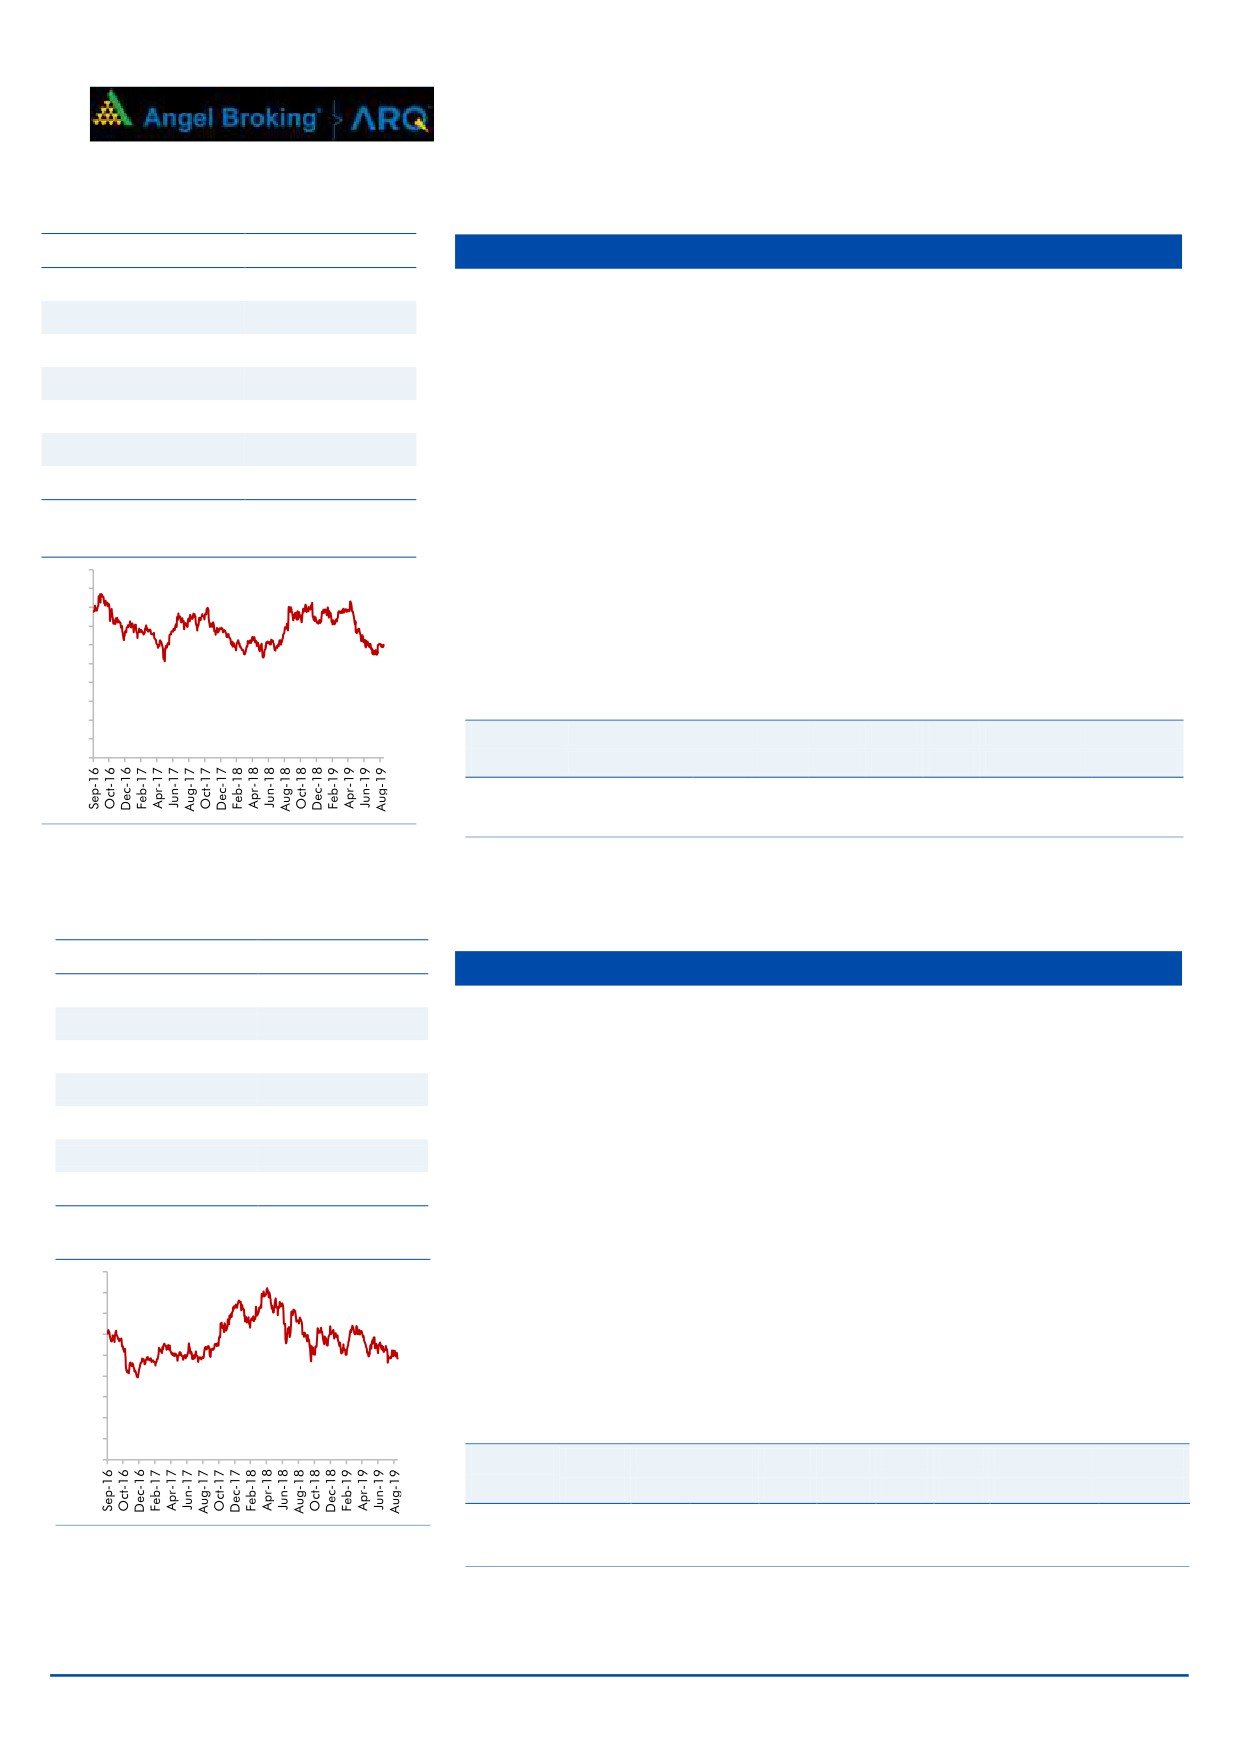
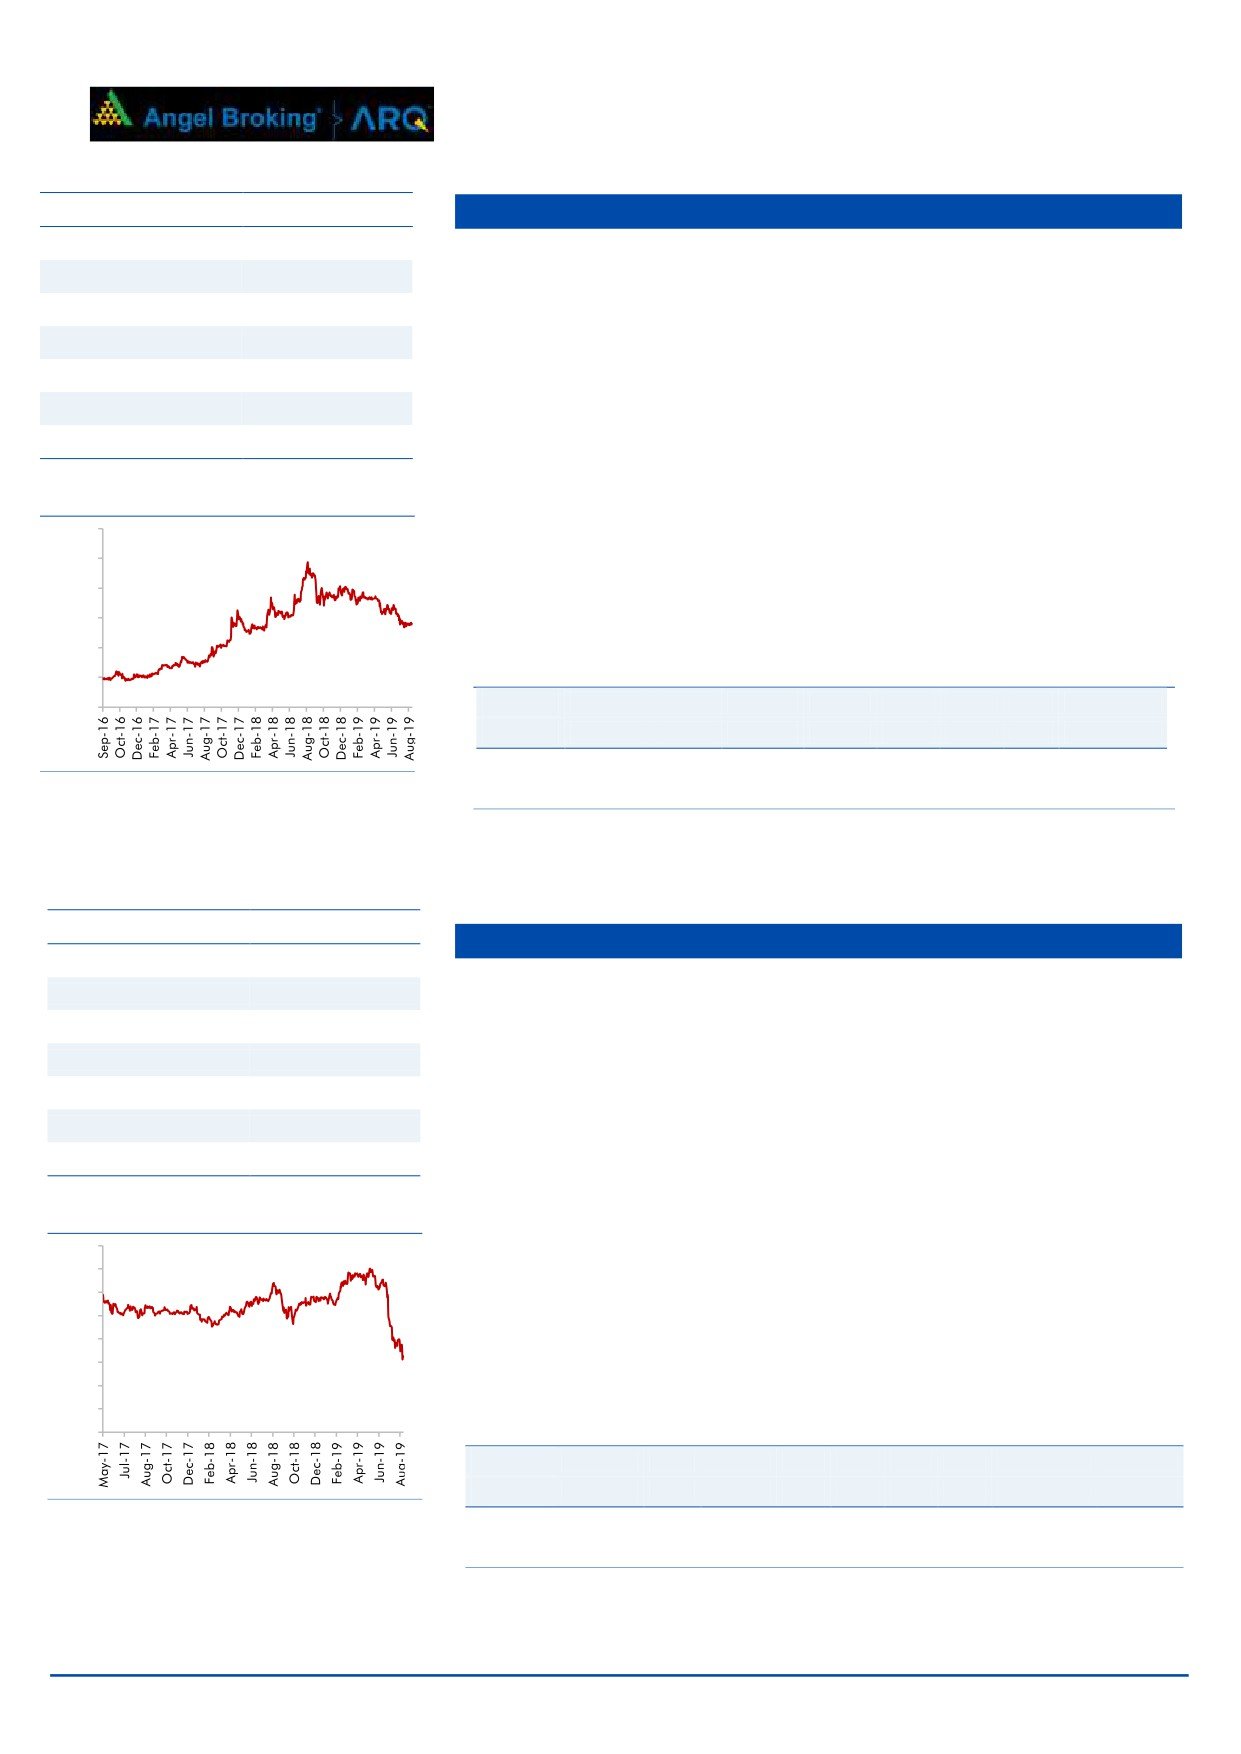
Amber Enterpries
Stock Info
CMP
Amber Enterprises India Ltd. (Amber) is the market leader in the room air
825
TP
910
conditioners (RAC) outsourced manufacturing space in India. It is a one-stop
solutions provider for the major brands in the RAC industry and currently
Upside
10.3%
serves eight out of the ten top RAC brands in India.
Sector
Electronics
In line with its strategy to capture more wallet share, it has made 2 acquisitions
Market Cap (` cr)
2,593
in the printed circuit board (PCB) manufacturing space over the last 1 year
Beta
0.88
which will boost its manufacturing capabilities.
52 Week High / Low
1121/622
We expect Amber to report consolidated revenue/PAT CAGR of 20%/27%
respectively over FY2019-21E. Its growing manufacturing capabilities and
1 year-Chart
scale put it in a sweet spot to capture the underpenetrated RAC market in
1,400
India.
1,200
1,000
Key Financials
800
Y/E
Sales
OPM
PAT
EPS
ROE
P/E
P/BV
EV/EBITDA
EV/Sales
600
March
(` cr)
(%)
(` cr)
(`)
(%)
(x)
(x)
(x)
(x)
400
FY2019
3,433.7
8.5
123.2 39.2
11.3
21.1
2.4
9.4
0.8
200
FY2020E
3,988.0
8.6
151.6 48.2
12.5
17.1
2.1
7.8
0.7
-
Source: Company, Angel Research
Source: Company, Angel Research
September 7, 2019
3
Angel Top Picks | September 2019
Stock Info
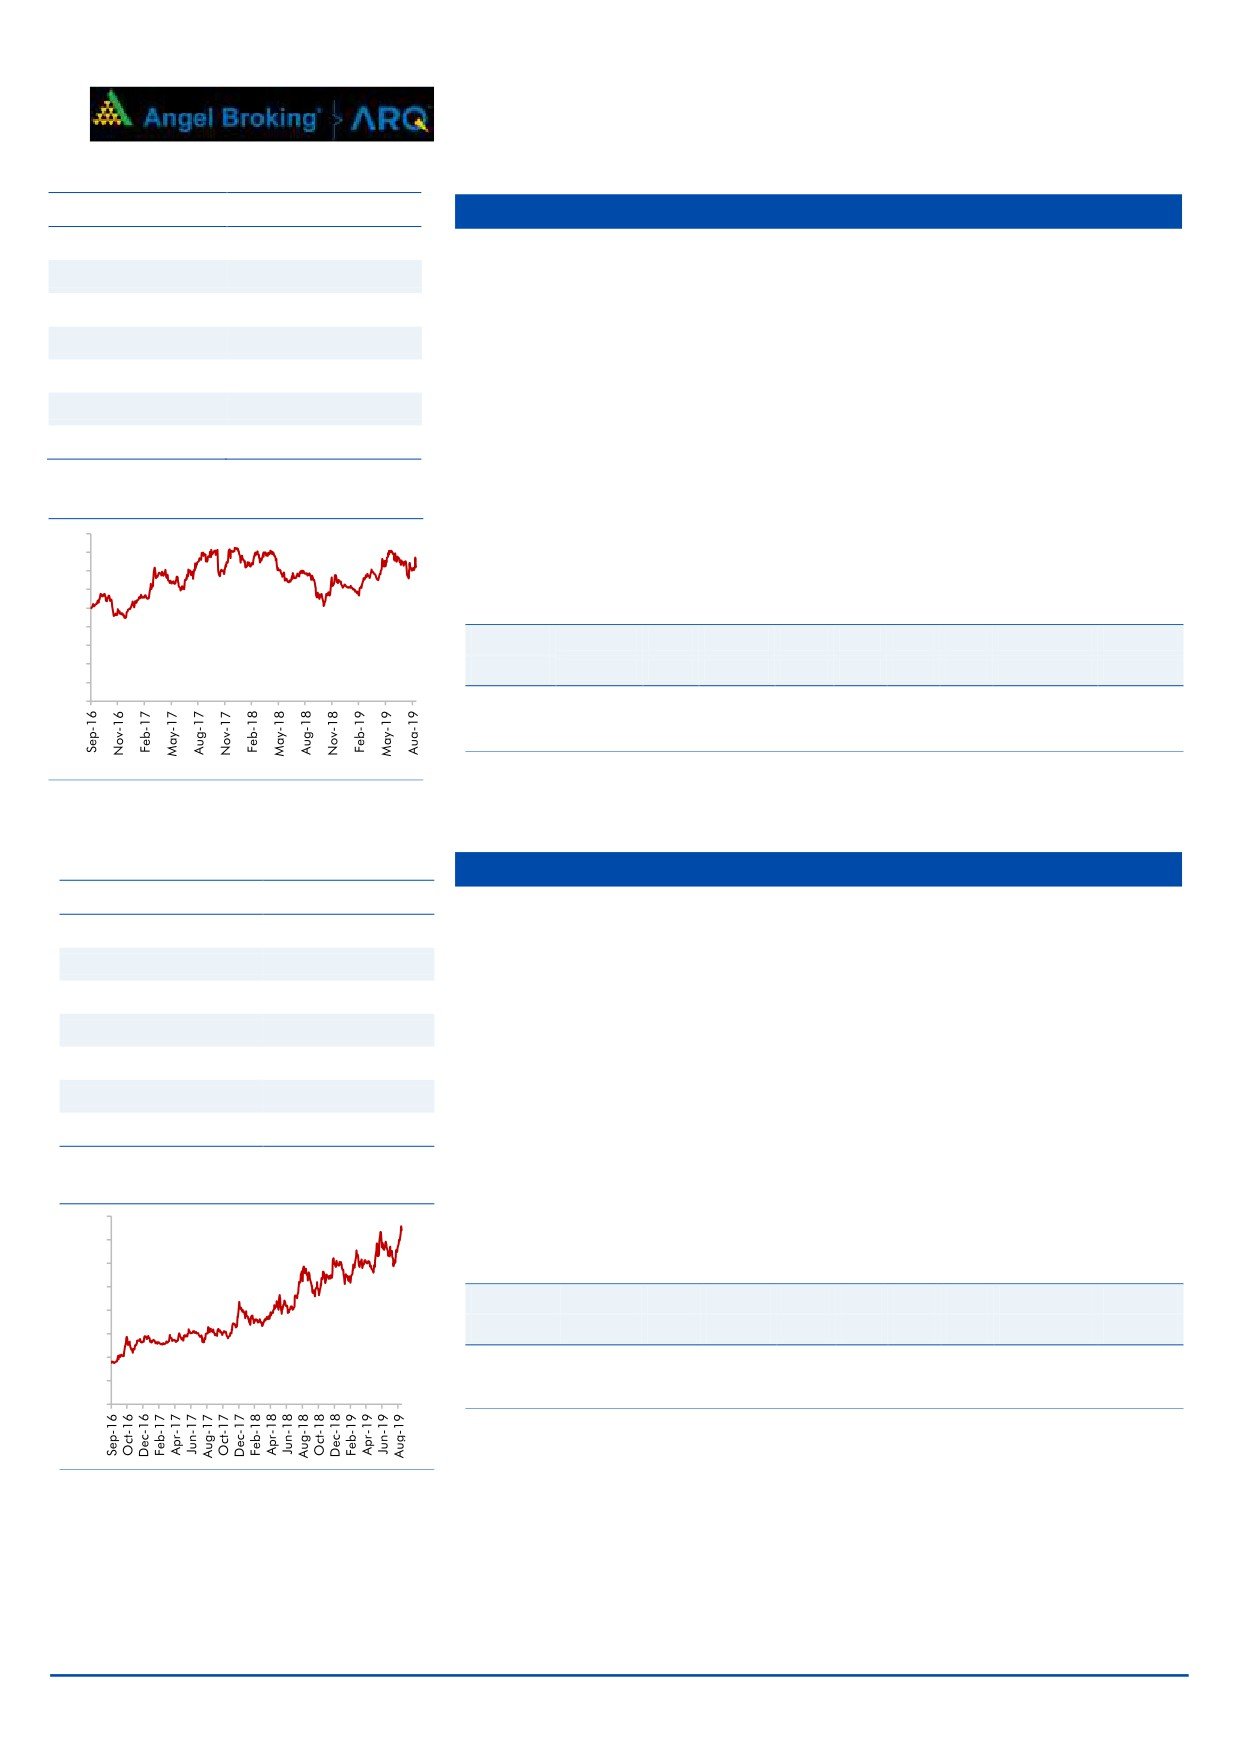
Aurobindo Pharma
CMP
601
Aurobindo Pharmaceuticals is an India-based leading global generic
TP
890
company. It’s predominately formulations Export Company, with USA &
Upside
48.2%
Europe contributing ~80% of sales (FY2018).
Sector
Pharmaceuticals
Recently it acquired dermatology and oral solids businesses from Sandoz Inc.,
USA. With this acquisition, Aurobindo adds sales of US$0.9bn and would
Market Cap (` cr)
35,197
become the 2nd largest generic player in the US by number of prescriptions.
Beta
0.88
52 Week High / Low
838/537
Aurobindo has a robust pipeline (has filed 519 ANDA’s; second highest
amongst Indian companies) & is investing to enhance its foray into complex
3 year-Chart
generic (mainly injectables, ophthalmic etc.) & biosimilar, which will drive its
1,000
next leg of growth.
900
800
We expect Aurobindo to report net revenue CAGR of ~22% & net profit to
700
600
grow at ~19% CAGR during FY2018-20E, aided by acquisitions. Valuations of
500
the company are cheap V/s its peers and own fair multiples of 17-18x.
400
300
Key Financials
200
100
Y/E
Sales
OPM
PAT
EPS
ROE
P/E
P/BV
EV/EBITDA
EV/Sales
-
March
(` cr)
(%)
(` cr)
(`)
(%)
(x)
(x)
(x)
(x)
FY2019
18,799
19.6
2,575
44.0
20.1
13.7
2.5
10.3
2.0
FY2020E
24,234
21.9
3,438
58.7
22.2
10.2
2.1
7.0
1.5
Source: Company, Angel Research
Source: Company, Angel Research
Stock Info
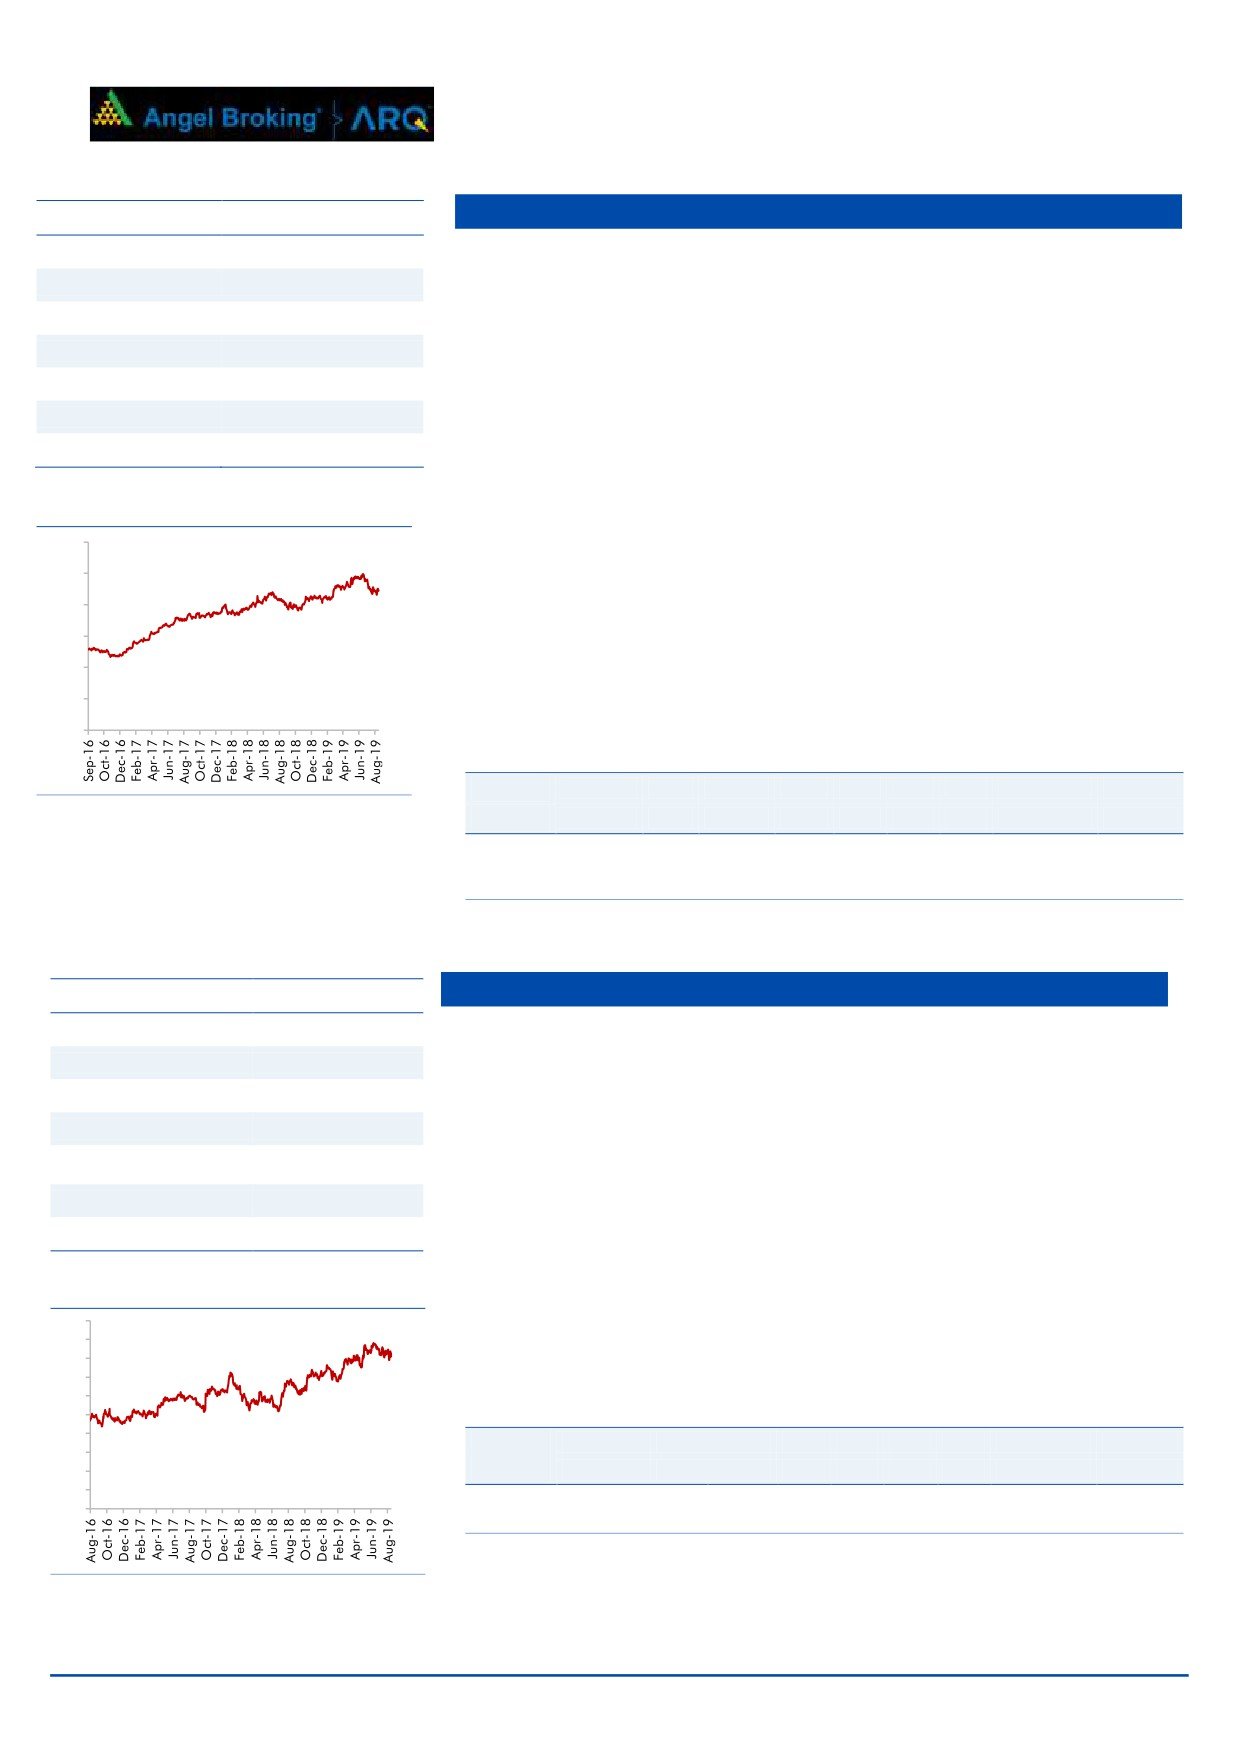
Shriram Transport Finance
CMP
966
SHTF's primary focus is on financing pre-owned commercial vehicles. We
TP
1385
expect AUM to grow at CAGR of 13% over FY2019-21E led by pick up in
Upside
43.3%
infra/ construction Post 2019 elections, macro revival and Ramping up in rural
Sector
Financials
distribution.
Market Cap (` cr)
21,921
Beta
1.43
In last three year SHTF, GNPA and credit cost has been increased primarily
due to the transition of NPA recognition from 180DPD to 90DPD (Q4FY18).
52 Week High / Low
1367/904
Q1FY19 onwards asset quality started witnessing steady improvement, and we
expect this trend to continue.
3 year-Chart
1,800
We expect STFC to report RoA/RoE to 2.7%/17.6% in FY2021E respectively. At
1,600
1,400
CMP, the stock is trading at 1.2x FY2021E ABV and 6x FY2021E EPS, which
1,200
we believe is reasonable for differentiated business model with return ratios.
1,000
800
600
400
Key Financials
200
-
Y/E
NII
NIM
PAT
EPS
ABV
ROA
ROE
P/E
P/ABV
March
(` cr)
(%)
(` cr)
(`)
(`)
(%)
(%)
(x)
(x)
FY2020E
8,681
8.1
2,868
126
812
2.6
16.7
7.7
1.4
Source: Company, Angel Research
FY2021E
9,946
8.3
3,405
150
946
2.7
17.1
6.5
1.2
Source: Company, Angel Research
September 7, 2019
4
Angel Top Picks | September 2019
Stock Info
Blue Star
CMP
721
BSL is one of the largest air-conditioning companies in India. With a mere 3%
TP
1061
penetration level of ACs vs 25% in China, the overall outlook for the room air-
Upside
47.2%
conditioner (RAC) market in India is favorable.
Sector
Cons.Durable
BSL's RAC business has been outgrowing the industry by ~10% points over the
Market Cap (` cr)
6,942
last few quarters, resulting in the company consistently increasing its market
share. This has resulted in the Cooling Products Division (CPD)'s share in
Beta
0.72
overall revenues increasing from~23% in FY2010 to ~43% in FY2019
52 Week High / Low
825/508
(expected to improve further). With strong brand equity and higher share in
split ACs, we expect the CPD to continue to drive growth.
3 year-Chart
Going Aided by increasing contribution from the Unitary Products, we expect
900
the overall top-line to post revenue CAGR of ~11% over FY2019-21E and
800
700
margins to improve from 5.7% in FY2018 to 6.8% in FY2021E.
600
500
Key Financials
400
300
Y/E
Sales
OPM
PAT
EPS
ROE
P/E
P/BV
EV/EBITDA
EV/Sales
200
March
(` cr)
(%)
(` cr)
(`)
(%)
(x)
(x)
(x)
(x)
100
-
FY2020E
5,711
6.5
207
21.5
22.3
33.5
7.5
19.0
1.2
FY2021E
6,397
6.8
245
25.5
23.9
28.3
6.7
16.2
1.1
Source: Company, Angel Research
Source: Company, Angel Research
GMM Pfaudler Ltd.
Stock Info
GMM Pfaudler Limited (GMM) is the Indian market leader in glass-lined (GL)
CMP
1479
steel equipment used in corrosive chemical processes of agrochemicals,
TP
1570
specialty chemical and pharma sector. The company is seeing strong order
Upside
6.2%
inflow from the user industries which is likely to provide 20%+ growth outlook
for next couple of years.
Sector
Machinery
Market Cap (` cr)
2,161
GMM has also increased focus on the non-GL business, which includes mixing
Beta
0.76
equipment, filtration and drying equipment for the chemical processing
industry. It is expecting to increase its share of non-GL business to 50% by
52 Week High / Low
1523/878
2020.
3 year-Chart
GMM is likely to maintain the 20%+ growth trajectory over FY19-21 backed
1,600
by capacity expansion and cross selling of non-GL products to its clients.
1,400
1,200
Key Financials
1,000
Y/E
Sales
OPM
PAT
EPS
ROE
P/E
P/BV
EV/EBITDA
EV/Sales
800
600
March
(` cr)
(%)
(` cr)
(`)
(%)
(x)
(x)
(x)
(x)
400
FY2020E
665
17.5
77.2
52.9
22.2
28.0
6.2
17.3
3.0
200
FY2021E
767
17.5
98.9
67.8
22.9
21.8
5.0
14.6
2.6
-
Source: Company, Angel Research
Source: Company, Angel Research
September 7, 2019
5
Angel Top Picks | September 2019
HDFC Bank
Stock Info
CMP
2229
Bank has planned to improve business with digital platform and engaging with
TP
2620
mid market client. Banks next leg of growth road map 1) increasing branch
Upside
17.5%
opening number from 300 current to 600 annually in non urban area. 2)
Increase point of sale (POS) 4x to 4mn by FY21 and double the virtual
Sector
Banking
relationship manager client in 3 years.
Market Cap (` cr)
6,09,441
Asset Strong and steady NIM of 4.4% on the back of lower cost of funds and
Beta
0.83
lower credit cost will ensure healthy return ratios for the company. Despite
52 Week High / Low
2503/1885
strong growth, the company has maintained stable asset quality (GNPA/NPA -
1.3%/0.4%).
3 year-Chart
HDFC bank’s subsidiaries, HDB Financial Services (HDBFS) and HDFC
3,000
Securities continue to contribute well to the banks overall growth. Strong loan
2,500
book, well-planned product line and clear customer segmentation aided this
2,000
growth.
1,500
We expect the company’s loan growth to remain 20% over next two years and
1,000
earnings growth is likely to be more than 20%.
500
-
Key Financials
Y/E
NII
NIM
PAT
EPS
ABV
ROA
ROE
P/E
P/ABV
Source: Company, Angel Research
March
(` cr)
(%)
(` cr)
(`)
(`)
(%)
(%)
(x)
(x)
FY2020E
57,795
4.4
24,915
91
619
1.8
17.1
24.4
3.6
FY2021E
68,500
4.4
30,149
110
711
1.9
16.3
20.2
3.1
Source: Company, Angel Research
ICICI Bank
Stock Info
CMP
410
ICICI bank has taken a slew of steps to strengthen its balance sheet. Measures
TP
490
such as Incremental lending to higher rated corporate, reducing concentration
in few stressed sectors and building up the retail loan book. The share of retail
Upside
19.4%
loans in overall loans increased to 61.4% (Q1FY20) from 38% in FY12.
Sector
Banking
ICICI bank’s slippages remained high during FY18 and hence GNPA went up
Market Cap (` cr)
2,64,975
to 8.8% vs. 5.8% in FY16. We expect addition to stress assets to reduce and
Beta
1.28
credit costs to further decline owing to incremental lending to higher rated
52 Week High / Low
444/295
corporate and faster resolution in Accounts referred to NCLT under IBC.
The gradual improvement in recovery of bad loans would reduce credit costs
3 year-Chart
that would help to improve return ratio. The strength of the liability franchise,
500
shift in loan mix towards retail assets and better rated companies, and
450
400
improvement in bad loans would be a key trigger for multiple expansion.
350
300
250
Key Financials
200
Y/E
Op. Inc
NIM
PAT
EPS
ABV
ROA
ROE
P/E
P/ABV
150
100
March
(` cr)
(%)
(` cr)
(`)
(`)
(%)
(%)
(x)
(x)
50
FY2020E
31,732
3.4
12,250
19
169
1.2
10.8
21.6
2.4
-
FY2021E
37,135
3.5
16,518
26
189
1.4
13.2
16
2.2
Source: Company, Angel Research
Source: Company, Angel Research
September 7, 2019
6
Angel Top Picks | September 2019
Stock Info
Jindal Steel & Power Ltd.
CMP
97
The company has increased its crude steel capacity more than double in last
TP
250
five years from 3.6 MTPA to 8.6 MTPA and currently running at ~65%
Upside
158.8%
utilization.
Owing to continuous demand of steel from infrastructure, housing and auto
Sector
Steel & Power
sectors along with limited addition of steel capacity in near term and favorable
Market Cap (` cr)
9,853
government policies augur well for JSPL to perform well going forward, we
Beta
1.84
expect JSPL’s utilization to improve to 80-85% by FY20 along with reduction in
52 Week High / Low
246/92
debt led by improving in profitability.
From April 2019, power segment has seen improvement in PLF and now
3 year-Chart
producing 1,700 megawatts, up from the average 1,400 megawatts, this will
350
lead improvement in PLF from 34% to 50%.
300
Expect 515MW of PPA from NHPC currently, JPL emerged as L1 bidder.
250
200
JSPL is trading at attractive valuation to its peer, we value the stock based on
150
asset based approach of Steel segment on EV/Tone basis and Power segment
100
on EV/MW basis.
50
Key Financials
-
Y/E
Sales
OPM
PAT
EPS
ROE
P/E
P/BV
EV/EBITDA
EV/Sales
March
(` cr)
(%)
(` cr)
(`)
(%)
(x)
(x)
(x)
(x)
FY2020E
45,561
22.4
2,076
21.4
6.9
4.5
0.3
3.9
0.9
Source: Company, Angel Research
FY2021E
47,450
24.1
3,239
33.5
9.4
2.9
0.3
3.1
0.8
Source: Company, Angel Research
KEI Industries
Stock Info
CMP
KEI’s current order book (OB) stands at `4,414cr (segmental break-up: out
471
which EPC is around `2,210cr and balance from cables, substation & EHV). Its
TP
556
OB grew strongly in the last 3 years due to strong order inflows from State
Upside
18.2%
Electricity Boards, Power grid, etc.
Sector
Cable
KEI’s consistent effort to increase its retail business from 30-32% of revenue in
Market Cap (` cr)
3,713
FY18 to 40-45% of revenue in the next 2-3 years on the back of strengthening
Beta
1.29
distribution network (currently 926 which is expect to increase ~1,500 by
52 Week High / Low
533/249
FY20) and higher ad spend.
KEI’s export (FY19 - 16% of revenue) is expected to reach a level 20% in next
3 year-Chart
two years with higher order execution from current OB and participation in
600
various international tenders. We expect KEI to report net revenue CAGR of
500
~15% to ~`5,632cr and net profit CAGR of ~22% to `269cr over FY2019-
400
21E.
300
200
Key Financials
100
Y/E
Sales
OPM
PAT
EPS ROE P/E
EV/EBITDA
EV/Sales
-
March
(` cr)
(%)
(` cr)
(`)
(%)
(x)
(x)
(x)
FY2020E
4,897
10.5
223
28.9
3.7
16.3
7.6
0.8
FY2021E
5,632
10.5
269
34.8
21.9
13.5
6.5
0.7
Source: Company, Angel Research
Source: Company, Angel Research
September 7, 2019
7
Angel Top Picks | September 2019
Maruti Suzuki
Stock Info
CMP
6122
Maruti Suzuki continues to hold ~52% market share in the passenger vehicles.
TP
7783
The launch of exciting models has helped the company to ride on the
Upside
27.1%
premiumization wave that is happening in the country. In the last two years,
Sector
Automobile
company has seen improvement in the business mix with the pie of the utility
vehicles.
Market Cap (` cr)
1,84,921
Beta
1.26
Well place to capture any revival in industry due to overall refreshment of
52 Week High / Low
9400/5447
portfolio (Already more than 50% of portfolio launched based on BS6
compliance like Alto, Wagon, Baleno, Dzire, Swift. Launching new product in
3 year-Chart
august which has potential to contribute Signiant on Top-line - MPV - XL6.)
12,000
10,000
8,000
6,000
Key Financials
4,000
Y/E
Sales
OPM
PAT
EPS
ROE
P/E
P/BV
EV/EBITDA
EV/Sales
2,000
March
(` cr)
(%)
(` cr)
(`)
(%)
(x)
(x)
(x)
(x)
-
FY2020E
84,277
11.9
6,443
213.3
12.9
28.7
3.7
14.4
1.7
FY2021E
90,201
12.6
7,126
235.9
13.5
25.9
3.5
12.4
1.6
Source: Company, Angel Research
Source: Company, Angel Research
Mahindra & Mahindra Ltd.
Stock Info
CMP
M&M is an India-based company, operating in nine segments: automotive,
529
farm equipment, IT services, financial services, steel trading & processing,
TP
724
infrastructure, hospitality, Systech and Others (comprising logistics, after-
Upside
36.9%
market, two wheelers and investment).
Sector
Automobile
IMD has predicted a near normal monsoon for 2019 for the third consecutive
Market Cap (` cr)
65,752
year, which would help the tractor sales growth. In our view, healthy growth in
Beta
1.39
tractor industry would benefit M&M the most due to strong brand recall and
52 Week High / Low
992/503
leadership position in farm tractor.
We expect M&M to report healthy top-line and bottom-line growth over long
3 year-Chart
period mainly due to healthy growth in automobile segment like Utility
1,200
Vehicles (on the back of new launches and facelift of some models) and
1,000
healthy growth in Tractors segment driven by strong brand recall and
800
improvement in rural sentiment.
600
400
Key Financials
200
Y/E
Sales
OPM
PAT
EPS
ROE
P/E
P/BV
EV/EBITDA
EV/Sales
-
March
(` cr)
(%)
(` cr)
(`)
(%)
(x)
(x)
(x)
(x)
FY2020E
54,213
11.7
4,167
35.0
11.1
15.1
1.7
6.9
0.8
FY2021E
57,752
12.0
4,627
38.9
11.3
13.6
1.5
6.1
0.7
Source: Company, Angel Research
Source: Company, Angel Research
September 7, 2019
8
Angel Top Picks | September 2019
Stock Info
Safari Industries
CMP
560
Safari Industries Ltd (Safari) is the third largest branded player in the Indian
TP
646
luggage industry. Post the management change in 2012, Safari has grown its
Upside
15.3%
revenue by 6x in the last 7 years. This has been achieved by foraying in many
Sector
Luggage
new categories like back pack, school bags (via acquisition of Genius and
Market Cap (` cr)
1,251
Genie) and improvement in distribution networks.
Beta
0.63
Its margins have more than doubled from 4.1% in FY2014 to 9.1% in FY2019,
52 Week High / Low
948/481
driven by launch of new product categories and business. We expect it to
maintain 9%+ margins from FY2018 onwards led by regular price hikes, shift
3 year-Chart
towards organized player and favorable industry dynamics.
1,200
1,000
We expect its revenue to grow by a CAGR of ~18%/23% in revenue/ earnings
800
over FY2018-20E on the back of growth in its recently introduced new
600
products.
400
200
Key Financials
-
Y/E
Sales
OPM
PAT
EPS
ROE
P/E
P/BV
EV/Sales
March
(` cr)
(%)
(` cr)
(`)
(%)
(x)
(x)
(x)
FY2020E
702.4
11.1
33.1
14.9
14.5
37.7
7.3
1.9
Source: Company, Angel Research
FY2021E
813.5
11.3
41.1
18.5
15.5
30.3
6.3
1.6
Source: Company, Angel Research
Stock Info
RBL Bank
CMP
327
TP
540
RBL Bank (RBK) has grown its loan book at healthy CAGR of 53% over FY10-
19. We expect it to grow at 27% over FY19-21E. With adequately diversified,
Upside
64.9%
well capitalised B/S, RBK is set to grab market share from corporate lenders
Sector
Banking
(esp.PSUs).
Market Cap (` cr)
14,093
Beta
1.42
The retail loan portfolio grew 62% YoY to `18,391cr and now constitutes 32%
of the loan book (18% share in 4QFY17).NIM has expanded to 4.23%, up
52 Week High / Low
717/292
19bps YoY, despite a challenging interest rate scenario on the back of a
changing portfolio mix. However, the management disclosed stressed asset
3 year-Chart
800
worth `1,000Cr which will increase GNPA to 2.25%. Management is confident
700
that it would normalise by Q1FY21.
600
500
RBL Bank currently trades at 1.5x its FY2021E price to book value, which we
400
believe is reasonable for a bank in a high growth phase with stable asset
300
quality.
200
100
-
Key Financials
Y/E
Op. Inc
NIM
PAT
EPS
ABV
ROA
ROE
P/E
P/ABV
March
(` cr)
(%)
(` cr)
(`)
(`)
(%)
(%)
(x)
(x)
Source: Company, Angel Research
FY2020E
3,270
3.7
1,018
24
190
1.1
12.8
13.7
1.7
FY2021E
4,226
3.8
1,503
35
216
1.3
16.6
9.3
1.5
Source: Company, Angel Research
September 7, 2019
9
Angel Top Picks | September 2019
Exhibit 2: Changes in Recommendation
Effective Date
Stock
CMP
Change in recommantaion
(`)
From
To
06-06-2019
Ashok Leyland
70
Buy
Hold
06-06-2019
GIC Housing
243
Buy
Hold
06-06-2019
Inox Wind
55
Buy
Hold
06-06-2019
Music Broadcast
46
Buy
Hold
06-06-2019 Siyaram Silk Mills
255
Buy
Hold
06-09-2019 Parag Food Milks
137
Buy
Hold
06-09-2019
Bata India
1545
Buy
Hold
06-09-2019 Aditya Birla Capital
93
Buy
Hold
Source: Angel Research
Hold - While we recommend to Hold on to existing positions at current level, we
would await for further data points before recommending any fresh purchases.
September 7, 2019
10
Angel Top Picks | September 2019
Research Team Tel: 022 - 39357800
DISCLAIMER
Angel Broking Limited (hereinafter referred to as “Angel”) is a registered Member of National Stock Exchange of India Limited, Bombay
Stock Exchange Limited and Metropolitan Stock Exchange Limited. It is also registered as a Depository Participant with CDSL and
Portfolio Manager and investment advisor with SEBI. It also has registration with AMFI as a Mutual Fund Distributor. Angel Broking
Private Limited is a registered entity with SEBI for Research Analyst in terms of SEBI (Research Analyst) Regulations, 2014 vide
registration number INH000000164. Angel or its associates has not been debarred/ suspended by SEBI or any other regulatory
authority for accessing /dealing in securities Market. Angel or its associates/analyst has not received any compensation / managed or
co-managed public offering of securities of the company covered by Analyst during the past twelve months.
This document is solely for the personal information of the recipient, and must not be singularly used as the basis of any investment
decision. Nothing in this document should be construed as investment or financial advice. Each recipient of this document should
make such investigations as they deem necessary to arrive at an independent evaluation of an investment in the securities of the
companies referred to in this document (including the merits and risks involved), and should consult their own advisors to determine
the merits and risks of such an investment.
Reports based on technical and derivative analysis center on studying charts of a stock's price movement, outstanding positions and
trading volume, as opposed to focusing on a company's fundamentals and, as such, may not match with a report on a company's
fundamentals. Investors are advised to refer the Fundamental and Technical Research Reports available on our website to evaluate the
contrary view, if any.
The information in this document has been printed on the basis of publicly available information, internal data and other reliable
sources believed to be true, but we do not represent that it is accurate or complete and it should not be relied on as such, as this
document is for general guidance only. Angel Broking Limited or any of its affiliates/ group companies shall not be in any way
responsible for any loss or damage that may arise to any person from any inadvertent error in the information contained in this report.
Angel Broking Limited has not independently verified all the information contained within this document. Accordingly, we cannot testify,
nor make any representation or warranty, express or implied, to the accuracy, contents or data contained within this document. While
Angel Broking Limited endeavors to update on a reasonable basis the information discussed in this material, there may be regulatory,
compliance, or other reasons that prevent us from doing so.
This document is being supplied to you solely for your information, and its contents, information or data may not be reproduced,
redistributed or passed on, directly or indirectly.
Neither Angel Broking Limited, nor its directors, employees or affiliates shall be liable for any loss or damage that may arise from or in
connection with the use of this information
Ratings (Based on expected returns
Buy (> 15%)
Accumulate (5% to 15%)
Neutral (-5 to 5%)
over 12 months investment period):
Reduce (-5% to -15%)
Sell (< -15)