
Please refer to important disclosures at the end of this report
1
Angel Top Picks – September 2022
August sees strong return of FIIs – After a strong recovery of ~10% in Jul’22, the
Indian markets remained in the positive territory, posting gains of 3.5%. More
importantly, the FIIs returned in a major way as they bought ~₹50,000Cr in August.
Although the pace has reduced, the MFs continued to remain net buyers to the extent
of ~₹2,770Cr. The markets did give away some gains in the second half of August
post cautious commentary regarding the inflation and the measures to tackle it. The
growth outlook and optimism levels for Indian and Advanced Economies are different
and the reversal in the trend of FII flows reflects India’s strong positioning.
Jackson Hole takeaways suggest further hikes – At the annual gathering of monetary
policymakers, Federal Reserve Chair, Jerome Powell said that the FOMC’s primary
focus right now is to bring inflation back down to 2% even if means that the growth
will be impacted for a prolonged period. At the most recent meeting in July, the
FOMC raised the target range for the federal funds rate by 75bps to 2.25% - 2.5%.
The consensus among attendees, including other central banks, was the same, which
would mean the growth outlook would remain disappointing.
India's growth recovery continues – Although India’s Q1FY23 YoY GDP growth of
13.5% appears low owing to the impact of the second wave in the base quarter
(Q1FY22), it is pertinent to note that the economy has crossed the pre-pandemic
level. As per various commentaries and surveys, economic activity is showing signs
of broadening and the overall demand environment is improving. As for high-
frequency indicators, the PMI Manufacturing and Services continued to remain in an
expansionary zone with a reading of 56.2 and 57.2 respectively in Aug’22.
Moreover, the survey results suggest that the demand environment is strong and the
moderation in inflation has boosted sentiments. GST collections at ₹1.43 lakh crores
in Aug’21, marked the 6th consecutive month of ₹1.40 lakh crore+ collections.
Falling crude/commodity prices to provide relief – We believe that the current
scenario of a weaker global outlook lowers the chances of a significant spike in crude
oil prices. Indian companies have been impacted on the margin front over the past
Few quarters and the recent correction of crude and other non-energy commodity
prices would not only prove to be tailwinds but also aid in containing overall inflation
and spur demand. Moreover, operating leverage along with recovering gross
margins would support NIFTY earnings.
Maintain a positive view from a longer-term perspective – We believe that India is in
a relatively stronger position vs. other Advanced and Emerging economies that are
experiencing high inflation and lower growth. Moreover, our strong fundamentals
and external position are expected to drive further investments and cushion us from
external shocks, respectively. At current levels, the Nifty is trading at a P/E multiple
of 19x on rolling one-year consensus earnings, which is below its 10-year average
of 20x. Though the upside may be limited in the near term, the long-term prospects
remain intact given the low corporate leverage levels, the better position of financial
institutions, and the revival of the investment cycle in India.
Top Picks Performance
Return Since Inception (30th Oct, 2015)
Top Picks Return
196.10%
BSE 100
122.40%
Outperformance
73.70%
Source: Company, Angel Research
Top Picks
Company
CMP (`)
TP (`)
Auto
Sona BLW Precis.
522
843
Ramkrishna Forg.
205
256
Suprajit Engg.
340
485
Banking
Federal Bank
124
138
HDFC Bank
1495
1700
AU Small Finance
652
848
Chemical
P I Industries
3327
3700
Jubilant Ingrev.
466
700
IT
HCL Technologies
936
1192
Others
Stove Kraft
646
805
Sobha
708
850
Amber Enterp.
2294
3850
Oberoi Realty
1038
1208
Devyani Intl.
186
255
Marico
521
600
Source: Company, Angel Research
Note: Closing price as on 05
th
Sep, 2022
Research Analyst:
Amarjeet Maurya
(amarjeet.maurya@angelbroking.com)
Yash Gupta
(yash.gupta@angelbroking.com )

September 6, 2022
2
Angel Top Picks – September 2022
Top Picks
September 6, 2022
3
Angel Top Picks – September 2022
Federal Bank
Federal bank is one of India's largest old generation private sector banks.
At the end of Q4 FY2022 the bank had advances of Rs. 1.45 lakh cr. and
deposits of Rs. 1.81 lakh cr. The bank predominantly has a secured
lending book which helped limit asset quality issues during the Covid 19
pandemic.
Federal Bank has posted a good set of numbers for Q4FY22 as NII/
advances increased by 7.4%/9.9% YoY. Provisioning for the quarter was
down by 10% YoY as a result of which PAT was up by 13.1% YoY. GNPA
and NNPA ratio improved to 2.80% and 0.96% while restructuring
remained stable sequentially at 2.6% of advances.
Overall asset quality for the quarter improved in Q4FY22, which was in
line with our expectations. We expect asset quality to improve further in
FY2023 given normalization of the economy. We expect the Federal bank
to post NII/PPOP/PAT CAGR of 24.9%/29.1%/42.7% between FY2022-
24 and remain positive on the bank.
Key Finance
Y/E
NII
NIM
PAT
EPS
ABV
ROA
ROE
P/E
P/ABV
March
(` cr)
(%)
(` cr)
(`)
(`)
(%)
(%)
(x)
(x)
FY2023E
7,532
3.1
3,127.6
14.9
97.2
1.3
15.4
8.0
1.1
FY2024E
9,301
3.2
3,846.2
18.3
114.0
1.3
16.1
6.5
1.0
Source: Company, Angel Research
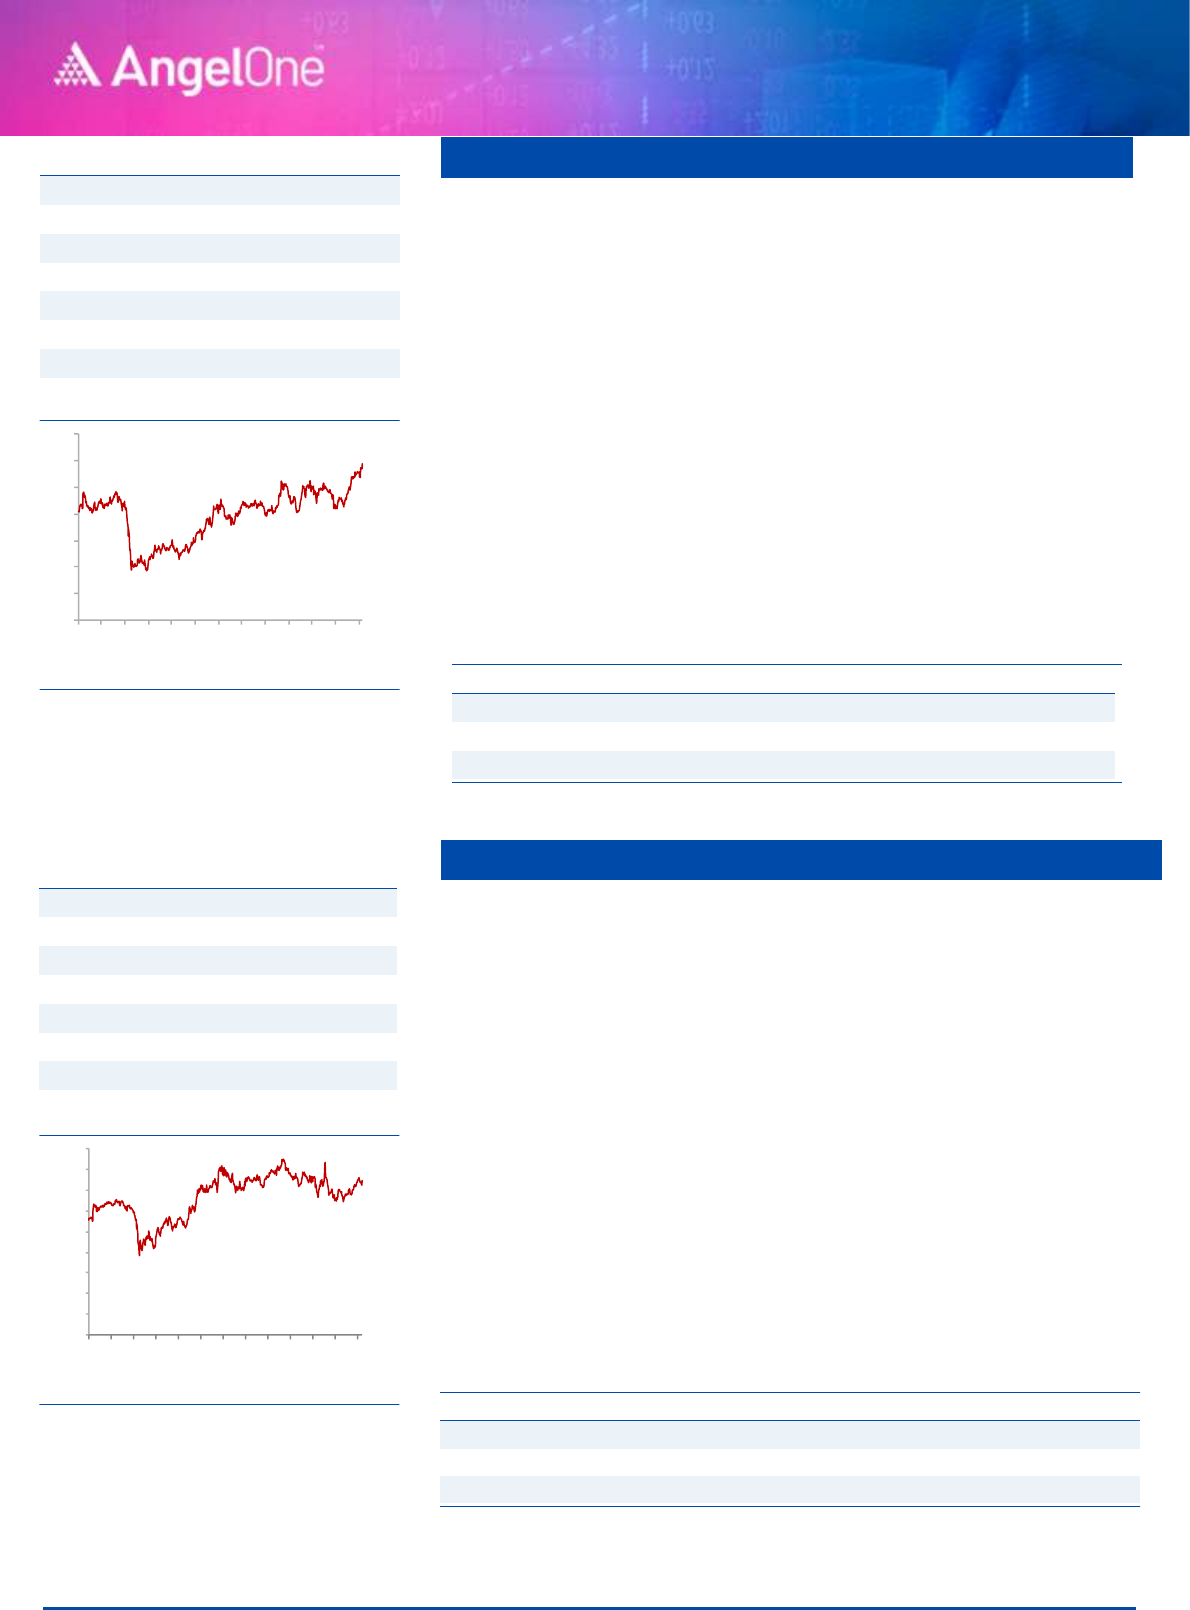
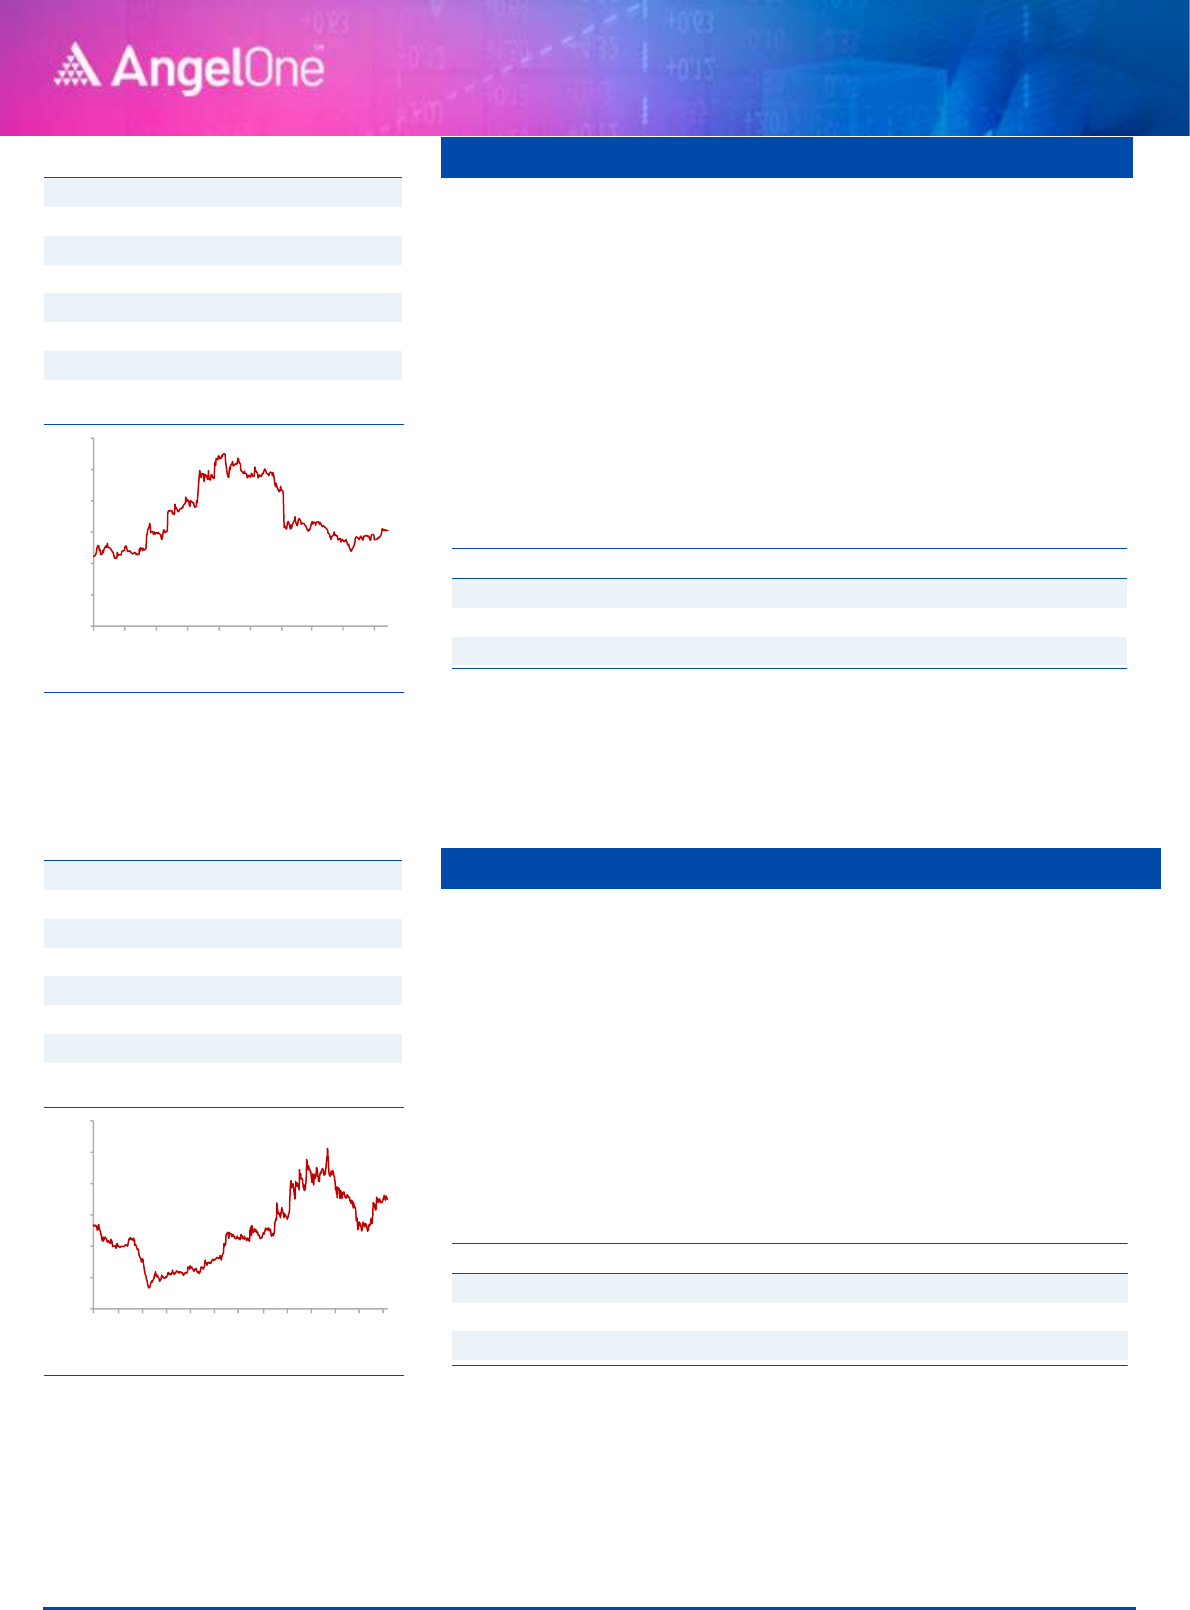
HDFC Bank
HDFC bank is India's largest private sector bank with a loan book of ₹ 13.68
lakh crore in Q4FY2022 and deposit base of ₹ 15.6 lakh crore. The Bank
has a very well spread-out book with wholesale constituting ~57% of the
asset book while retail accounted for the remaining 44% of the loan book.
Q4FY2022 numbers were below expectations due to change in portfolo mix
towards corporate which resulted in contraction in NIM by 10bps QoQ to
4.0%. Moreover, higher opex dragged down PPOP growth. The bank posted
NII/PPOP growth of 10.2%/5.3% for the quarter on the back of loan growth
of 20.8% YoY.
While operating numbers were below expectations, the bank posted an
improvement in asset quality as GNPA/ NNPA reduced by 9/5bps QoQ to
1.17% and 0.32% of advances. Restructured advances at the end of the
quarter stood at 1.14% of advances. Given best in class asset quality,
expected rebound in retail credit growth we are positive on the bank given
reasonable valuations at 2.3xFY24, adjusted book which is at a discount to
historical averages.
Stock Info
CMP
124
TP
138
Upside
12%
Sector
Banking
Market Cap (` cr)
25,996
Beta
1.2
52 Week High / Low
130/78
3-Year-Chart
-
20
40
60
80
100
120
140
Sep-19
Dec-19
Mar-20
May-20
Aug-20
Nov-20
Feb-21
May-21
Aug-21
Nov-21
Feb-22
May-22
Aug-22
Source: Company, Angel Research
Stock Info
CMP
1495
TP
1700
Upside
14%
Sector
Banking
Market Cap (` cr)
830,652
Beta
1.1
52 Week High / Low
1724/1272
3-Year-Chart
-
200
400
600
800
1,000
1,200
1,400
1,600
1,800
Sep-19
Dec-19
Mar-20
May-20
Aug-20
Nov-20
Feb-21
May-21
Aug-21
Nov-21
Feb-22
May-22
Aug-22
Source: Company, Angel Research
Key Finance
Y/E
NII
NIM
PAT
EPS
ABV
ROA
ROE
P/E
P/ABV
March
(` cr)
(%)
(` cr)
(`)
(`)
(%)
(%)
(x)
(x)
FY2023E
85,512
4.0
46630
84.1
499.0
2.1
18.2
17.8
2.9
FY2024E
108,523
4.1
59845
107.9
606.0
2.2
19.4
13.9
2.4
Source: Company, Angel Research
September 6, 2022
4
Angel Top Picks – September 2022
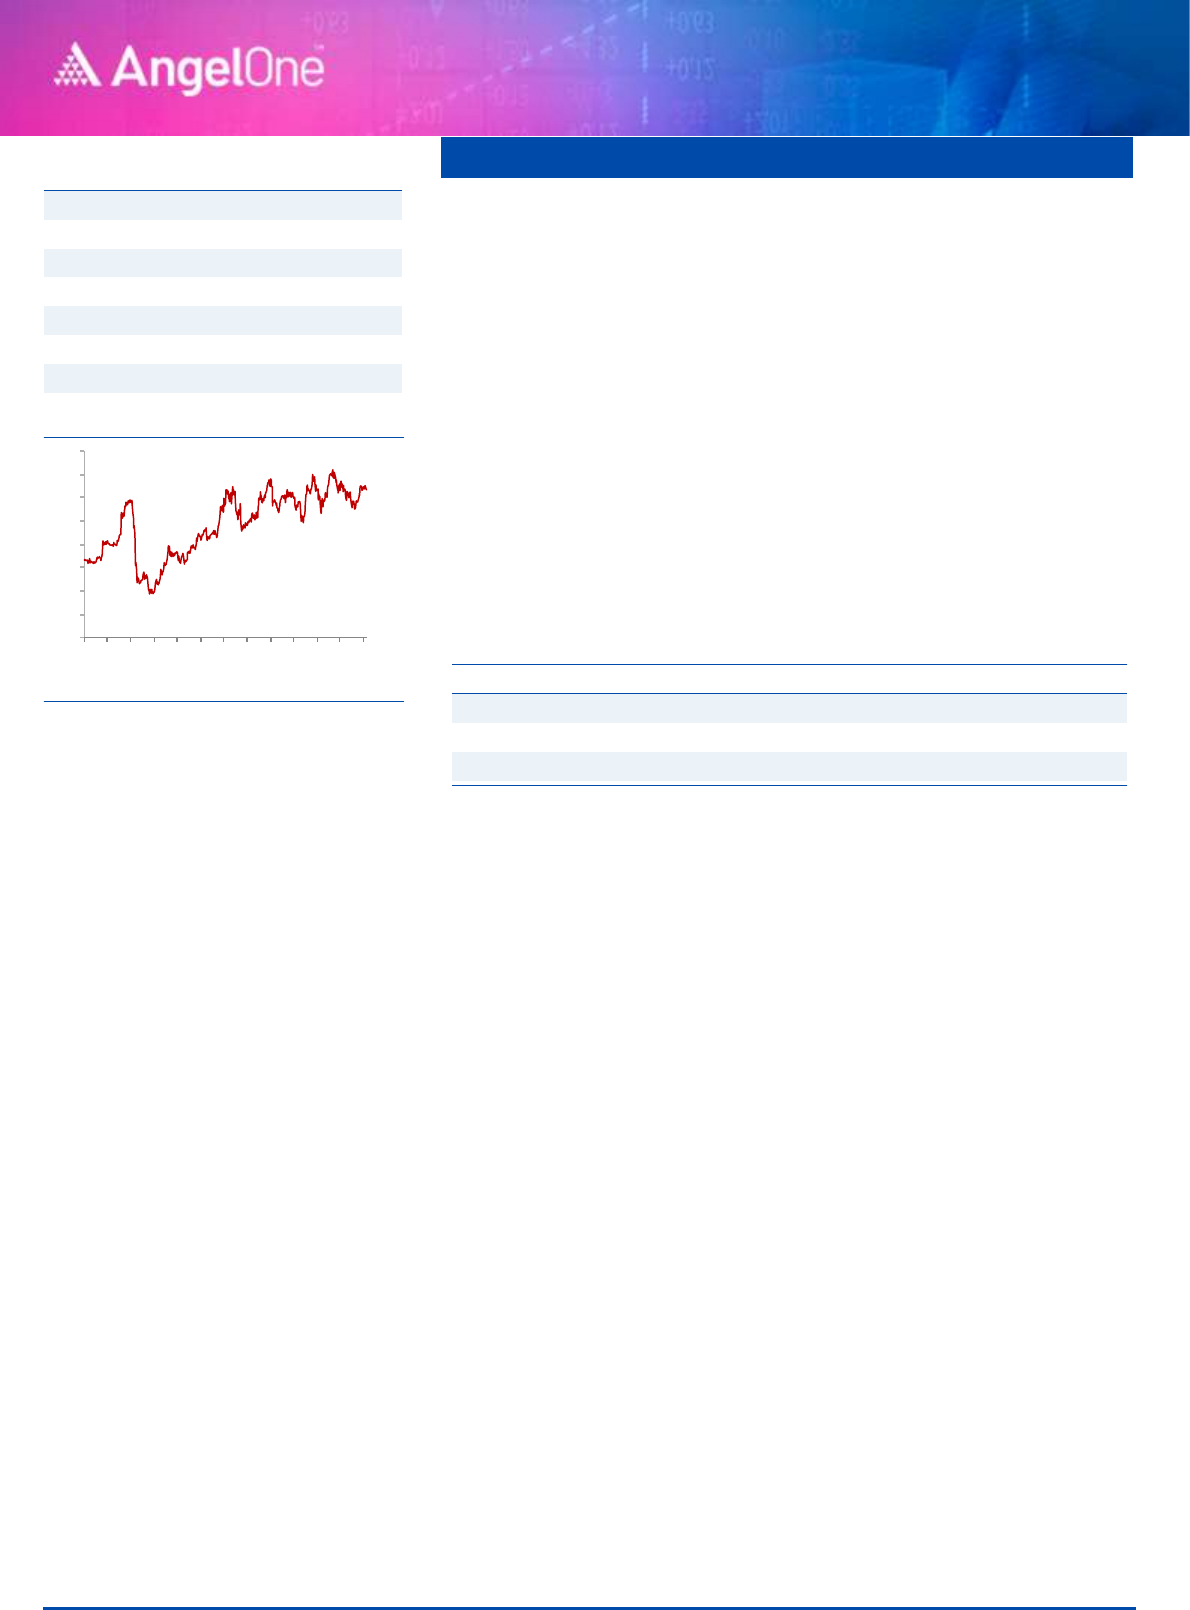
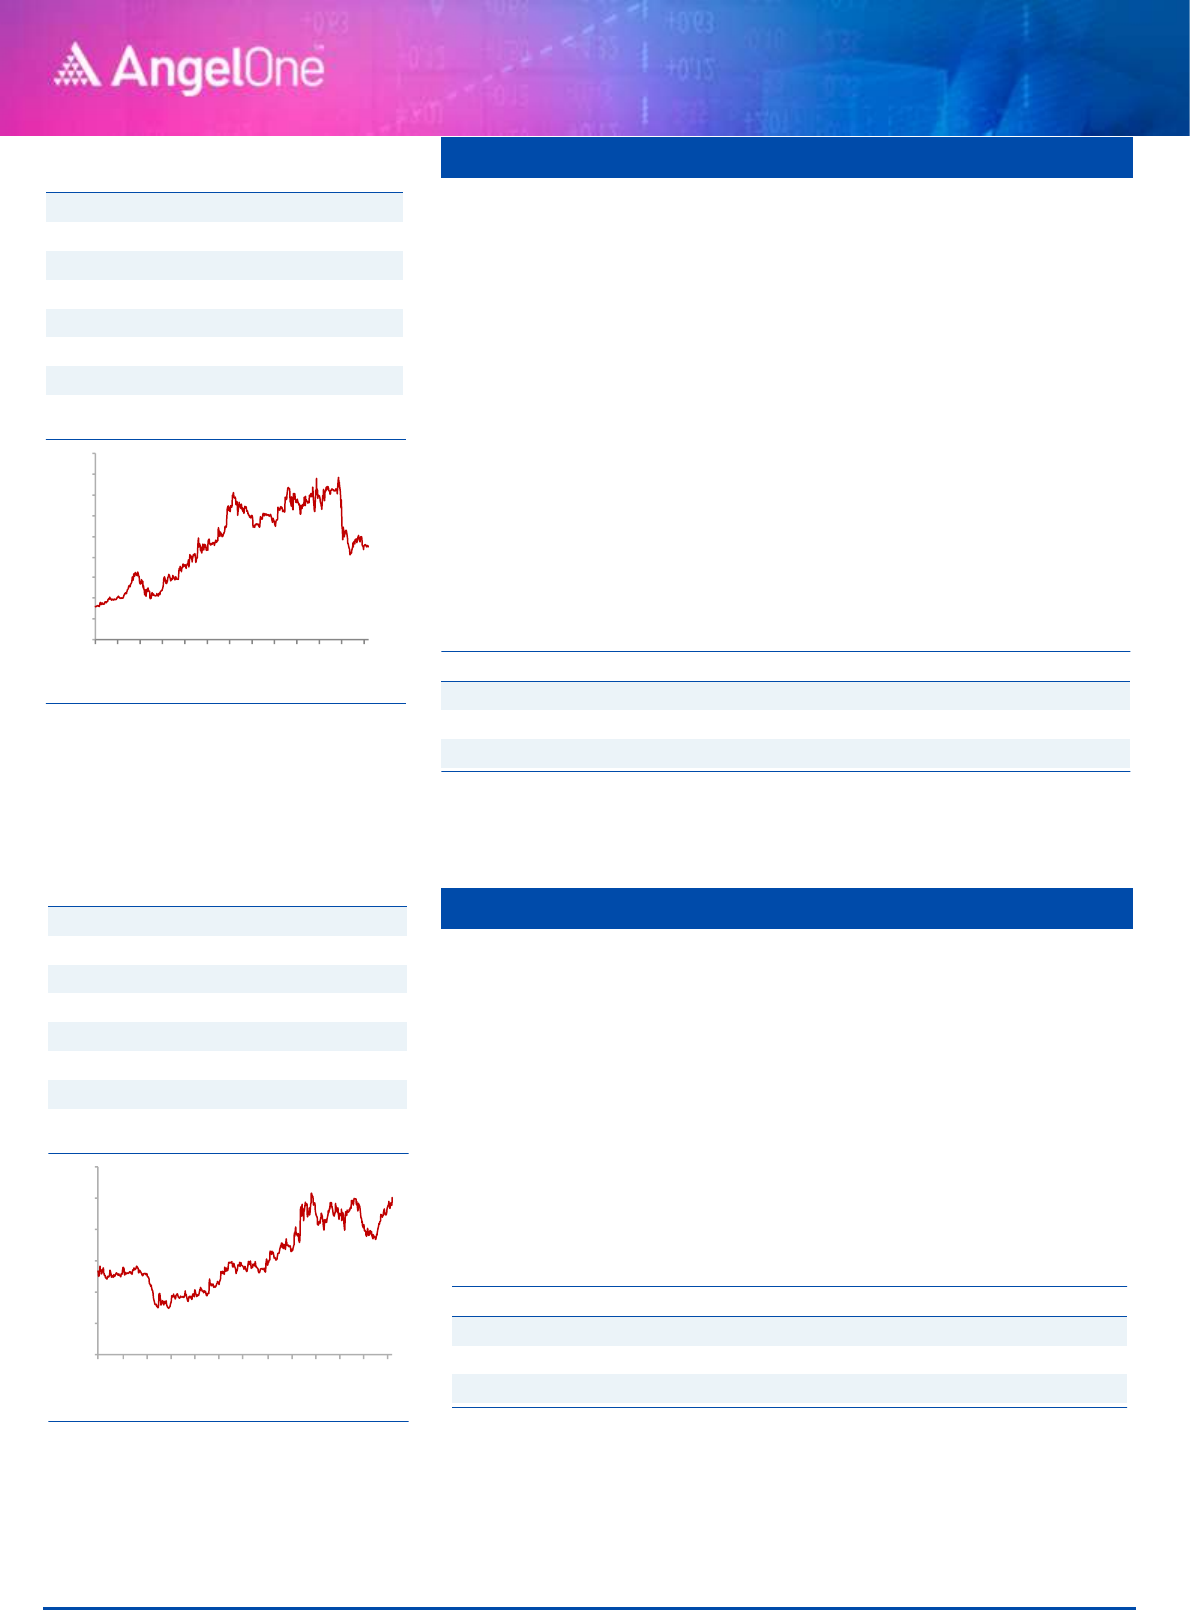
AU Small Finance Bank
AU Small Finance Bank is one of the leading small finance banks with Total
Loan AUM of ~47,831 Cr. at the end of Q4FY2022. It has a well-
diversified geographical presence across India. AU has a very high
exposure to high margin retail business, which accounted for 80% of AUM
at the end of FY2022.
AU continued to report very strong numbers in Q4FY2022 as GNPA/ NNPA
reduced by 62/79bps QoQ to1.98% and 0.5% of advances. Restructured
advances at the end of the quarter also declined to 2.5% of advances. The
bank posted NII growth of 42.8% for the quarter on the back of strong
advances growth of 33% YoY while NIMs for the quarter stood at 6.3%.
We expect AU SFB to post robust NII/PPOP/ PAT CAGR of
35.2%/40.2%/38.7% between FY2022-24 on the back of AUM CAGR of
34.8%. Reducing cost of funds will also help NIM expansion going forward.
We believe that the worst is over for the bank and expect continued
improvement in asset quality in FY2023, which should lead to a rerating.
Key Finance
Y/E
NII
NIM
PAT
EPS
ABV
ROA
ROE
P/E
P/ABV
March
(` cr)
(%)
(` cr)
(`)
(`)
(%)
(%)
(x)
(x)
FY2023E
4,517
5.5
1701
54.0
263.5
2.1
20.3
11.9
2.5
FY2024E
5,913
5.4
2174
69.0
332.5
2.0
21.1
9.3
1.9
Source: Company, Angel Research
Stock Info
CMP
652
TP
848
Upside
30%
Sector
Banking
Market Cap (` cr)
43,751
Beta
1.2
52 Week High / Low
733/468
3-Year-Chart
-
100
200
300
400
500
600
700
800
Sep-19
Dec-19
Mar-20
May-20
Aug-20
Nov-20
Feb-21
May-21
Aug-21
Nov-21
Feb-22
May-22
Aug-22
Source: Company, Angel Research
September 6, 2022
5
Angel Top Picks – September 2022
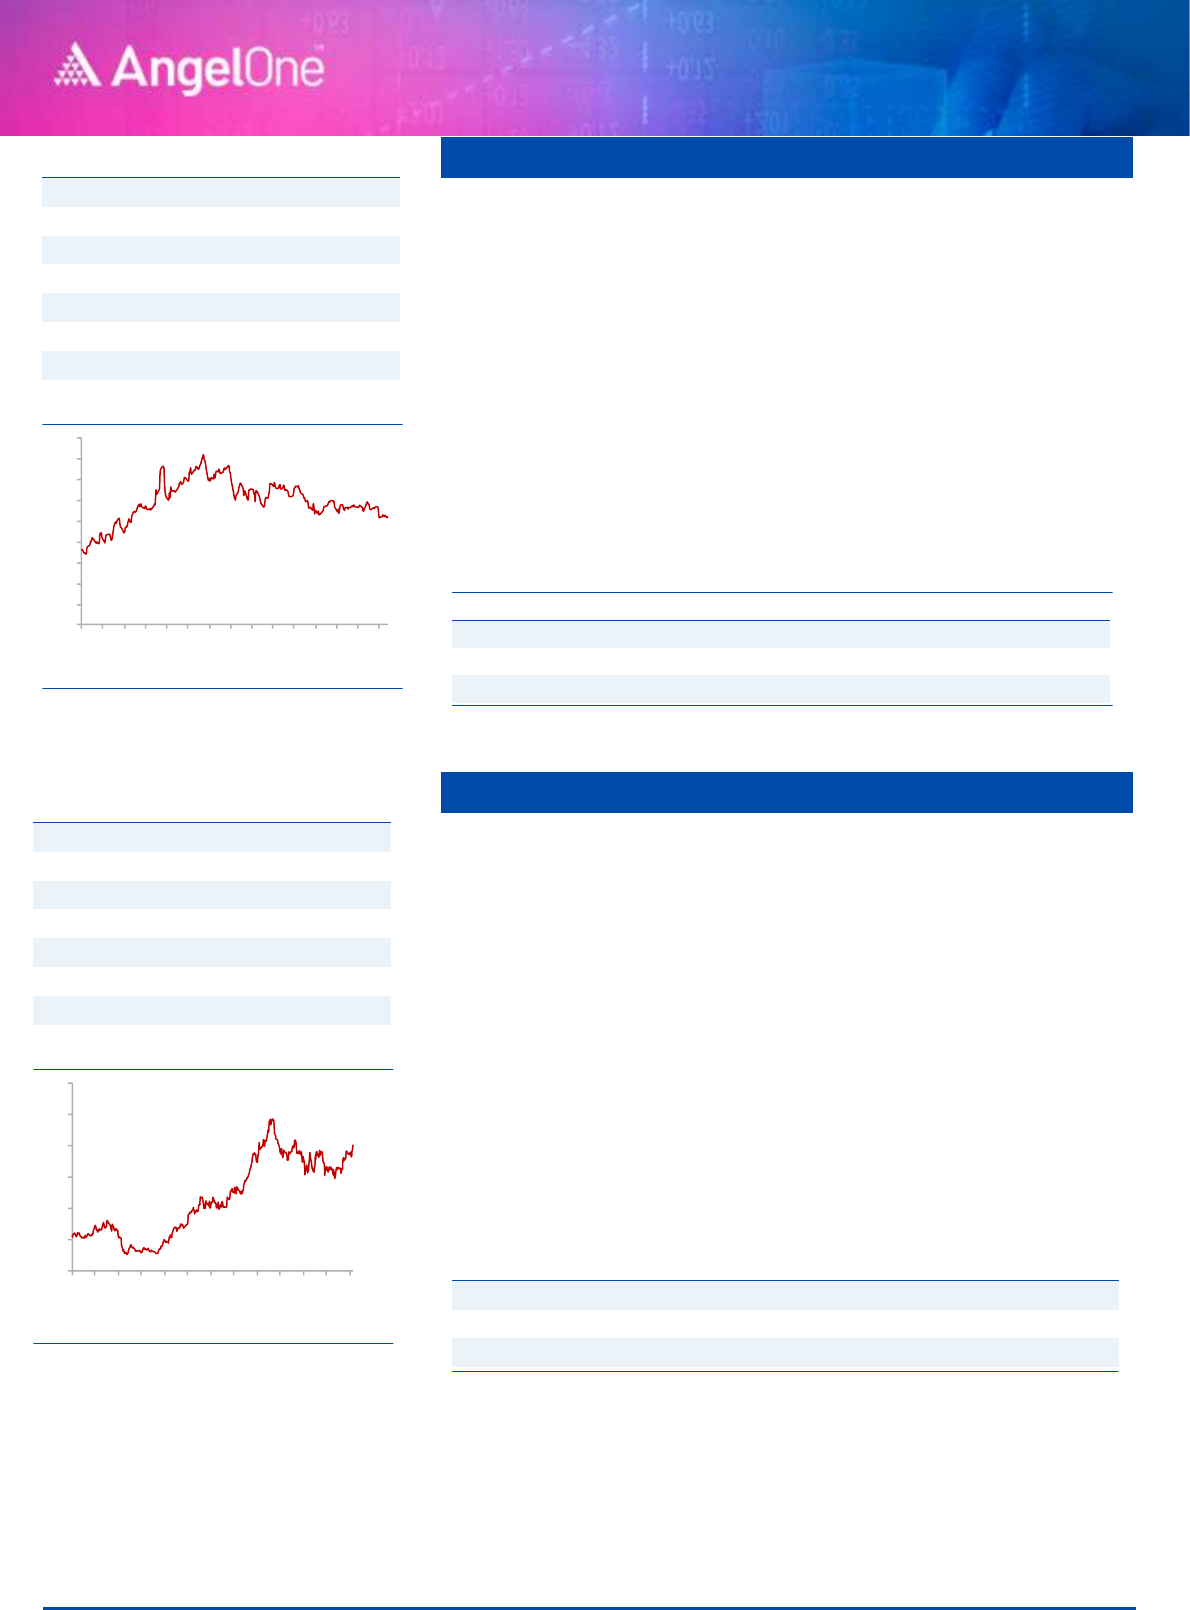
Sona BLW Precis.
Sona BLW, one of India's leading automotive technology companies,
derives ~50% of its revenues from Battery Electric Vehicles (BEV) and
Hybrid Vehicles and stands to benefit from the global electrification trend.
Sona BLW has a strong positioning in the Indian Differential Gears market
across PV, CV, and tractor OEMs and it continues to gain market share
globally aided by its combined motor and driveline capabilities. Focus on
R&D is yielding results in new product development which is likely to aid
further growth.
Sona BLW continues to add new customers and win new orders and its
order book stands at `20,600 Cr which along with its strong financial
profile and expected ~45% earnings CAGR over FY22-24E justifies the
premium multiples of ~45x FY24E EPS.
Key Finance
Y/E
Sales
OPM
PAT
EPS
ROE
P/E
P/BV
EV/Sales
March
(` cr)
(%)
(` cr)
(`)
(%)
(x)
(x)
(x)
FY2023E
2,915
26.5
451
7.7
21.1
68.0
14.7
11.5
FY2024E
4,066
29.2
739
12.6
29.7
41.5
12.3
8.2
Source: Company, Angel Research
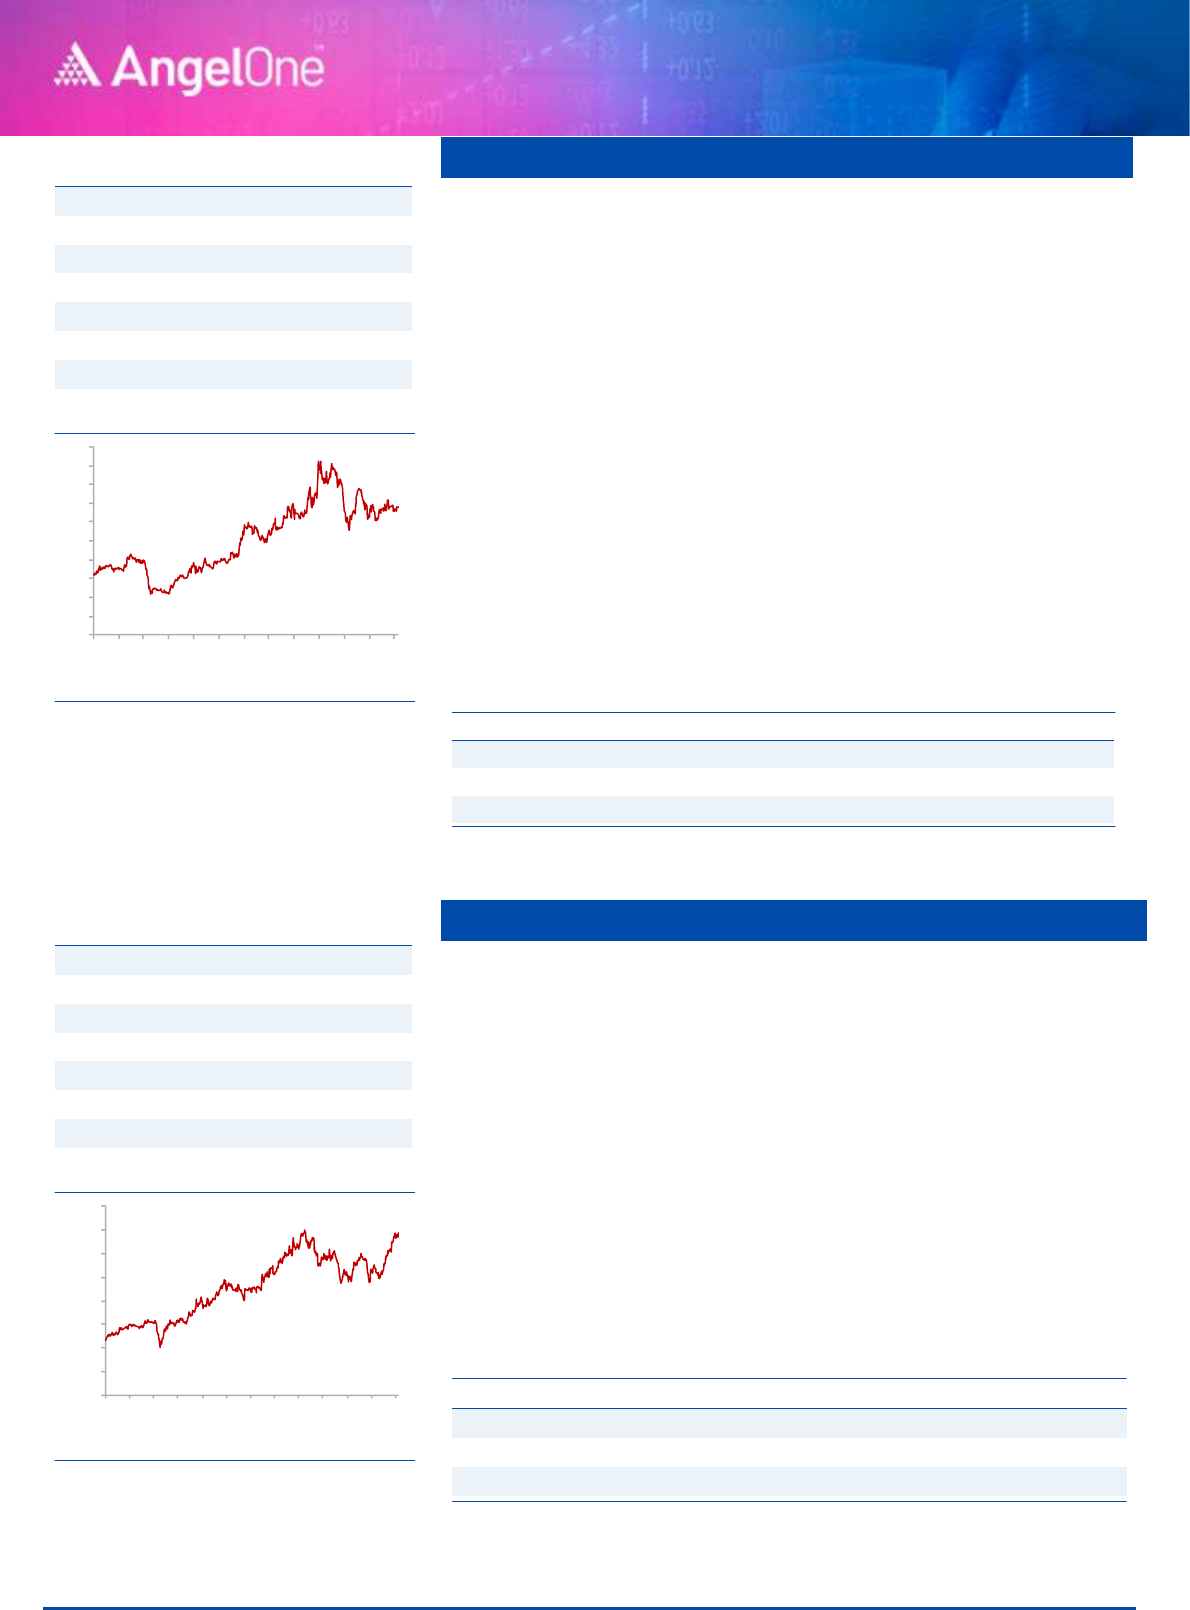
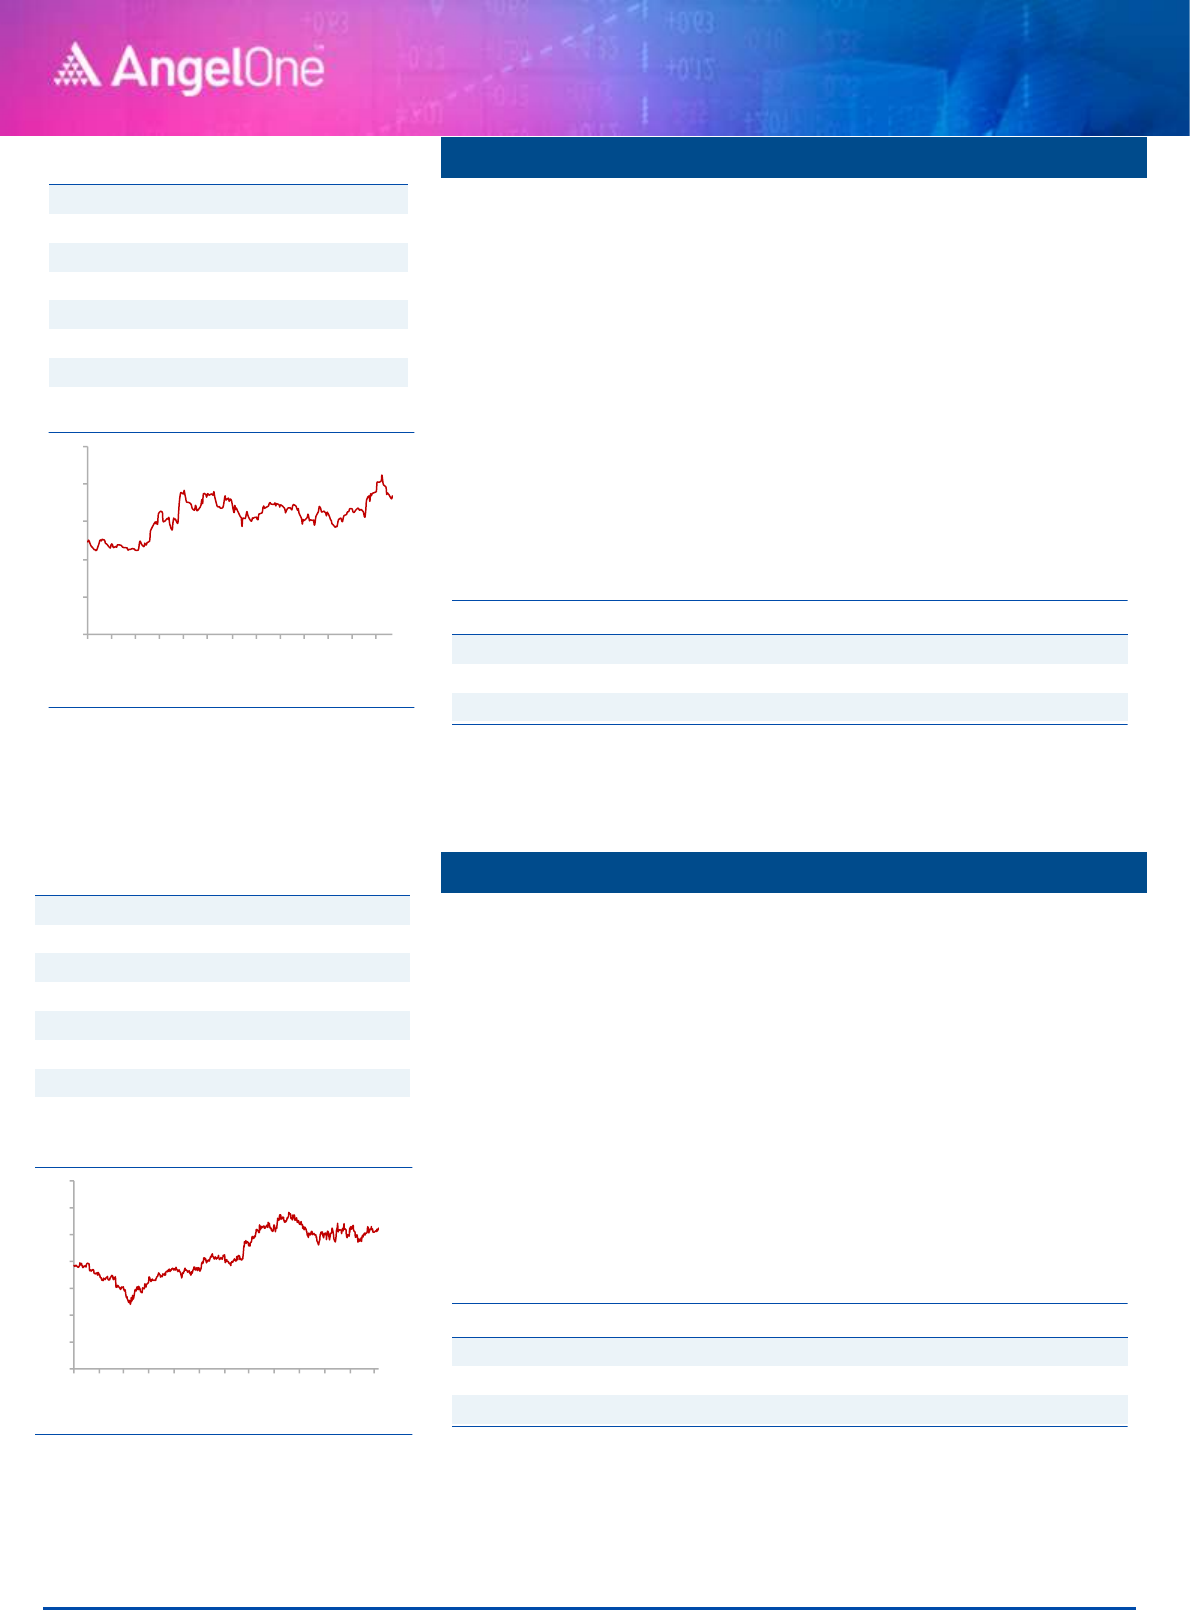
Ramakrishna forg.
Ramkrishna Forgings (RKFL), a leading forging player in India and among
a select few having heavy press, stands to benefit from a favorable
demand outlook for the Medium & Heavy Commercial Vehicle (M&HCV)
industry in domestic and other key geographies in the near term.
The company has phased out its CAPEX over the past few years during
which it was impacted by industry slowdown in certain periods. With the
end to the CAPEX cycle, the favorable outlook in the medium term, and
sufficient capacity in place, we believe RKFL volumes would be able to
post a volume CAGR of 14% over FY22-24E.
RKFL has been able to add new products which have higher value
addition. Better mix along with operating leverage aided ~520 bps YoY
improvement in EBITDA margins in FY22 and are expected to sustain
going ahead.
Key Finance
Y/E
Sales
OPM
PAT
EPS
ROE
P/E
P/BV
EV/Sales
March
(` cr)
(%)
(` cr)
(`)
(%)
(x)
(x)
(x)
FY2023E
2,688
23.5
261
16.3
19.7
12.7
2.0
1.3
FY2024E
3,074
24.1
339
21.2
21.0
9.7
1.6
1.1
Source: Company, Angel Research
Stock Info
CMP
522
TP
843
Upside
61%
Sector
Auto
Market Cap (` cr)
30,705
Beta
1.3
52 Week High / Low
839/505
14-Month-Chart
-
100
200
300
400
500
600
700
800
900
Jun-21
Jul-21
Aug-21
Sep-21
Oct-21
Nov-21
Dec-21
Jan-22
Feb-22
Mar-22
Apr-22
May-22
Jun-22
Jul-22
Aug-22
Source: Company, Angel Research
Stock Info
CMP
205
TP
256
Upside
25%
Sector
Auto
Market Cap (` cr)
3,312
Beta
1.2
52 Week High / Low
252/146
3-Year-Chart
-
50
100
150
200
250
300
Sep-19
Dec-19
Mar-20
May-20
Aug-20
Nov-20
Feb-21
May-21
Aug-21
Nov-21
Feb-22
May-22
Aug-22
Source: Company, Angel Research
September 6, 2022
6
Angel Top Picks – September 2022
Suprajit Eng.
Suprajit Engineering (SEL) is the largest supplier of automotive cables to
the domestic OEMs with a presence across both 2Ws and PVs. Over the
years, SEL has evolved from a single product/client company in India to
have a diversified exposure which coupled with its proposition of low-cost
player has enabled it to gain market share and more business from
existing customers.
SEL overall has outperformed the Indian Auto industry in recent years
aided by market share gains as well as commercialization of new
products. The company believes that consolidation of vendors and new
client additions would help in maintaining the trend of market/wallet
share gains.
SEL has grown profitably over the years and as a result, it boasts a strong
balance sheet (net cash). We believe SEL is a prime beneficiary of a ramp-
up in production by OEMs and its newly developed products for EVs would
support revenues due to higher kit value. Its premium valuations are
justified in our opinion owing to its strong outlook and top-grade quality
of earnings.
Key Finance
Y/E
Sales
OPM
PAT
EPS
ROE
P/E
P/BV
EV/Sales
March
(` cr)
(%)
(` cr)
(`)
(%)
(x)
(x)
(x)
FY2023E
2,794
14.4
221
16.0
19.2
21.1
3.7
1.8
FY2024E
3,132
14.8
266
19.2
22.8
17.6
4.1
1.7
Source: Company, Angel Research
P I Industries
PI Industries is a leading player in providing Custom synthesis and
manufacturing solutions (CSM) to global agrochemical players. The CSM
business accounted for over 70% of the company's revenues in FY22 and is
expected to be the key growth driver for the company in future.
The company has been increasing it's share of high margin CSM business
driven by strong relationship with global agrochemical players. PI is
leveraging its chemistry skill sets and is looking to diversify its CSM portfolio
to electronic chemicals, Pharma API, fluoro chemicals, etc. which will help
drive business.
We expect PI Industries to post revenue/PAT CAGR of 17%/24% between
FY22-FY24 driven by 20% growth in the CSM business over the next 2-3
years. Moreover foray into new segments like electronic chemicals and APIs
will also help drive growth over next 3-4 years for the company.
Key Finance
Y/E
Sales
OPM
PAT
EPS
ROE
P/E
P/BV
EV/Sales
March
(` cr)
(%)
(` cr)
(`)
(%)
(x)
(x)
(x)
FY2023E
6,181
23.0
1064
70.0
15.0
48.0
5.7
6.2
FY2024E
7,194
23.8
1299
85.5
15.6
39.3
4.9
5.2
Source: Company, Angel Research
Stock Info
CMP
340
TP
485
Upside
42%
Sector
Auto
Market Cap (` cr)
4,683
Beta
1.3
52 Week High / Low
478/272
3-Year-Chart
-
50
100
150
200
250
300
350
400
450
500
Sep-19
Dec-19
Mar-20
May-20
Aug-20
Nov-20
Feb-21
May-21
Aug-21
Nov-21
Feb-22
May-22
Aug-22
Source: Company, Angel Research
Stock Info
CMP
3327
TP
3700
Upside
11%
Sector
Chemical
Market Cap (` cr)
51,035
Beta
0.9
52 Week High / Low
3533/2334
3-Year-Chart
-
500
1,000
1,500
2,000
2,500
3,000
3,500
4,000
Sep-19
Dec-19
Mar-20
May-20
Aug-20
Nov-20
Feb-21
May-21
Aug-21
Nov-21
Feb-22
May-22
Aug-22
Source: Company, Angel Research

September 6, 2022
7
Angel Top Picks – September 2022
Jubilant Ingrev.
Jubilant Ingrevia was formed by spinning off the chemical and life science
ingredients of Jubilant Life Sciences Ltd. The company has a vast array of
products across its three divisions and is one of the top two producers of
Pyridine - Beta and vitamin B3 globally.
The company derives 56% of its revenues from the life science chemicals
division while the specialty chemicals and nutrition & health solution
business account for 28% and 15% of revenues respectively.
At current levels the stock is trading at P/E multiple of ~13.5xFY24 EPS
which is at a significant discount to other chemical companies. Therefore,
we believe that there is value in the stock at current levels and hence rate
it a BUY.
Key Finance
Y/E
Sales
OPM
PAT
EPS
ROE
P/E
P/BV
EV/Sales
March
(` cr)
(%)
(` cr)
(`)
(%)
(x)
(x)
(x)
FY2023E
5,020
17.0
544
34.2
19.9
13.7
2.9
1.6
FY2024E
5,572
17.4
633
39.7
19.5
11.8
2.4
1.4
Source: Company, Angel Research
HCL Technologies
HCL Tech (HCLT) is amongst the top four IT services companies based out
of India and provides a vast gamut of services like ADM, Enterprise
solutions, Infrastructure management services, etc.
IT services growth of over 2.7% QoQ CC in Q1FY23 which largely broad-
based and due to recovery in Products which grew by 5.1% QoQ CC.
New deal TCV at USD 2.1bn was up by 23% YoY and included many
large deals. Strong deal wins will help drive growth in the services
business, which should make up for the continued softness in the product
business.
At CMP, the stock is trading at a significant discount to the other large-
cap IT companies like Infosys and TCS and offers tremendous value at
current levels given market leader status in Infrastructure management.
Key Finance
Y/E
Sales
OPM
PAT
EPS
ROE
P/E
P/BV
EV/Sales
March
(` cr)
(%)
(` cr)
(`)
(%)
(x)
(x)
(x)
FY2023E
98,316
22.0
14,028
52.3
21.9
17.7
4.1
2.4
FY2024E
1,08,179
22.6
16,017
59.6
23.7
15.5
3.8
2.2
Source: Company, Angel Research
Stock Info
CMP
466
TP
700
Upside
50%
Sector
Chemical
Market Cap (` cr)
7,434
Beta
1.7
52 Week High / Low
878/401
16-Months-Chart
-
100
200
300
400
500
600
700
800
900
Mar-21
Apr-21
May-21
Jun-21
Jul-21
Aug-21
Sep-21
Oct-21
Nov-21
Dec-21
Jan-22
Feb-22
Mar-22
Apr-22
May-22
Jun-22
Jul-22
Aug-22
Source: Company, Angel Research
-
200
400
600
800
1,000
1,200
1,400
1,600
Jul-19
Sep-19
Dec-19
Mar-20
Jun-20
Sep-20
Dec-20
Mar-21
Jun-21
Sep-21
Dec-21
Mar-22
Jun-22
Stock Info
CMP
936
TP
1192
Upside
27%
Sector
IT
Market Cap (` cr)
254,517
Beta
0.8
52 Week High / Low
1377/876
3-Year-Chart
-
200
400
600
800
1,000
1,200
1,400
1,600
Sep-19
Dec-19
Mar-20
May-20
Aug-20
Nov-20
Feb-21
May-21
Aug-21
Nov-21
Feb-22
May-22
Aug-22
Source: Company, Angel Research
September 6, 2022
8
Angel Top Picks – September 2022
Stove Kraft
Stove Kraft Ltd (SKL) is engaged in the business of manufacturing & selling
Kitchen & Home appliances products like pressure cookers, LPG stoves, non-
stick cookware etc. under the brand name of 'Pigeon' and 'Gilma'.
In the Pressure Cookers and Cookware segment, over the last two years, the
company has outperformed Industry and its peers. Post Covid, organized
players are gaining market share from unorganized players which would
benefit the player like SKL.
Going forward, we expect SKL to report healthy top-line & bottom-line growth
on the back of new product launches, strong brand name and wide
distribution network.
Key Finance
Y/E
Sales
OPM
PAT
EPS
ROE
P/E
P/BV
EV/Sales
March
(` cr)
(%)
(` cr)
(`)
(%)
(x)
(x)
(x)
FY2023E
1,341
8.4
62.6
19.2
14.7
32.4
4.2
1.3
FY2024E
1,582
9.1
86.0
26.4
16.8
23.6
3.5
1.1
Source: Company, Angel Research
Sobha
Company operates in Residential & Commercial real-estate along with
Contractual business. Companies 64% of residential pre-sales come from the
Bangalore market, which is one of the IT hubs in India, we expect new hiring by
the IT industry will increase residential demand in the South India market.
Ready to move inventory and under construction inventory levels have moved
down to its lowest levels. Customers are now having preference towards the
branded players like Sobha Developers.
Company expected new projects/phase spread over 13.53mn sqft across 7
cities. Majority of launches will be coming from existing land banks. Company
having land bank of approx. 200mn Sqft of salable area.
Key Finance
Y/E
Sales
OPM
PAT
EPS
ROE
P/E
P/BV
EV/Sales
March
(` cr)
(%)
(` cr)
(`)
(%)
(x)
(x)
(x)
FY2023E
3,350
58.0
457.0
48.1
15.6
14.6
1.7
1.9
FY2024E
3,752
59.0
524.0
55.4
16.2
12.7
1.5
1.7
Source: Company, Angel Research
Stock Info
CMP
646
TP
805
Upside
24%
Sector
Others
Market Cap (` cr)
2,116
Beta
0.8
52 Week High / Low
1135/472
17-Months-Chart
-
200
400
600
800
1,000
1,200
Feb-21
Apr-21
Jun-21
Aug-21
Oct-21
Dec-21
Feb-22
Apr-22
Jun-22
Aug-22
Source: Company, Angel Research
Stock Info
CMP
708
TP
850
Upside
20%
Sector
Others
Market Cap (` cr)
6,753
Beta
1.2
52 Week High / Low
1045/480
3-Year-Chart
-
200
400
600
800
1,000
1,200
Sep-19
Dec-19
Mar-20
May-20
Aug-20
Nov-20
Feb-21
May-21
Aug-21
Nov-21
Feb-22
May-22
Aug-22
Source: Company, Angel Research
September 6, 2022
9
Angel Top Picks – September 2022
Amber Enterp.
Amber Enterprises India Ltd. (Amber) is the market leader in the room air
conditioners (RAC) outsourced manufacturing space in India. Amber would
outperform the industry due to dominant position in Room AC contract
manufacturer, increase in share of business in existing customers and new
client additions.
Amber plans to increase revenues from components (by increasing product
offerings, catering to newer geographies, adding new clients) and exports
(already started in the Middle east). In the past 2-3 year, Amber has acquired
companies like IL JIN Electronics, Ever and Sidwal Refrigeration Industries,
which would help in backward integration and also help the company to foray
in different segments like railway, metro and defense.
Going forward, we expect healthy profitability on back of foray into the
Commercial AC segment, entry into export markets, participation in the PLI
scheme.
Key Finances
Y/E
Sales
OPM
PAT
EPS
ROE
P/E
P/BV
EV/Sales
March
(` cr)
(%)
(` cr)
(`)
(%)
(x)
(x)
(x)
FY2023E
5,522
7.4
208
61.8
16.4
36.4
4.4
1.5
FY2024E
6,850
8.0
304
90.2
18.8
25.0
4.1
1.2
Source: Company, Angel Research
Oberoi Realty
Oberoi Realty is a real-estate company, focusing on the MMR region.
Company having business vertices of residential and commercial real-
estate.
Company has reported a strong set of numbers in Q4FY22, we expect
residential real-estate growth momentum to continue for the next couple of
quarters as in Q1FY23 company has launched Elysian Tower B in Goregon
along with this upcoming launch of Thane in current year.
We have seen good consolidation in across India towards top-10 players.
Top-10 players now holds 11.2% market share as compared to 5.4% in 2017.
We believes that top-10 players will continue to gain market share.
Key Finance
Y/E
Sales
OPM
PAT
EPS
ROE
P/E
P/BV
EV/Sales
March
(` cr)
(%)
(` cr)
(`)
(%)
(x)
(x)
(x)
FY2023E
3,621
59.0
1502
41.2
12.9
24.8
2.6
8.6
FY2024E
4,055
59.2
1550
42.6
13.1
24.0
2.6
8.2
Source: Company, Angel Research
Stock Info
CMP
2294
TP
3850
Upside
68%
Sector
Others
Market Cap (` cr)
7,736
Beta
0.5
52 Week High / Low
4024/2030
3-Year-Chart
-
500
1,000
1,500
2,000
2,500
3,000
3,500
4,000
4,500
Sep-19
Dec-19
Mar-20
May-20
Aug-20
Nov-20
Feb-21
May-21
Aug-21
Nov-21
Feb-22
May-22
Aug-22
Source: Company, Angel Research
Stock Info
CMP
1038
TP
1208
Upside
16%
Sector
Others
Market Cap (` cr)
37,382
Beta
1.5
52 Week High / Low
1052/706
3-Year-Chart
-
200
400
600
800
1,000
1,200
Sep-19
Dec-19
Mar-20
May-20
Aug-20
Nov-20
Feb-21
May-21
Aug-21
Nov-21
Feb-22
May-22
Aug-22
Source: Company, Angel Research
September 6, 2022
10
Angel Top Picks – September 2022
Devyani Intl.
Devyani International Ltd. (DIL) is Yum! Brands’ largest franchisee in India,
with more than 800 stores including KFC, Pizza Hut and Costa Coffee.
Currently, DIL operates 339 KFC stores, 391 Pizza Hut stores, 50 Costa Coffee
stores in India and balance stores from other brands and from international
locations.
QSR industry is expected to grow ~23% CAGR over FY20-25 which would
benefit the player like DIL. Going ahead, We expect DIL would add 200 stores
per annum (at least 3-4 year) which would drive strong revenue growth.
Lower capex (shifted its strategy to smaller & delivery-focused stores) and
improving store-level economics would boost the operating margin going
ahead. Going forward, we expect DIL to report strong top-line growth &
improvement in operating on the back of aggressive store addition, improving
store unit economics and strong brand.
Key Finance
Y/E
Sales
OPM
PAT
EPS
ROE
P/E
P/BV
EV/Sales
March
(` cr)
(%)
(` cr)
(`)
(%)
(x)
(x)
(x)
FY2023E
2,990
23.0
258
2.4
27.3
77.3
20.5
5.9
FY2024E
3,947
23.4
410
3.9
30.3
47.6
14.3
5.2
Source: Company, Angel Research
Marico
Marico is one of the major FMCG companies present in hair oil, edible oil,
foods & personal care segment. Major brands include Parachute, Saffola,
Nihar, Hair & Care, Set Wet, Livon & Beardo.
Marico’s products have strong brand recall coupled with an extensive
distribution reach of more than 5mn outlets and direct reach of ~1 million
outlets. Parachut flagship brand gained market share by 170 bps in FY22 &
expected to performance better going ahead.
In the medium term, the company aspires to grow revenue at 13-15% with
8-10% volume growth. Marico has a strong balance sheet along with free cash
flow and higher profitability. We expect Marico to report healthy bottom-line
CAGR of ~11% over FY2022-24E due to better volume growth on the back
of strong brand, wide distribution network.
Key Finance
Y/E
Sales
OPM
PAT
EPS
ROE
P/E
P/BV
EV/Sales
March
(` cr)
(%)
(` cr)
(`)
(%)
(x)
(x)
(x)
FY2023E
10,368
17.9
1287
10.2
30.3
51.1
15.3
6.2
FY2024E
11,301
18.8
1478
11.7
28.0
44.5
12.3
5.6
Source: Company, Angel Research
Stock Info
CMP
186
TP
255
Upside
37%
Sector
Others
Market Cap (` cr)
22,348
Beta
1.4
52 Week High / Low
215/112
12-Month-Chart
-
50
100
150
200
250
Aug-21
Sep-21
Oct-21
Nov-21
Dec-21
Jan-22
Feb-22
Mar-22
Apr-22
May-22
Jun-22
Jul-22
Aug-22
Source: Company, Angel Research
Stock Info
CMP
521
TP
600
Upside
15%
Sector
Others
Market Cap (` cr)
67,223
Beta
1.2
52 Week High / Low
606/456
3-Year-Chart
-
100
200
300
400
500
600
700
Sep-19
Dec-19
Mar-20
May-20
Aug-20
Nov-20
Feb-21
May-21
Aug-21
Nov-21
Feb-22
May-22
Aug-22
Source: Company, Angel Research

September 6, 2022
11
Angel Top Picks – September 2022
Stock bought in last 12 Months
Stock
Date
Reco
Price
Marico
14-Jun-22
BUY
498.00
Devyani Intl.
9-Feb-22
BUY
175.00
Oberoi Realty
7-Jan-22
BUY
922
Jubilant Ingrev.
31-Dec-21
BUY
565
HCL Technologies
20-Dec-21
BUY
1,159
Ramkrishna Forg.
13-Oct-21
BUY
244
Whirlpool India
29-Sep-21
BUY
2,299
Lemon Tree Hotel
23-Sep-21
BUY
43.25
Sobha
22-Sep-21
BUY
729.00
Amber Enterp.
14-Sep-21
BUY
3243.00
P I Industries
9-Sep-21
BUY
3,420
Source: Company, Angel Research
Stock sold in last 12 Months
Stock
Date
Reco
Price
Ashok Leyland
5-Sep-22
EXIT
165
Carborundum Uni.
28-Feb-22
EXIT
813
Safari Inds.
10-Feb-22
EXIT
942.00
Lemon Tree Hotel
17-Dec-21
EXIT
47.25
Shri.City Union.
6-Dec-21
EXIT
2,066
Whirlpool India
3-Nov-21
EXIT
2,074
GNA Axles
19-Oct-21
EXIT
1,076
L & T Infotech
27-Sep-21
EXIT
5,950
Bajaj Electrical
24-Sep-21
EXIT
1,499
Dalmia BharatLtd
22-Sep-21
EXIT
2,143
Crompton Gr. Con
14-Sep-21
EXIT
484.00
Sobha
7-Sep-21
EXIT
780
Source: Company, Angel Research

September 6, 2022
12
Angel Top Picks – September 2022
Ratings (Based on Expected Returns: Buy (> 15%) Accumulate (5% to 15%) Neutral (-5 to 5%)
Over 12 months investment period) Reduce (-5% to -15%) Sell (< -15%)
Hold (Fresh purchase not recommended)
Research Team Tel: 022 - 40003600 E-mail: [email protected] Website: www.angelone.in
DISCLAIMER
Angel One Limited (hereinafter referred to as “Angel”) is a registered Member of National Stock Exchange of India Limited, Bombay Stock
Exchange Limited and Metropolitan Stock Exchange Limited. It is also registered as a Depository Participant with CDSL and Portfolio Manager
and investment advisor with SEBI. It also has registration with AMFI as a Mutual Fund Distributor. Angel One Limited is a registered entity with
SEBI for Research Analyst in terms of SEBI (Research Analyst) Regulations, 2014 vide registration number INH000000164. Angel or its
associates has not been debarred/ suspended by SEBI or any other regulatory authority for accessing /dealing in securities Market.
This document is solely for the personal information of the recipient, and must not be singularly used as the basis of any investment decision.
Nothing in this document should be construed as investment or financial advice. Each recipient of this document should make such
investigations as they deem necessary to arrive at an independent evaluation of an investment in the securities of the companies referred to
in this document (including the merits and risks involved), and should consult their own advisors to determine the merits and risks of such an
investment.
Angel or its associates or research analyst or his relative may have actual/beneficial ownership of 1% or more in the securities of the subject
company at the end of the month immediately preceding the date of publication of the research report. Neither Angel or its associates nor
Research Analysts or his relative has any material conflict of interest at the time of publication of research report.
Angel or its associates might have received any compensation from the companies mentioned in the report during the period preceding twelve
months from the date of this report for services in respect of managing or co-managing public offerings, corporate finance, investment
banking or merchant banking, brokerage services or other advisory service in a merger or specific transaction in the normal course of
business. Angel or its associates did not receive any compensation or other benefits from the companies mentioned in the report or third party
in connection with the research report. Neither Angel nor its research analyst entity has been engaged in market making activity for the subject
company.
Reports based on technical and derivative analysis center on studying charts of a stock's price movement, outstanding positions and trading
volume, as opposed to focusing on a company's fundamentals and, as such, may not match with a report on a company's fundamentals.
Investors are advised to refer the Fundamental and Technical Research Reports available on our website to evaluate the contrary view, if any.
The information in this document has been printed on the basis of publicly available information, internal data and other reliable sources
believed to be true, but we do not represent that it is accurate or complete and it should not be relied on as such, as this document is for
general guidance only. Angel One Limited or any of its affiliates/ group companies shall not be in any way responsible for any loss or damage
that may arise to any person from any inadvertent error in the information contained in this report. Angel One Limited has not independently
verified all the information contained within this document. Accordingly, we cannot testify, nor make any representation or warranty, express
or implied, to the accuracy, contents or data contained within this document. While Angel One Limited endeavors to update on a reasonable
basis the information discussed in this material, there may be regulatory, compliance, or other reasons that prevent us from doing so.
This document is being supplied to you solely for your information, and its contents, information or data may not be reproduced, redistributed
or passed on, directly or indirectly.
Neither Angel One Limited, nor its directors, employees or affiliates shall be liable for any loss or damage that may arise from or in connection
with the use of this information. Angel or its associates or Research Analyst or his relative might have financial interest in the subject company.
Research analyst has not served as an officer, director or employee of the subject company.
