Angel Top Picks - May 2017
With the strong economic optimism, higher inflows and expectation of normal
Top Picks
monsoon, markets have reached to new highs. We believe that corporate earnings
Company
CMP (`)
TP (`)
are likely to remain strong which will justify our valuation going ahead.
Banking/NBFC
Dewan Housing
447
520
IMD forecasts normal monsoon: Until March-2017, there was ~50% probability of
Equitas Holdings
163
235
El Nino hitting this year’s monsoon during the peak rainfall period. This would
Consumption
have led in India receiving below normal rainfall in 2017. The monsoon outlook
however has improved with 40% probability of El Nino hitting the monsoon during
Asian Granito
384
405
peak period. This has eased the worries surrounding the rainfall during this
Blue Star
675
760
monsoon season which is good news for the markets. IMD has predicted 96%
Siyaram Silk Mills
1,674
1,872
rainfall this year which is considered as normal monsoon. This will be the 2nd
Media
consecutive year of normal rainfall in the country which will help in improving the
Jagran Prakashan
198
225
rural economy and keeping the inflation in check.
TV Today
271
344
Real Estate/Infra/Logistics/Power
Markets scale new highs, valuations sustainable: The Indian markets rallied 17% in
KEI Industries
214
239
the last fiscal owing to improving macros, better monsoon and political stability. FII
inflows also surged towards the end of the year with rally in rupee and sound
Mahindra Lifespace
444
522
economic optimism. The expectation of normal monsoon and higher likelihood of
Navkar Corp.
214
265
selection of a centrist candidate in France has strengthened this rally further with
Pharma
Indian markets reaching new highs in April-2017. Currently Indian markets are
Alkem Lab.
1,988
2,311
valued at 17.9x of 1 year forward earnings while 22.3x on TTM earnings. Though
Source: Angel Research;
Note: CMP as of May 2, 2017
valuations look at premium vs. historical average, we believe that corporate
earnings are likely to justify these valuations. The main trigger for the corporate
earnings would the already strong consumption trend, percolation of low interest
rate benefits in the wider economy, and reforms.
Reforms to drive investments, corporate earnings: Implementation of GST from
July-2017 will be an important change in our indirect tax regime which will
improve ease in doing business and help in faster growth of the economy and
bring more efficiency in operations. We also opine that the affordable housing
scheme is a key reform that will have a significantly positive impact on the
economy. With correction in real estate prices and lower interest rates, schemes
like affordable housing have potential to kick-in the demand in the housing sector
which can have a cascading impact on multiple sectors. We believe that sectors
like Cement, Construction, building materials, consumer durables, etc will strongly
benefit from this.
As announced during the budget, government has almost abolished the Foreign
Investment Board (FIPB) which will help in bringing more FDI flows in the country.
Overall, we remain positive on the reforms which will deliver the next phase of
economic growth in India.
Considering the overall optimism, we continue to maintain positive view on
sectors like real estate (Mahindra Lifespace, Asian Granito), BFSI (Equitas,
Dewan Housing), Consumption (Blue Star), etc. We also remain positive on
Alkem, Jagaran Prakashan, TV Today, etc.
Please refer to important disclosures at the end of this report
1
Top Picks Report | May 2017
Top Picks
May 3, 2017
2
Top Picks Report | May 2017
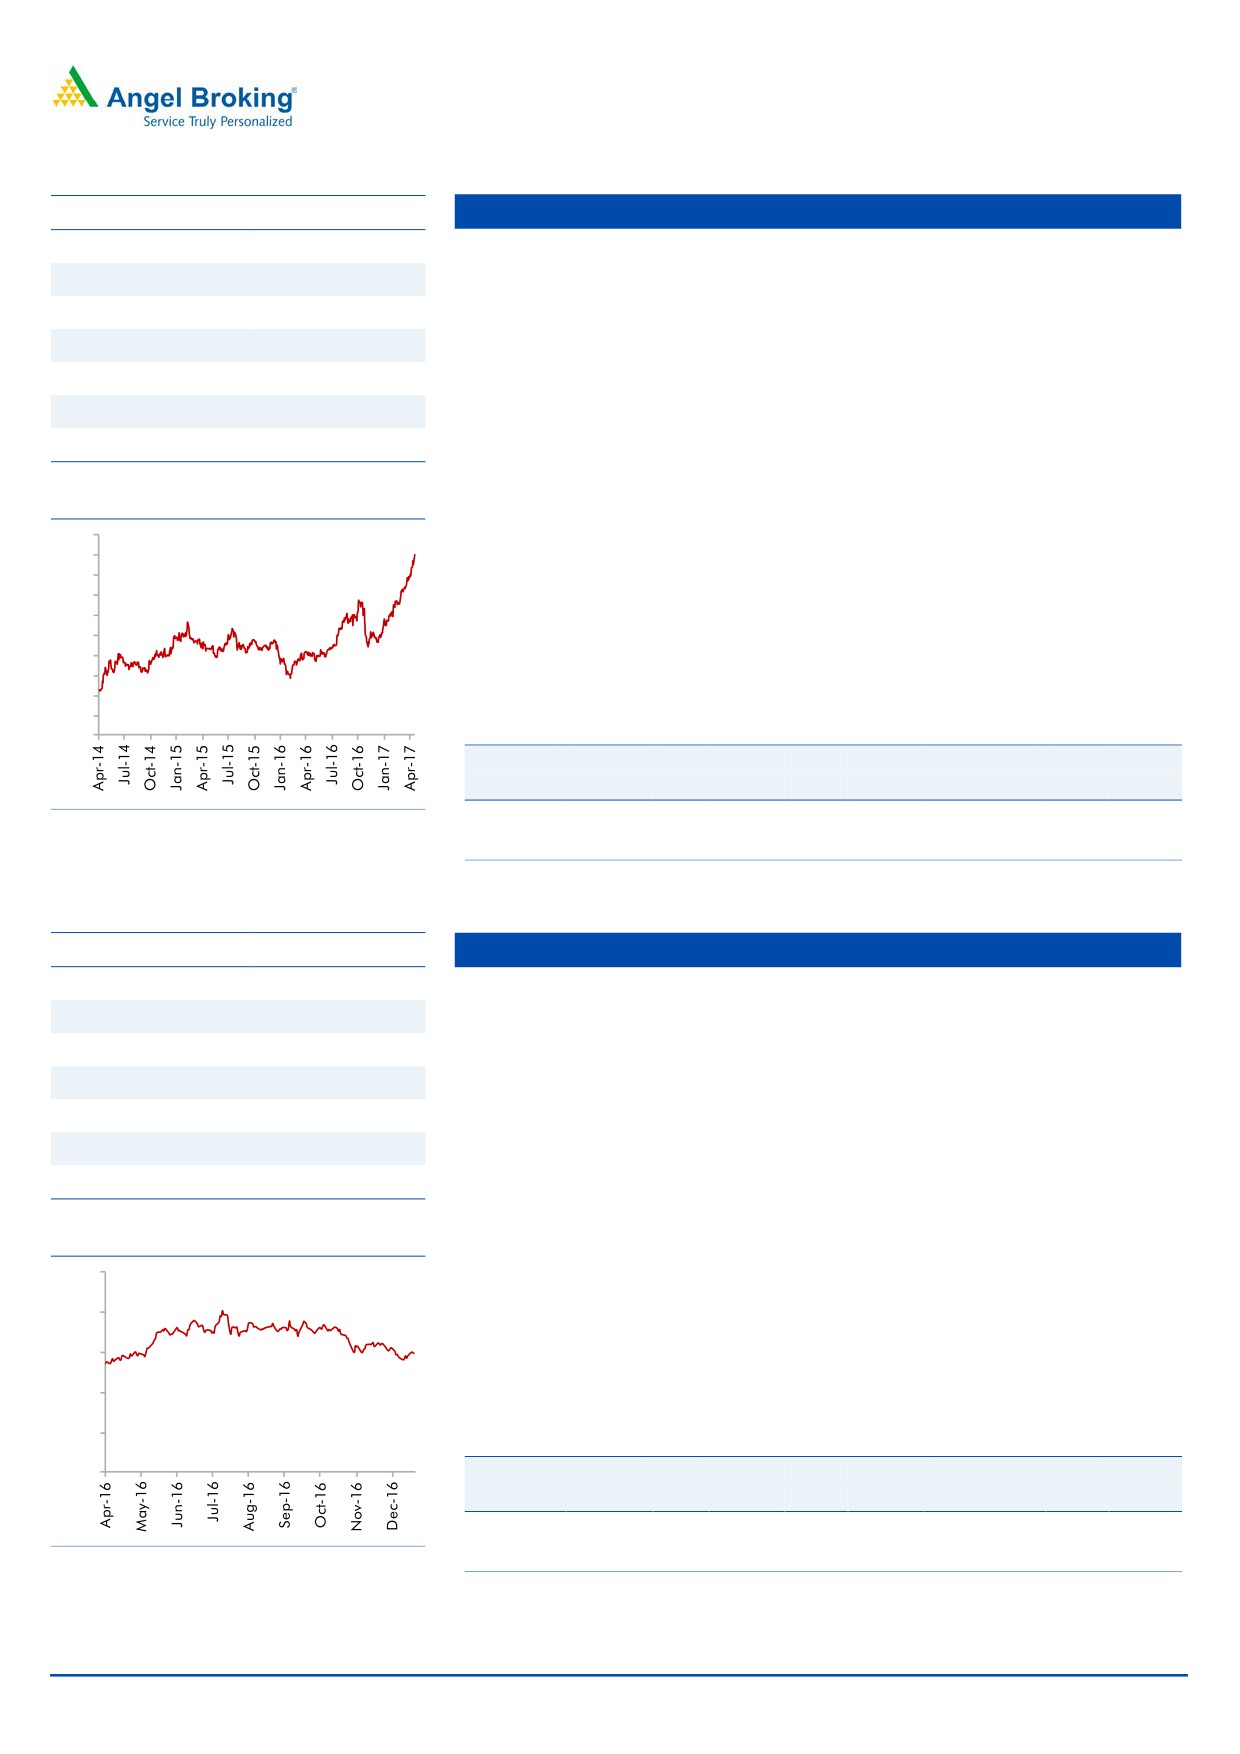
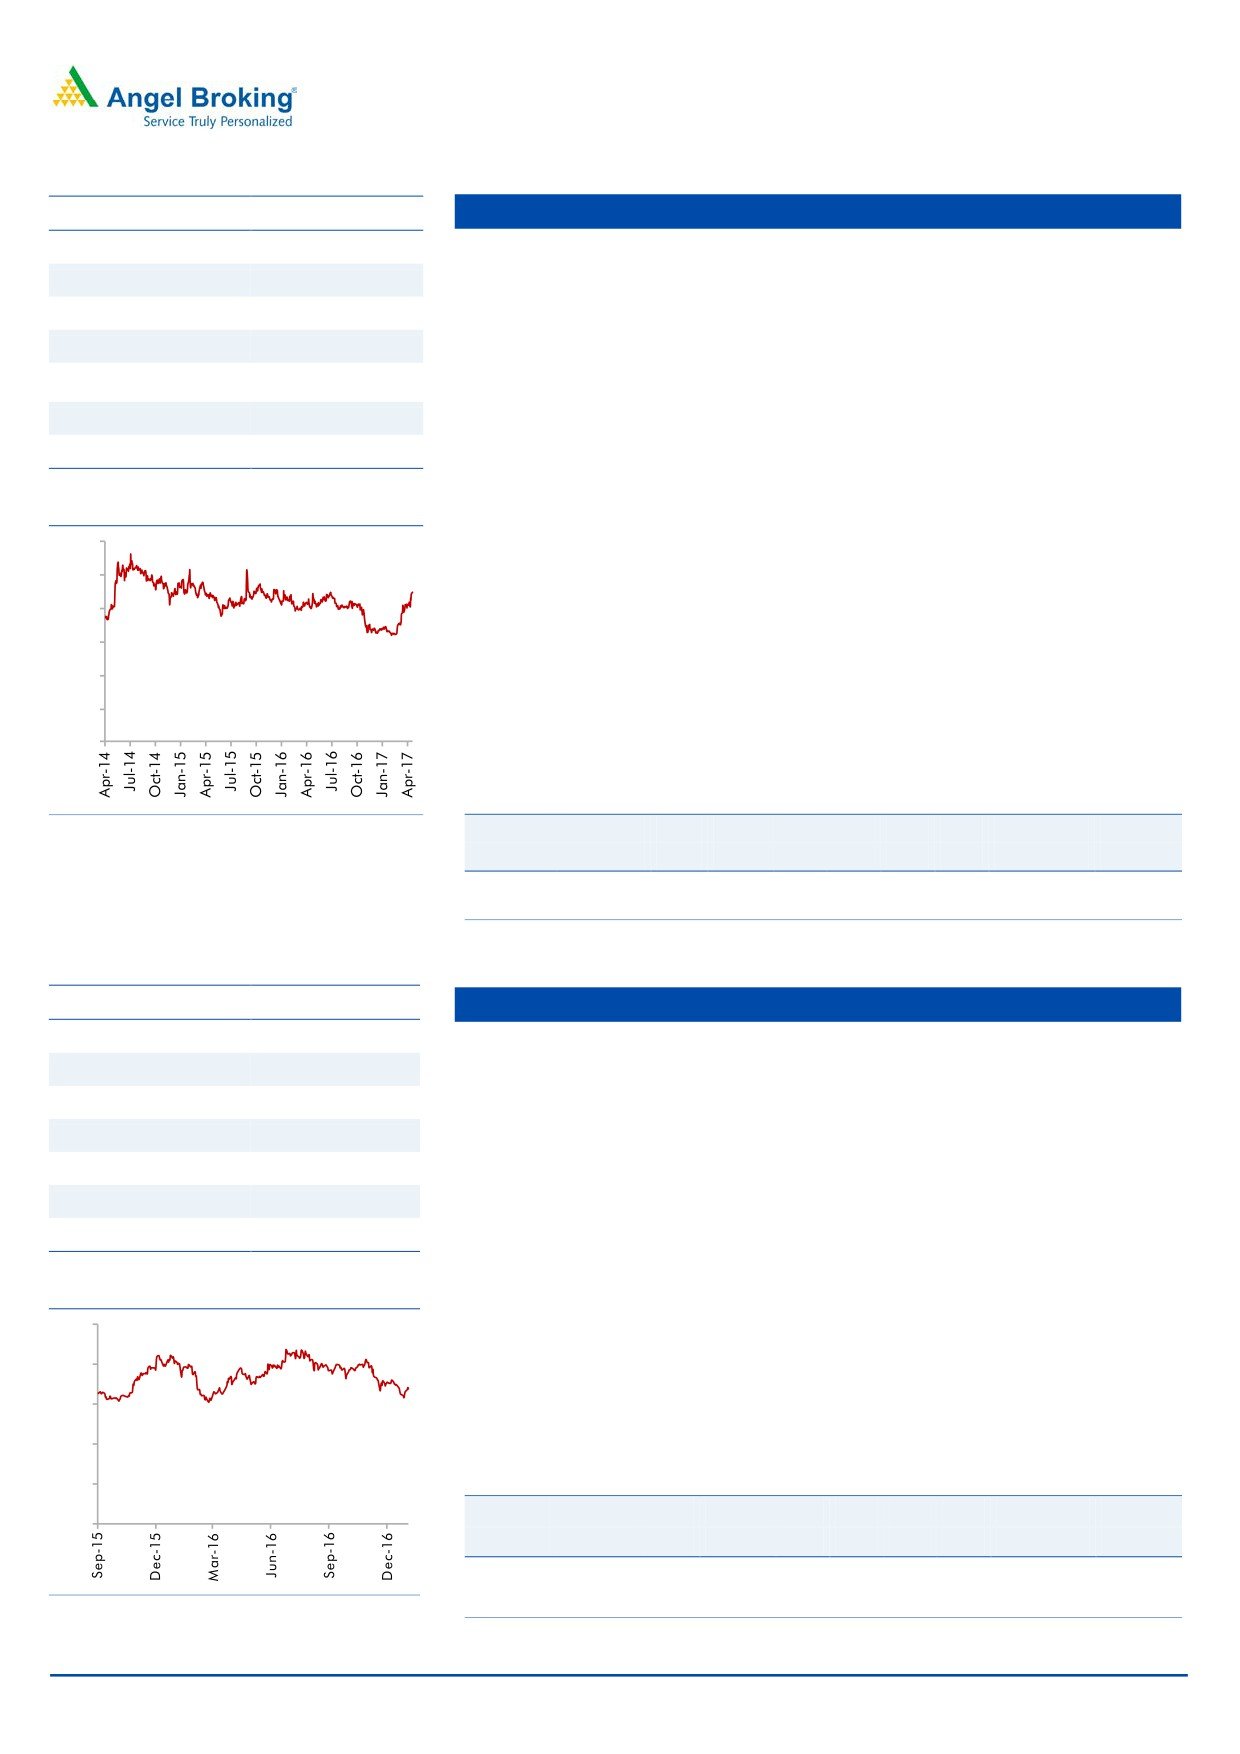
Stock Info
Dewan Housing
CMP
447
3rd largest private sector housing finance company: We expect DHFL’s AUM to
TP
520
grow at a CAGR of 21% over FY2016-18, as demand for housing in the middle
Upside
16%
and low income group picks up, while PAT CAGR is expected to be 23%.
Sector
Financials
Funds received from DHFL Pramerica Life Insurance, gives a boost to growth:
Market Cap (` cr)
14,016
DHFL sold 50% stake held by it in DFHFL Pramerica Life Insurance Co Ltd to
its wholly owned subsidiary for a consideration of `2000.5 cr, which added
Beta
1.9
`1969 cr to its net worth and increases its CAR by 400 bps, which should fuel
52 Week High / Low
455 / 183
growth for next 2-3 years.
Lower cost of funds will help maintain NIM: DHFL has replaced high cost bank
3 year-Chart
loans with the NCDs raised and it will continue to reduce its dependence on
500
banks as its source of funding. This should help it maintain its NIM of 2.9%.
450
400
The recent capital received via stake sale should also aid to the NIM.
350
Outlook: We expect the company to post a healthy loan book CAGR of 21%
300
250
over FY2015-18E, which is likely to translate in earnings CAGR of 23%, over
200
the same period. The stock currently trades at 1.6x FY2018E ABV. We maintain
150
Buy on the stock, with a target price of `520.
100
50
-
Key Financials
Y/E
Op. Inc
NIM
PAT
EPS
ABV
ROA
ROE
P/E
P/ABV
March
(` cr)
(%)
(` cr)
(`)
(`)
(%)
(%)
(x)
(x)
FY2017E
2,050
2.9
923
29.5
189
1.2
16.3
15.3
2.4
Source: Company, Angel Research
FY2018E
2,500
2.9
1,145
36.6
281
1.2
14.8
12.9
1.6
Source: Company, Angel Research
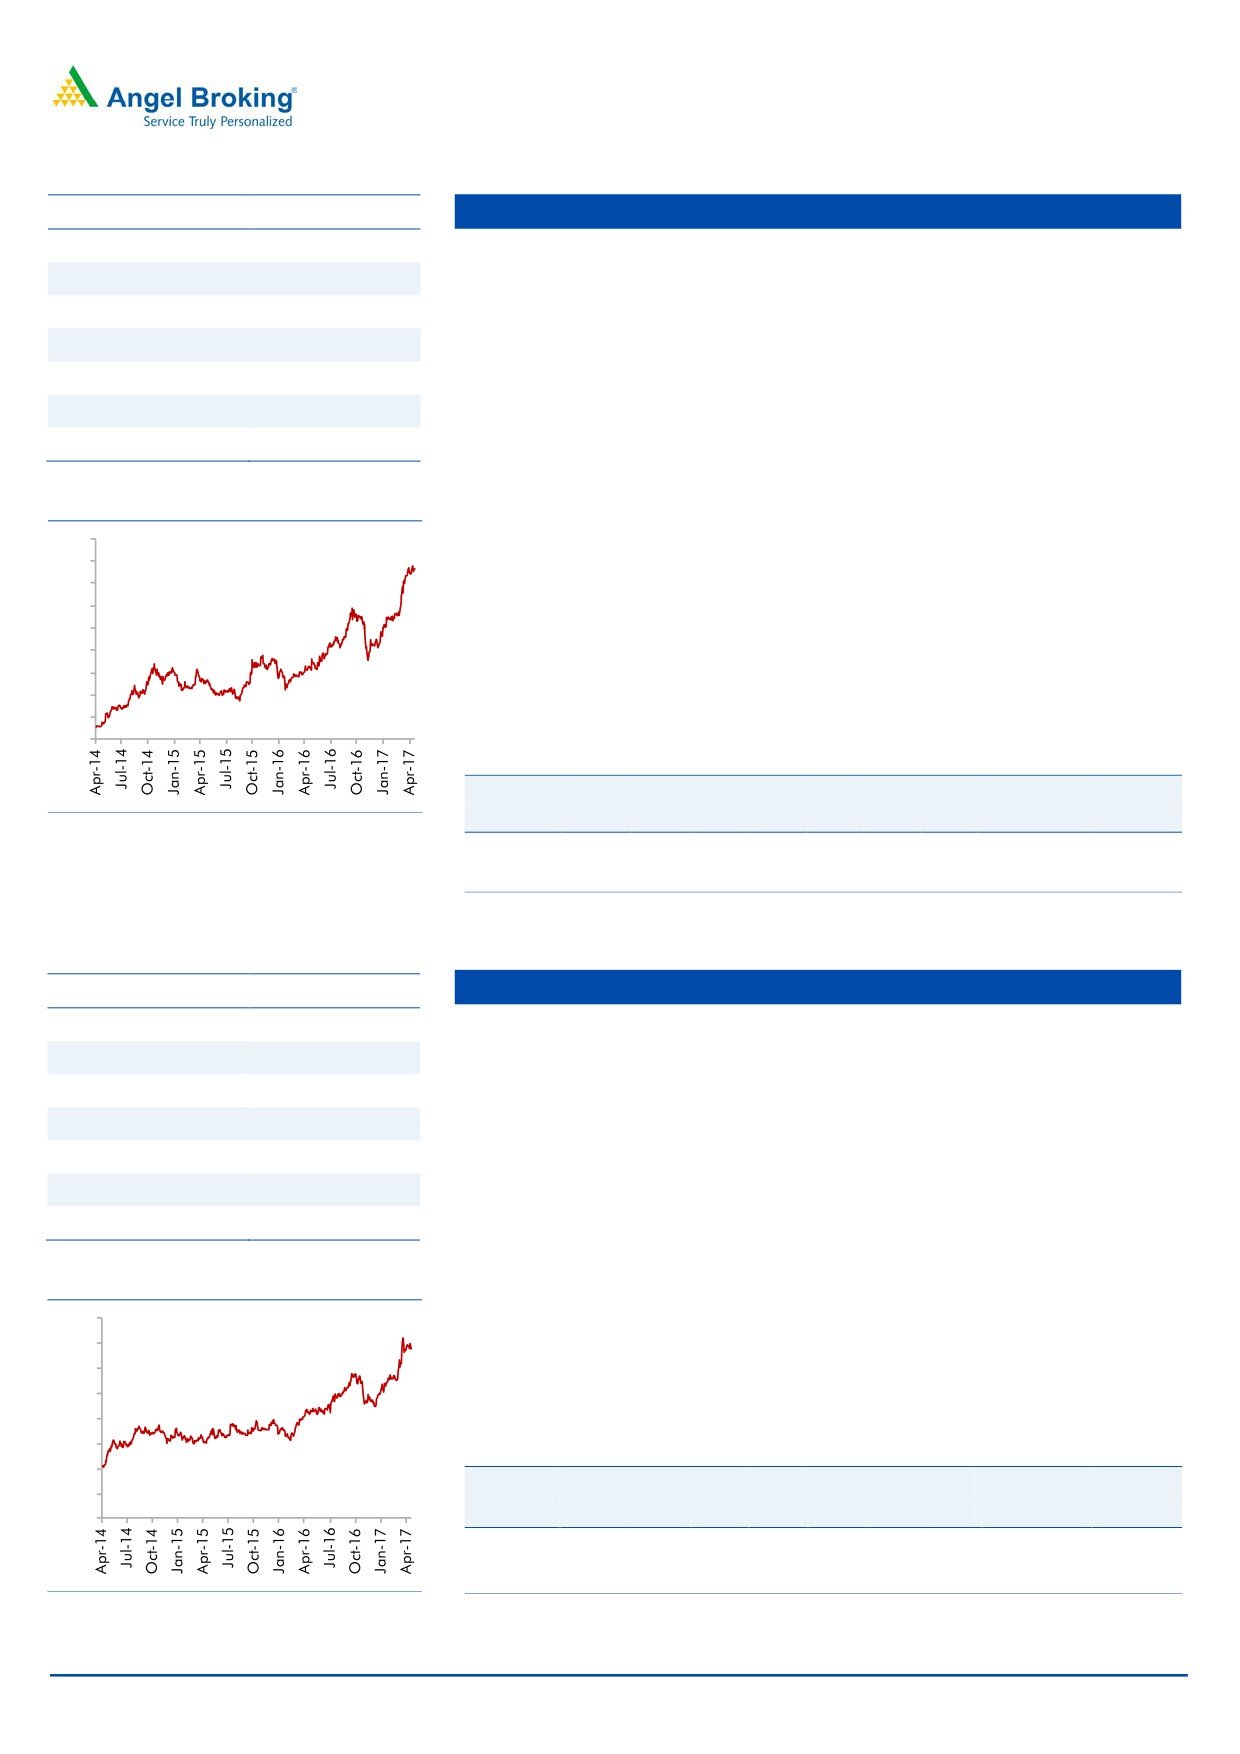
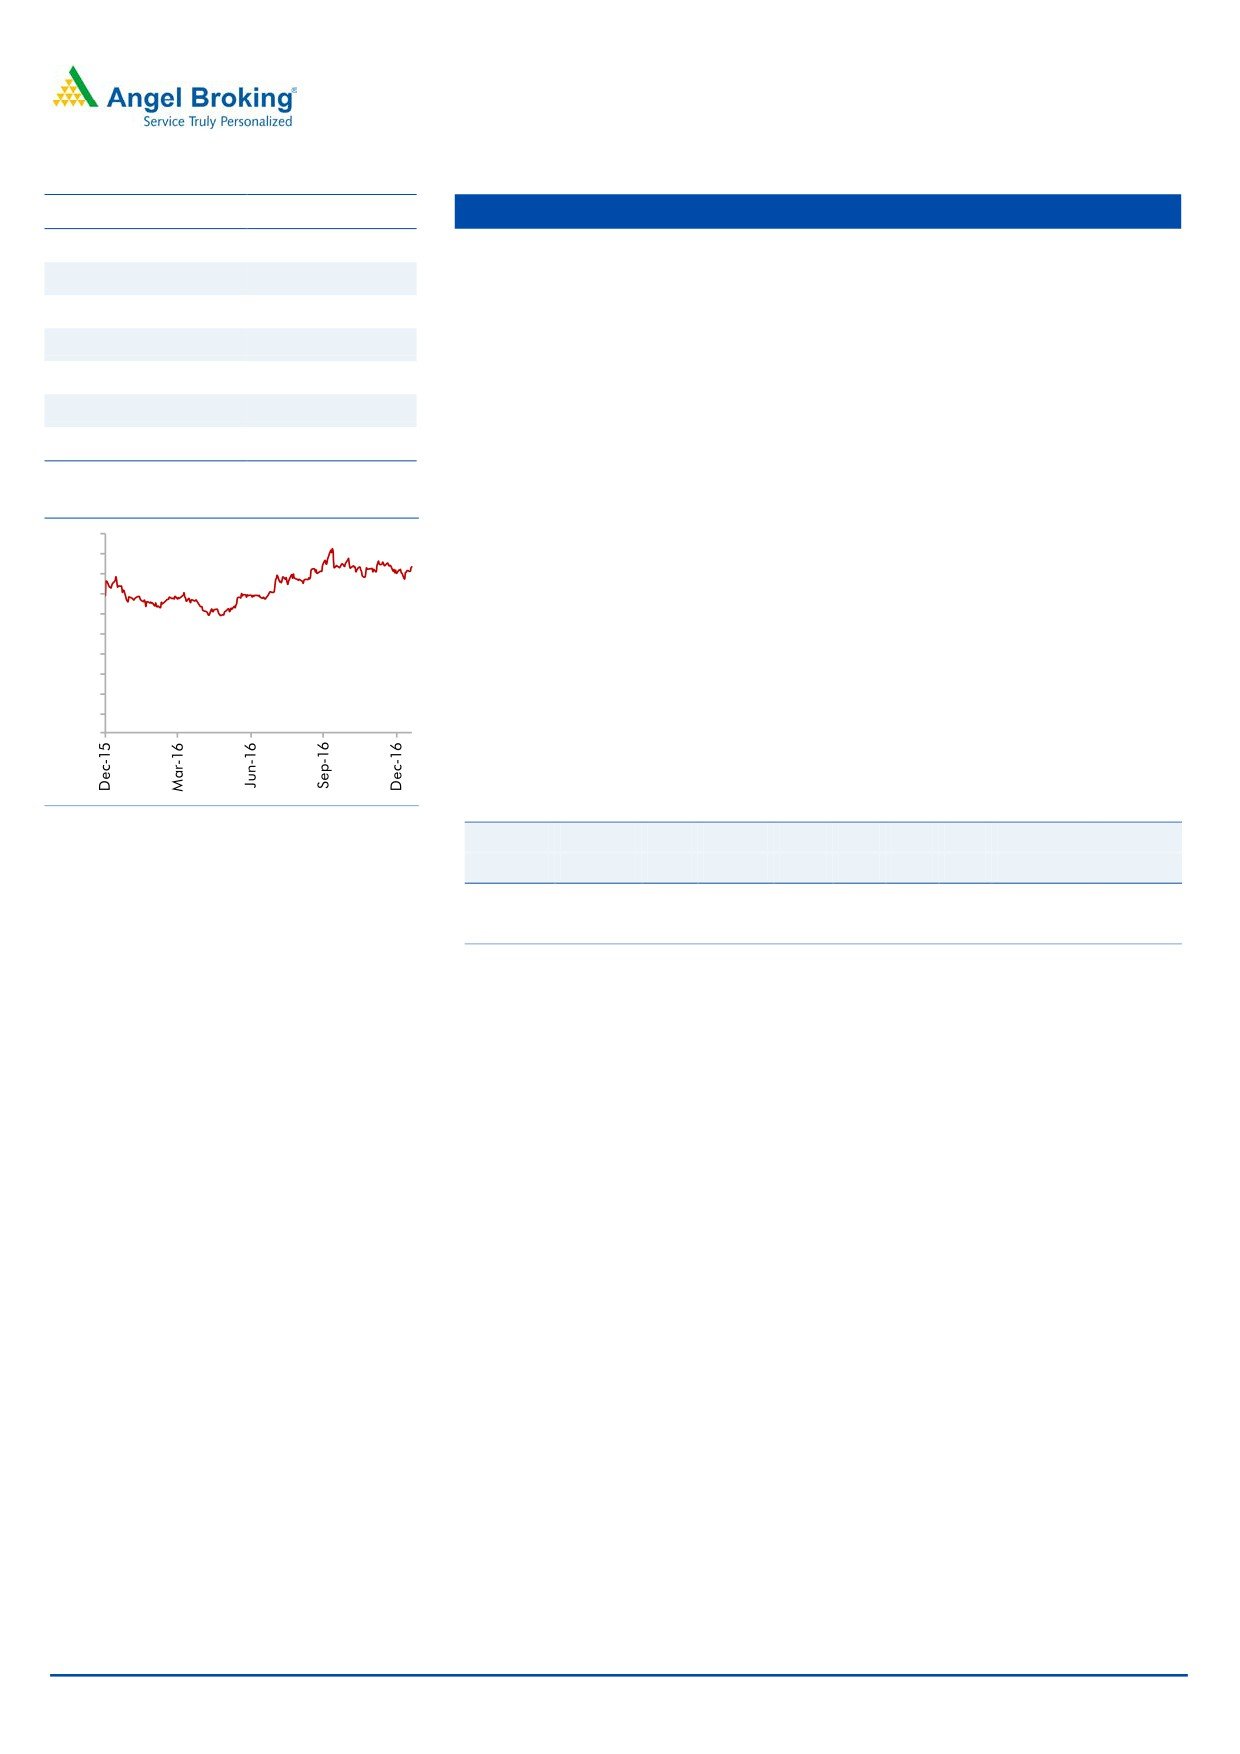
Stock Info
Equitas Holdings
CMP
163
Early mover advantage in the SFB category: Equitas was one of the ten NBFCs
TP
235
to get the license to start a small finance bank (SFB). As the entire book of
Upside
44%
Equitas qualifies for PSL, meeting the 75% PSL target will not be a challenge.
Sector
Financials
The micro finance segment of Equitas has witnessed slowdown in the near
term post demonetization, but should see a bounce back in FY18.
Market Cap (` cr)
5,495
Asset quality and return ratios are likely to remain stable: The recent quarter
Beta
1.4
saw some slowdown due to demonetization, however having converted into
52 Week High / Low
206 / 138
SFB the long term outlook has improved for it. We don’t expect any major
deterioration in the asset quality going ahead.
3 year-Chart
NIM likely to remain healthy: After conversion to SFB the company has started
250
raising deposits at a lower cost vs borrowings leading to better cost of funds.
200
Hence we expect the NIM to remain strong at ~11%, going ahead.
Outlook: We expect the company to post a strong loan book & earnings
150
CAGR of 38% & 37% over FY2016-18E. The stock currently trades at 2.2x
100
FY2018E ABV. We maintain Buy on the stock, with a target price of `235.
50
Key Financials
-
Y/E
Op. Inc
NIM
PAT
EPS
ABV
ROA
ROE
P/E
P/ABV
March
(` cr)
(%)
(` cr)
(`)
(`)
(%)
(%)
(x)
(x)
FY2017E
9,39
11.7
224
5.8
68.2
2.8
10.9
28.8
2.4
FY2018E
1,281
11.5
315
8.2
77.6
2.8
11.5
20.4
2.2
Source: Company, Angel Research
Source: Company, Angel Research
May 3, 2017
3
Top Picks Report | May 2017
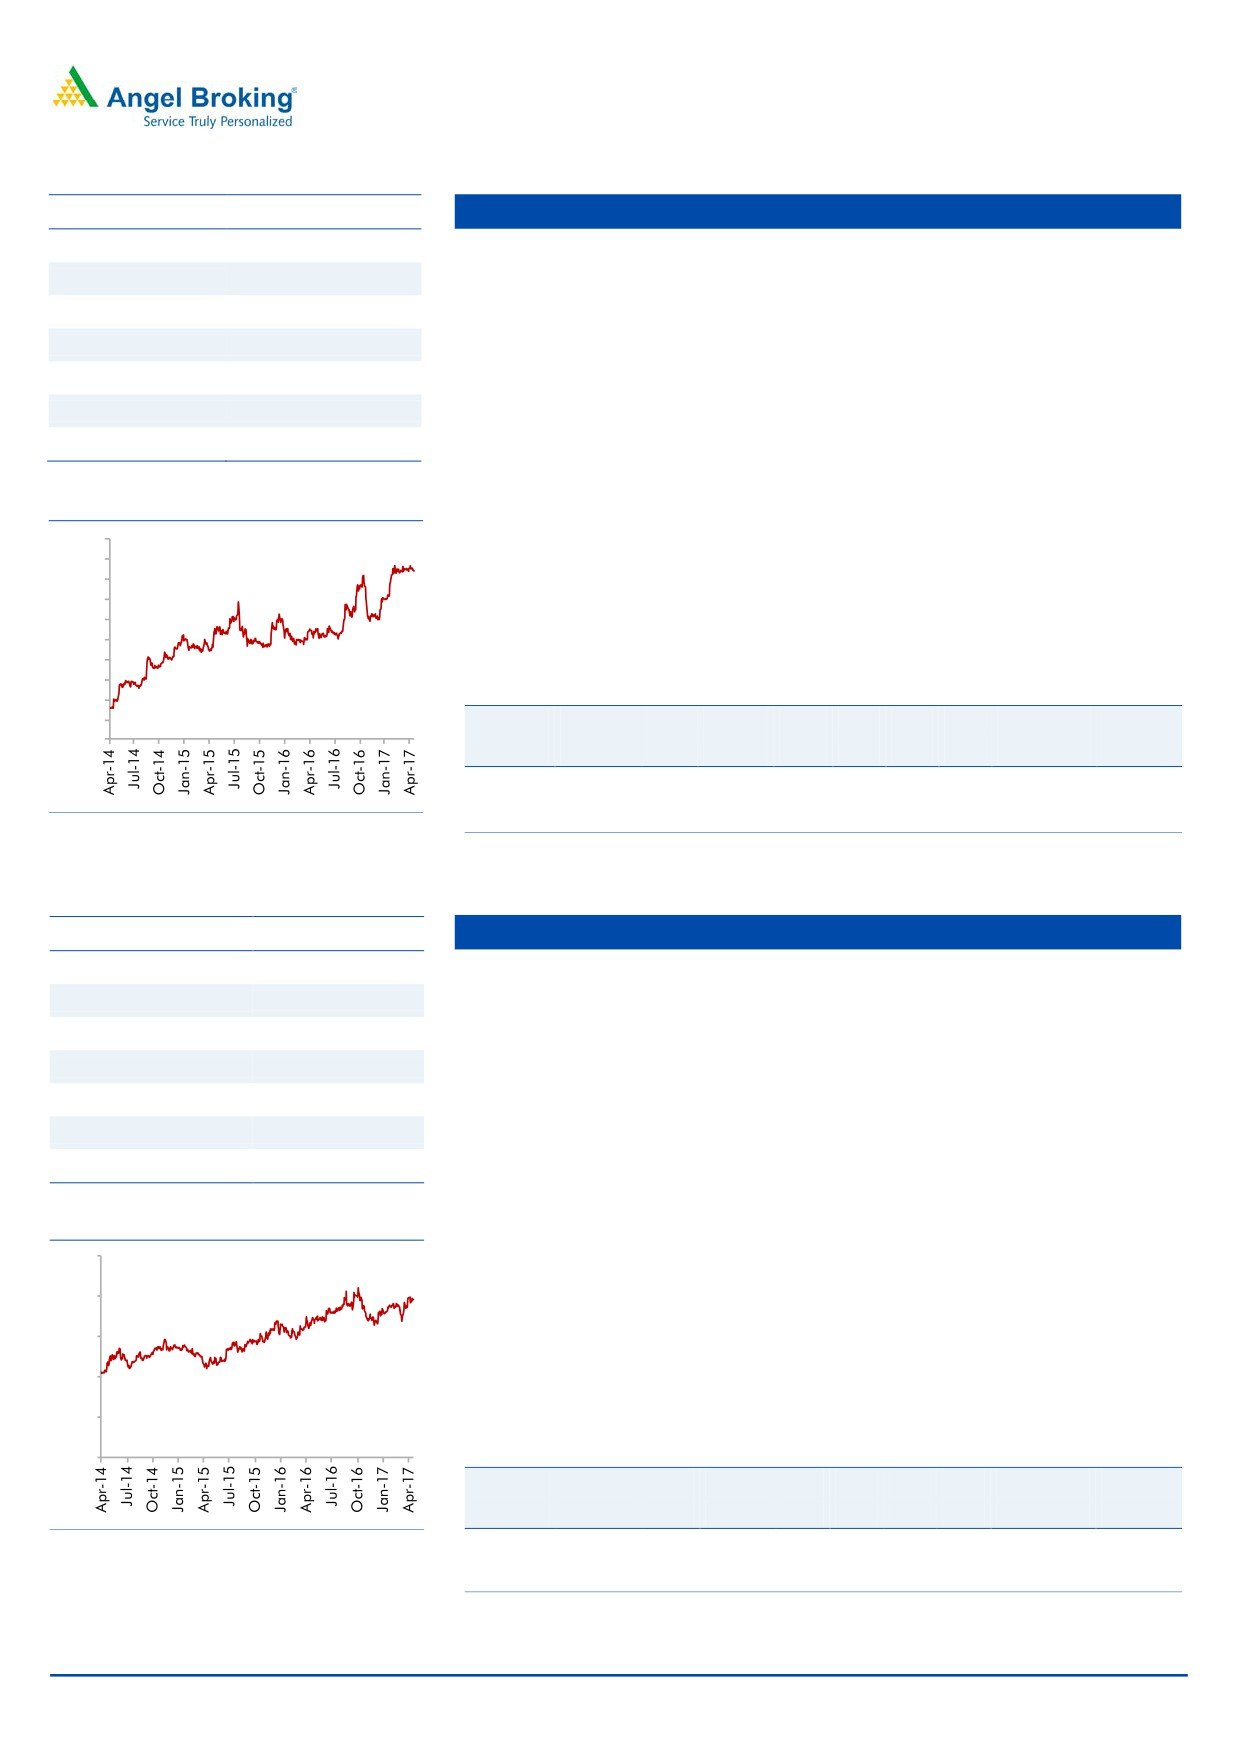
Stock Info
Asian Granito
CMP
384
AGIL’s current, vitrified sales (35%) are lower as compared to its peers like
TP
405
Somany Ceramics (47%) and Kajaria Ceramics (61%). Recently, AGIL has
Upside
5%
launched various products in premium segment. Going forward, we expect
AGIL’s profit margin to improve due to increase in focus for higher vitrified
Sector
Ceramics
product sales, which is a high margin business.
Market Cap (` cr)
1,154
AGIL is continuously putting efforts to increase the B2C sales from the current
Beta
1.7
level (35% in FY16). It is expected to reach up to 50% in next 2-3 years on the
52 Week High / Low
397 / 153
back of various initiatives taken by AGIL to increase direct interaction with customers
like strengthening distribution network, participation in key trade exhibition, etc.
3 year-Chart
In July FY2016, AGIL acquired Artistique Ceramic which has a better margin
450
profile. Going forward, we expect the company to improve its operating
400
margin from 7.5% in FY16 (excluding merger) to
12-12.5% in coming
350
financial year. Artisique Ceramics has a contract with RAS GAS to supply
300
quality natural gas at a discounted rate of 50% to current market rate, which
250
would reduce the overall power & fuel cost of the company.
200
150
We expect AGIL to report a net revenue CAGR of ~8.5% to ~`1,169cr and
100
net profit CAGR of ~39% to `48cr over FY2016-18E. We recommend an
50
Accumulate rating on the stock.
-
Key Financials
Y/E
Sales
OPM
PAT
EPS
ROE
P/E
P/BV
EV/EBITDA
EV/Sales
March
(` cr)
(%)
(` cr)
(`)
(%)
(x)
(x)
(x)
(x)
Source: Company, Angel Research
FY2017E
1,060
12.2
38
12.7
9.5
30.3
2.9
11.1
1.4
FY2018E
1,169
12.5
48
15.9
10.7
24.1
2.6
9.5
1.2
Source: Company, Angel Research
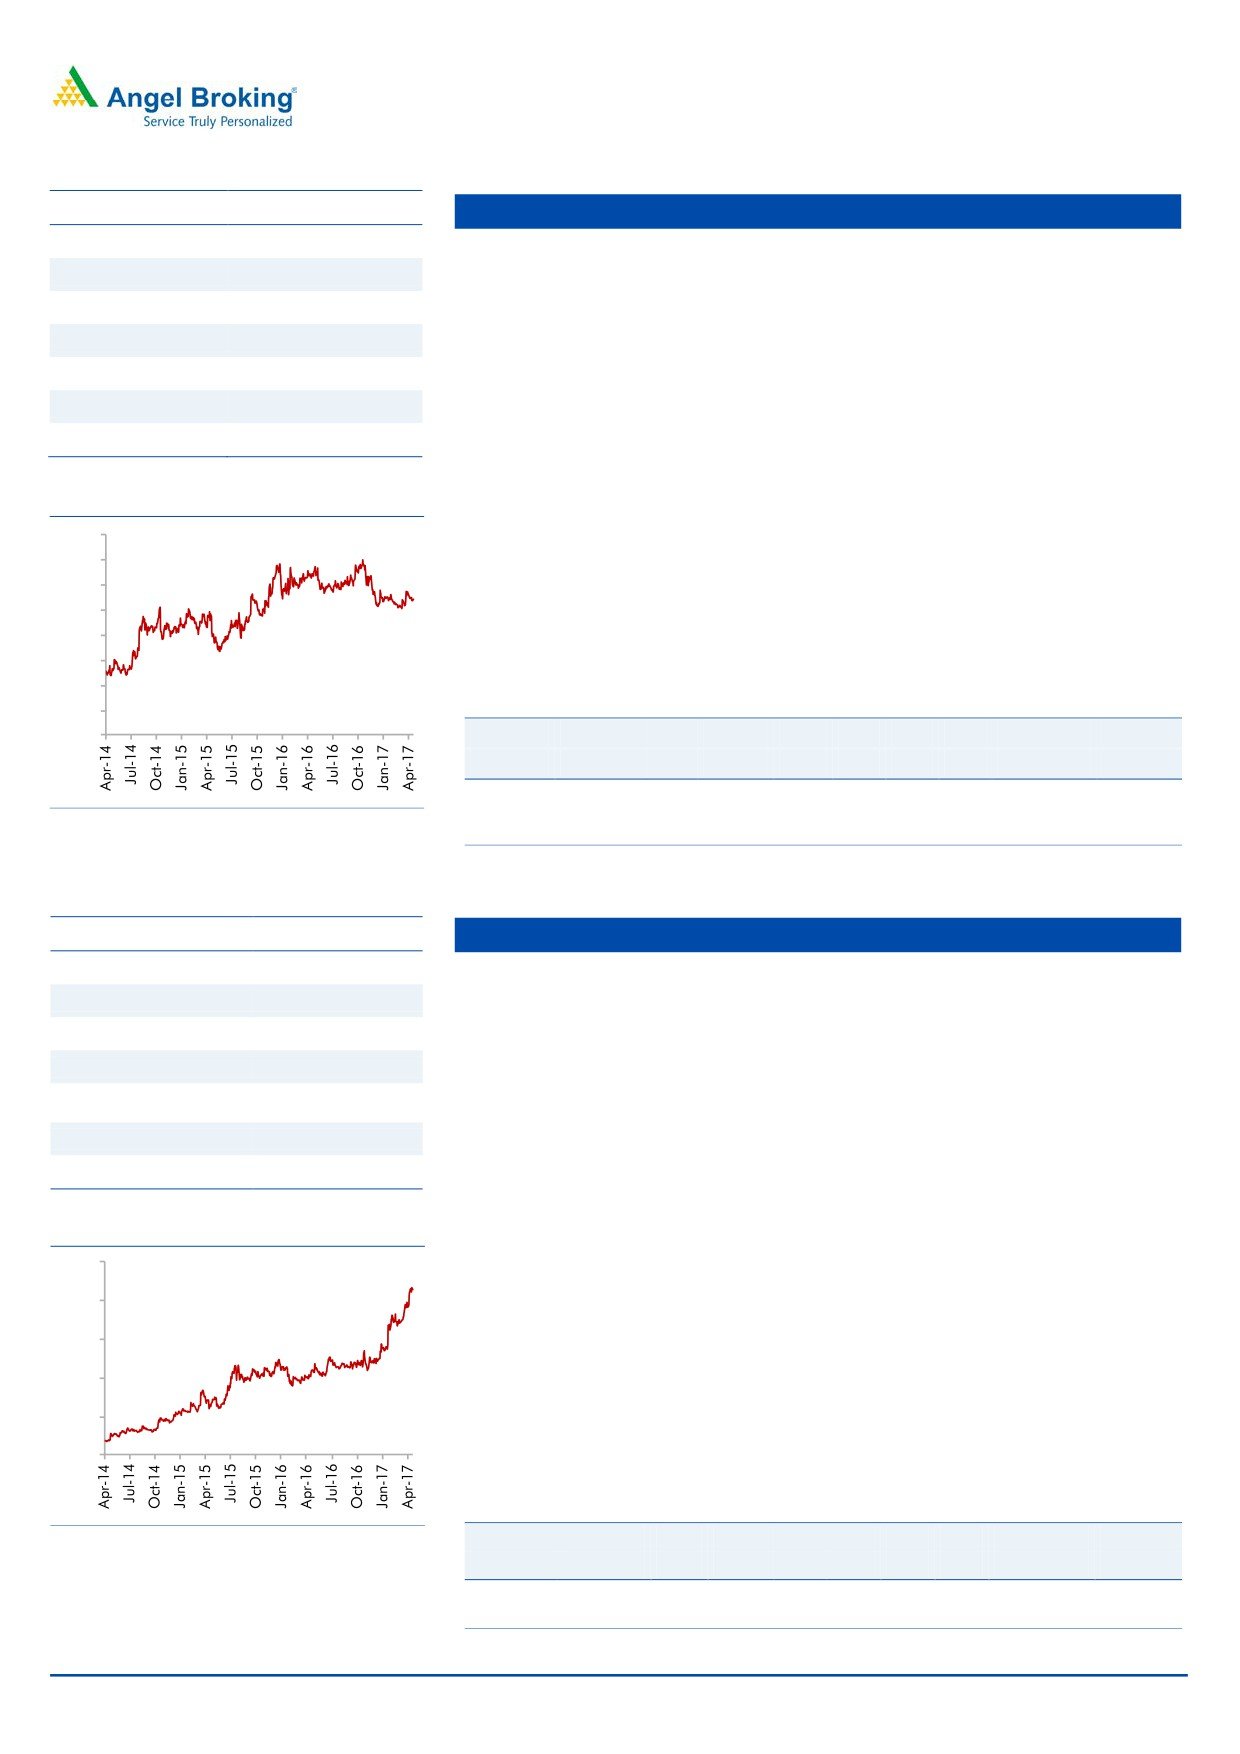
Stock Info
Blue Star
CMP
695
BSL is one of the largest air-conditioning companies in India. With a mere
TP
760
3% penetration level of ACs vs 25% in China, the overall outlook for the room
air-conditioner (RAC) market in India is favourable.
Upside
9%
BSL’s RAC business has been outgrowing the industry by ~10% points over the
Sector
Cons. Durable
last few quarters, resulting in the company consistently increasing its market
Market Cap (` cr)
6,647
share (~7% in FY2014 to 10.5% at present). This has resulted in the Cooling
Beta
0.7
Products Division (CPD)'s share in overall revenues increasing from~23% in
FY2010 to ~42% in FY2016 (expected to improve to ~47% in FY2018E). With
52 Week High / Low
725 / 402
strong brand equity and higher share in split ACs, we expect the CPD to
continue to drive growth.
3 year-Chart
Aided by increasing contribution from the CPD, we expect the overall top-line
800
to post a revenue CAGR of ~16% over FY2016-18E and margins to improve
700
from 5.3% in FY2015 to 7.3% in FY2018E. Moreover, the merger of Blue Star
600
Infotech has infused cash and strengthened the balance sheet. We
500
recommend an Accumulate rating on the stock.
400
300
Key Financials
200
Y/E
Sales
OPM
PAT
EPS
ROE
P/E
P/BV
EV/EBITDA
EV/Sales
100
-
March
(` cr)
(%)
(` cr)
(`)
(%)
(x)
(x)
(x)
(x)
FY2017E
4,283
5.9
141
14.9
20.4
45.3
8.8
28.5
1.6
FY2018E
5,077
7.3
211
22.1
26.4
30.5
7.4
20.5
1.3
Source: Company, Angel Research
Source: Company, Angel Research
May 3, 2017
4
Top Picks Report | May 2017
Stock Info
Siyaram Silk Mills
CMP
1,674
SSML has strong brands which cater to premium as well as popular mass
TP
1,872
segments of the market. Further, SSML entered the ladies' salwar kameez and
Upside
12%
ethnic wear segment. Going forward, we believe that the company would be able to
Sector
Textile
leverage its brand equity and continue to post strong performance.
Market Cap (` cr)
1,569
The company has a nationwide network of about 1,600 dealers and business
partners. It has a retail network of 160 stores and plans to add another
Beta
0.9
300-350 stores going forward. Further, the company's brands are sold across
52 Week High / Low
1,775/994
3,00,000 multi brand outlets in the country.
Going forward, we expect SSML to report a net sales CAGR of ~7% to
3 year-Chart
~`1,948cr and adj.net profit CAGR of ~9% to `103cr over FY2016-18E on
2,000
back of market leadership in blended fabrics, strong brand building, wide
1,800
distribution channel, strong presence in tier II and tier III cities and emphasis
1,600
1,400
on latest designs and affordable pricing points. At the current market price,
1,200
SSML trades at an inexpensive valuation. We have an Accumulate
1,000
recommendation on the stock and target price of `1,872.
800
600
400
Key Financials
200
Y/E
Sales
OPM
PAT
EPS
ROE
P/E
P/BV
EV/EBITDA
EV/Sales
-
March
(` cr)
(%)
(` cr)
(`)
(%)
(x)
(x)
(x)
(x)
FY2017E
1,652
11.6
87
92.4
14.7
18.1
2.7
10.1
1.2
FY2018E
1,857
11.7
103
110.1
15.2
15.2
2.3
8.8
1.0
Source: Company, Angel Research
Source: Company, Angel Research
Stock Info
Jagran Prakashan
CMP
198
We expect JPL to register a net sales CAGR of ~12% over FY2016-18E, on
TP
225
back of (a) strong growth in advertising revenue due to improvement in GDP
Upside
14%
growth, and (b) improvement in circulation revenue owing to combination of
increase in cover price and volume growth.
Sector
Media
Further the acquisition of Radio City would also boost the company's revenue
Market Cap (` cr)
6,458
going ahead. Radio City has ~20 stations across 7 states in the country and is
Beta
0.5
second only to ENIL in all its operating circles, ie Delhi, Mumbai, Bengaluru,
52 Week High / Low
213/157
Chennai, Ahmedabad, Hyderabad, Pune and Lucknow. The company covers
~51% (~66mn people) of the total radio population.
3 year-Chart
Raw material prices have been in a declining trend. Thus, considering lower
250
news print costs, healthy sales, and higher margins in the radio business, we
expect an adj. net profit CAGR of ~12% over FY2016-18E to `409cr.
200
Considering Dainik Jagran's strong presence in the rapidly growing Hindi
150
markets, we expect JPL to benefit from an eventual recovery in the Indian
100
economy. Hence, we maintain an Accumulate rating on the stock with a target
price of `225.
50
-
Key Financials
Y/E
Sales
OPM
PAT
EPS
ROE
P/E
P/BV
EV/EBITDA
EV/Sales
March
(` cr)
(%)
(` cr)
(`)
(%)
(x)
(x)
(x)
(x)
Source: Company, Angel Research
FY2017E
2,355
28.0
353
10.8
21.7
18.3
4.0
9.7
2.8
FY2018E
2,635
28.0
409
12.5
21.7
15.8
3.4
8.4
2.4
Source: Company, Angel Research
May 3, 2017
5
Top Picks Report | May 2017
Stock Info
TV Today Network
CMP
271
TTNL enjoys a strong viewership ranking in the Hindi and English news
TP
344
channel categories. The company’s Hindi news channel - Aaj Tak has
Upside
27%
maintained its market leadership position occupying the No.1 rank for several
Sector
Media
consecutive years in terms of viewership. Its English news channel - India
Today too has been continuously gaining viewership; it has now captured the
Market Cap (` cr)
1,615
No. 2 ranking from No. 4 earlier. Its other channels like Dilli Aaj Tak and Tez
Beta
0.6
are also popular among viewers.
52 Week High / Low
360 /249
Out of the 7 radio stations, TTNL has sold off 4 (Jodhpur, Amritsar, Patiala
and Shimla) for `4cr. The remaining 3 stations are in the process of getting
3 year-Chart
sold off to ENIL but the sale will have to wait until concerns raised by the MIB
400
are resolved. Going forward, we expect them to be sold off and this would
350
prop up the company’s profitability.
300
250
We expect TTNL to report a net revenue CAGR of ~9% to ~`743cr and net
200
profit CAGR of
~7% to
`108cr over FY2016-18E. We have a Buy
150
recommendation on the stock and target price of `344.
100
50
Key Financials
-
Y/E
Sales
OPM
PAT
EPS
ROE
P/E
P/BV
EV/EBITDA
EV/Sales
March
(` cr)
(%)
(` cr)
(`)
(%)
(x)
(x)
(x)
(x)
FY2017E
567
26.7
92
15.4
14.9
17.6
2.6
8.8
2.4
Source: Company, Angel Research
FY2018E
645
27.0
108
18.1
15.2
15.0
2.3
7.3
2.0
Source: Company, Angel Research
Stock Info
KEI Industries
CMP
214
Healthy order book indicates strong revenue visibility: KEI’s current order book
TP
239
(OB) stands at `3,233cr (segmental break-up: `2,154cr in EPC, `667cr in
Upside
12%
Cable, `200cr in EHV, `49cr in Substation, rest in EPC L1 business). Its OB
Sector
Cable
grew by ~28% in the last 3 years due to strong order inflows from State
Electricity Boards, Power grid, etc.
Market Cap (` cr)
1,668
Strengthening distribution network and higher ad Spend to increase B2C
Beta
1.2
business: KEI’s consistent effort to increase its retail business from 30% of
52 Week High / Low
219/ 94
revenue in FY16 to 40-45% of revenue in the next 2-3 years on the back of
strengthening distribution network (currently 926 which is expect to increase
3 year-Chart
`1,500 by FY19) and higher ad spend (increased from `2cr in FY13 to `7cr in
250
FY16 and expected to spend).
200
Exports to continue its growth momentum: KEI’s export (FY16 - 8% of revenue)
150
is expected to reach a level of ~14-15% in next two years with higher order
execution from current OB of
~`180cr and participation in various
100
international tenders worth `500cr. We expect a strong ~26% growth CAGR
50
over FY2016-19 in exports. We expect KEI to report net revenue CAGR of
~14% to ~`3,445cr and net profit CAGR of ~26% to `123cr over FY2016-
-
19E. Hence we have an accumulate rating on the stock.
Key Financials
Source: Company, Angel Research
Y/E
Sales
OPM
PAT
EPS
ROE
P/E
P/BV
EV/EBITDA
EV/Sales
March
(` cr)
(%)
(` cr)
(`)
(%)
(x)
(x)
(x)
(x)
FY2017E
2,682
10.4
91
11.7
20.1
18.3
3.7
6.9
0.8
FY2018E
3,058
10.0
99
12.8
18.2
16.7
3.0
6.4
0.7
Source: Company, Angel Research
May 3, 2017
6
Top Picks Report | May 2017
Stock Info
Mahindra Lifespace
CMP
444
MLF has 13 projects under implementation across cities. MLF has exhibited
TP
522
fast completion of projects compared to others. Sales cycle in ~65% of
Upside
18%
projects is faster than execution cycle, contrary to industry trends. This fast
Sector
Real Estate
execution and sales is optimal, as it helps MLF in revenue recognition,
inventory cycle (better than Oberoi, DLF), cash flows and profitability.
Market Cap (` cr)
1,824
MLF as of 4QFY2016 is pursuing ~4.0mn sq. ft. of sale of the total ~15.0mn
Beta
0.9
sq. ft. of saleable area. Having sold ~60% of ongoing projects, we expect MLF
52 Week High / Low
493 / 319
to launch ~2.8mn sq.ft. of saleable area in rational way during 4QFY2016-
2QFY2018E, across 6 cities. Maturity at existing projects, new launches give better
3 year-Chart
revenue visibility for medium-term. Further, MLF is sitting on land bank of 11.0mn
600
sq.ft across 4 cities, which allay any concern over long-term revenue growth.
500
With Real Estate Regulatory Bill closer to reality, MLF should be minimally
400
impacted, given their strong parentage and ethically implemented processes.
300
In the longer-term organized, professionally run, well funded players would
200
enjoy strong trust due to their reliable and fast execution strategies. With
100
improvement in company’s fundamentals, strong earnings growth visibility
and long-term growth outlook, at current valuations of 1.0x FY2017E P/BV,
-
MLF looks attractive. We maintain Buy on MLF with target price of `522.
Key Financials
Source: Company, Angel Research
Y/E
Sales
OPM
PAT
EPS
ROE
P/E
P/BV
EV/EBITDA
EV/Sales
March
(` cr)
(%)
(` cr)
(`)
(%)
(x)
(x)
(x)
(x)
FY2017E
1,152
22.7
75
29.9
7.6
14.9
1.1
10.4
2.3
FY2018E
1,300
24.6
138
35.8
8.6
12.4
1.0
7.5
1.9
Source: Company, Angel Research
Stock Info
Navkar
CMP
214
NCL is one of the largest and one of the three CFS at JNPT with rail
TP
265
connectivity, helping it garner high market share at the port. NCL is in a massive
Upside
23%
expansion mode where it is increasing its capacity by 234% to 1,036,889 TEUs
Sector
Logistics
at JNPT and coming up with an ICD at Vapi (with Logistics Park).
Market Cap (` cr)
3,054
The ICD with rail link should benefit from first mover advantage in a region
Beta
0.7
that has huge market potential and accounts for ~27% of volumes at JNPT.
52 Week High / Low
225 / 155
The ICD should be able to capture the EXIM volumes from the region through
rail link that till now was being custom cleared at JNPT (Import) or being
transported via road and consolidated at JNPT (Export). South Gujarat
3 year-Chart
volumes will now head straight to the Vapi ICD; thus the company can now
250
cater to bulk commodities and domestic traffic that it had been rejecting owing
200
to capacity constraints at CFS.
150
We expect NCL to successfully use its rail advantage and scale up its
100
utilizations at both JNPT and Vapi ICD. We have a Buy rating on the stock.
50
Key Financials
Y/E
Sales
OPM
PAT
EPS
ROE
P/E
P/BV
EV/EBITDA
EV/Sales
-
March
(` cr)
(%)
(` cr)
(`)
(%)
(x)
(x)
(x)
(x)
FY2017E
369
42.9
99
6.9
7.4
31.0
2.2
17.3
9.3
FY2018E
561
42.3
164
11.5
10.5
18.6
2.0
12.1
6.1
Source: Company, Angel Research
Source: Company, Angel Research
May 3, 2017
7
Top Picks Report | May 2017
Stock Info
Alkem Leboratories
CMP
1,988
Alkem is 5th largest pharma company is the domestic market. It has presence
TP
2,311
in India, US and a few other countries. The 73% of its revenues come from the
Upside
16%
Indian markets while 20% come from the US and rest from the other countries.
Sector
Pharma
The company has leadership position in the anti infective segment in India and
it is ranked as no. 3 in Gastro-Intestinal and Pain/Analgesics segments.
Market Cap (` cr)
24,765
Overall it holds 3.6% market share in the domestic formulations business and
Beta
0.3
7.9% share in overall prescriptions in country.
52 Week High / Low
2,238/ 1,182
In the domestic market, company operates in acute and chronic segments. It is
a prominent player in acute segment but still an entrant in chronic segment. It
3 year-Chart
has aggressively hired sales force in last three years to increase its sales from
2,000
chronic segment. Alkem has a strong track record of growth in the domestic
1,800
1,600
market which is likely to continue. In the US, company is focusing on
1,400
monetization of its ANDA pipeline. As of December 2016, company has a
1,200
pipeline of 77 ANDAs of which 35 are approved. Company expects to launch
1,000
800
~7-8 ANDAs each year and improve its filing rate as well. Overall US
600
revenues are expected to grow at ~28% growth rate from FY17E-FY19E.
400
Company received EIR for its Ankaleshwar API plant in March-17.
200
-
Overall outlook remains strong with 18.2% CAGR in the topline and 23.4%
CAGR in the bottom-line. We have Buy rating on the stock.
Key Financials
Source: Company, Angel Research
Y/E
Sales
OPM
PAT
EPS
ROE
P/E
P/BV
EV/EBITDA
EV/Sales
March
(` cr)
(%)
(` cr)
(`)
(%)
(x)
(x)
(x)
(x)
FY2018E
7,009
20.0
1,099
92.0
21.6
21.6
4.7
16.7
3.3
FY2019E
8,252
20.0
1,285
107.5
21.4
18.5
4.0
14.2
2.8
Source: Company, Angel Research
May 3, 2017
8
Top Picks Report | May 2017
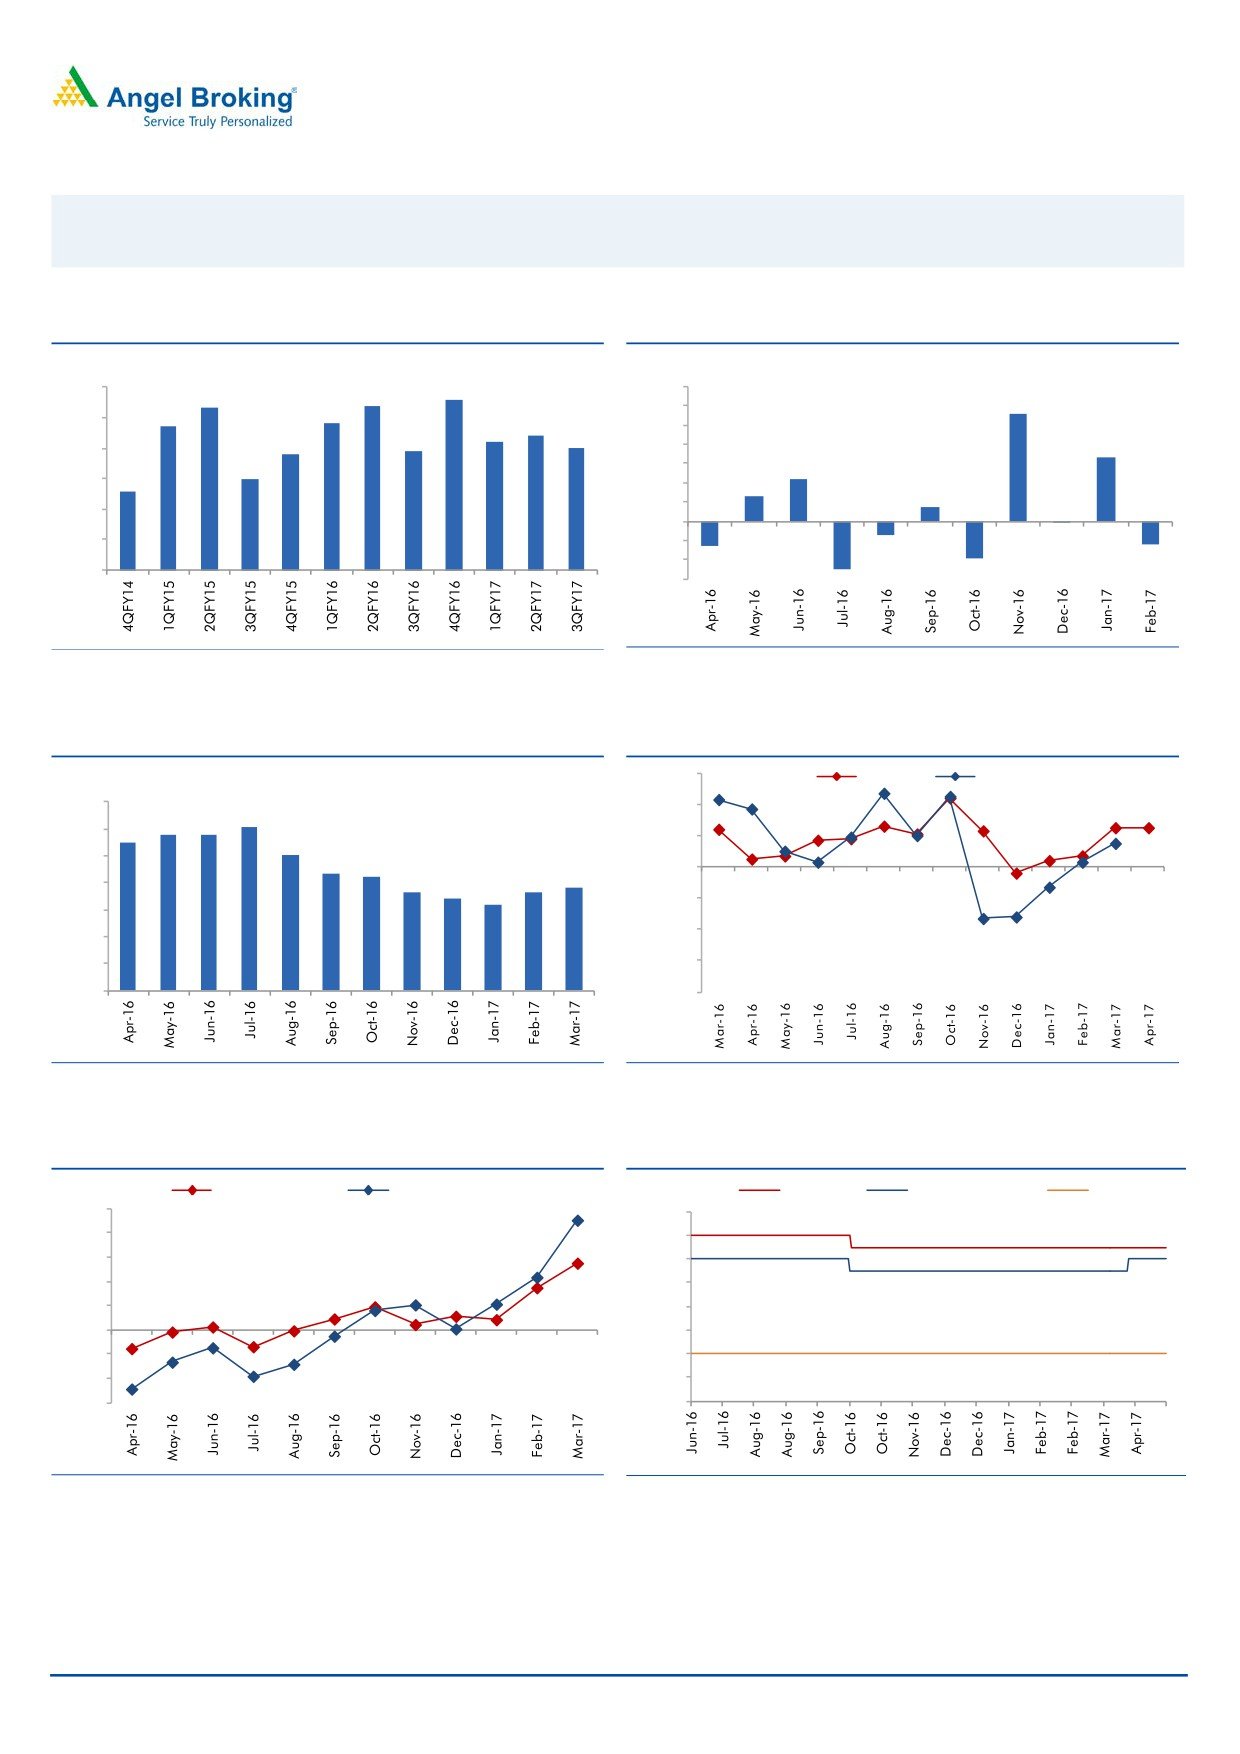
Macro watch
Exhibit 1: Quarterly GDP trends
Exhibit 2: IIP trends
(%)
(%)
9.0
8.6
7.0
8.3
8.4
5.6
7.7
7.8
6.0
8.0
7.4
7.2
7.0
5.0
6.8
6.9
4.0
3.3
7.0
6.0
3.0
2.2
6.0
5.6
1.3
2.0
0.7
1.0
5.0
-
4.0
(1.0)
(0.1)
(0.7)
(2.0)
(1.3)
(1.2)
3.0
(3.0)
(1.9)
(2.5)
Source: CSO, Angel Research
Source: MOSPI, Angel Research
Exhibit 3: Monthly CPI inflation trends
Exhibit 4: Manufacturing and services PMI
56.0
Mfg. PMI
Services PMI
(%)
7.0
54.0
6.1
5.8
5.8
6.0
5.5
5.1
52.0
5.0
4.3
4.2
3.8
50.0
3.6
3.7
4.0
3.4
3.2
48.0
3.0
46.0
2.0
1.0
44.0
-
42.0
Source: MOSPI, Angel Research
Source: Market, Angel Research; Note: Level above 50 indicates expansion
Exhibit 5: Exports and imports growth trends
Exhibit 6: Key policy rates
(%)
Exports yoy growth
Imports yoy growth
(%)
Repo rate
Reverse Repo rate
CRR
50.0
7.00
40.0
6.50
30.0
6.00
20.0
5.50
10.0
5.00
0.0
4.50
(10.0)
4.00
(20.0)
3.50
(30.0)
3.00
Source: Bloomberg, Angel Research
Source: RBI, Angel Research
May 3, 2017
9
Top Picks Report | May 2017
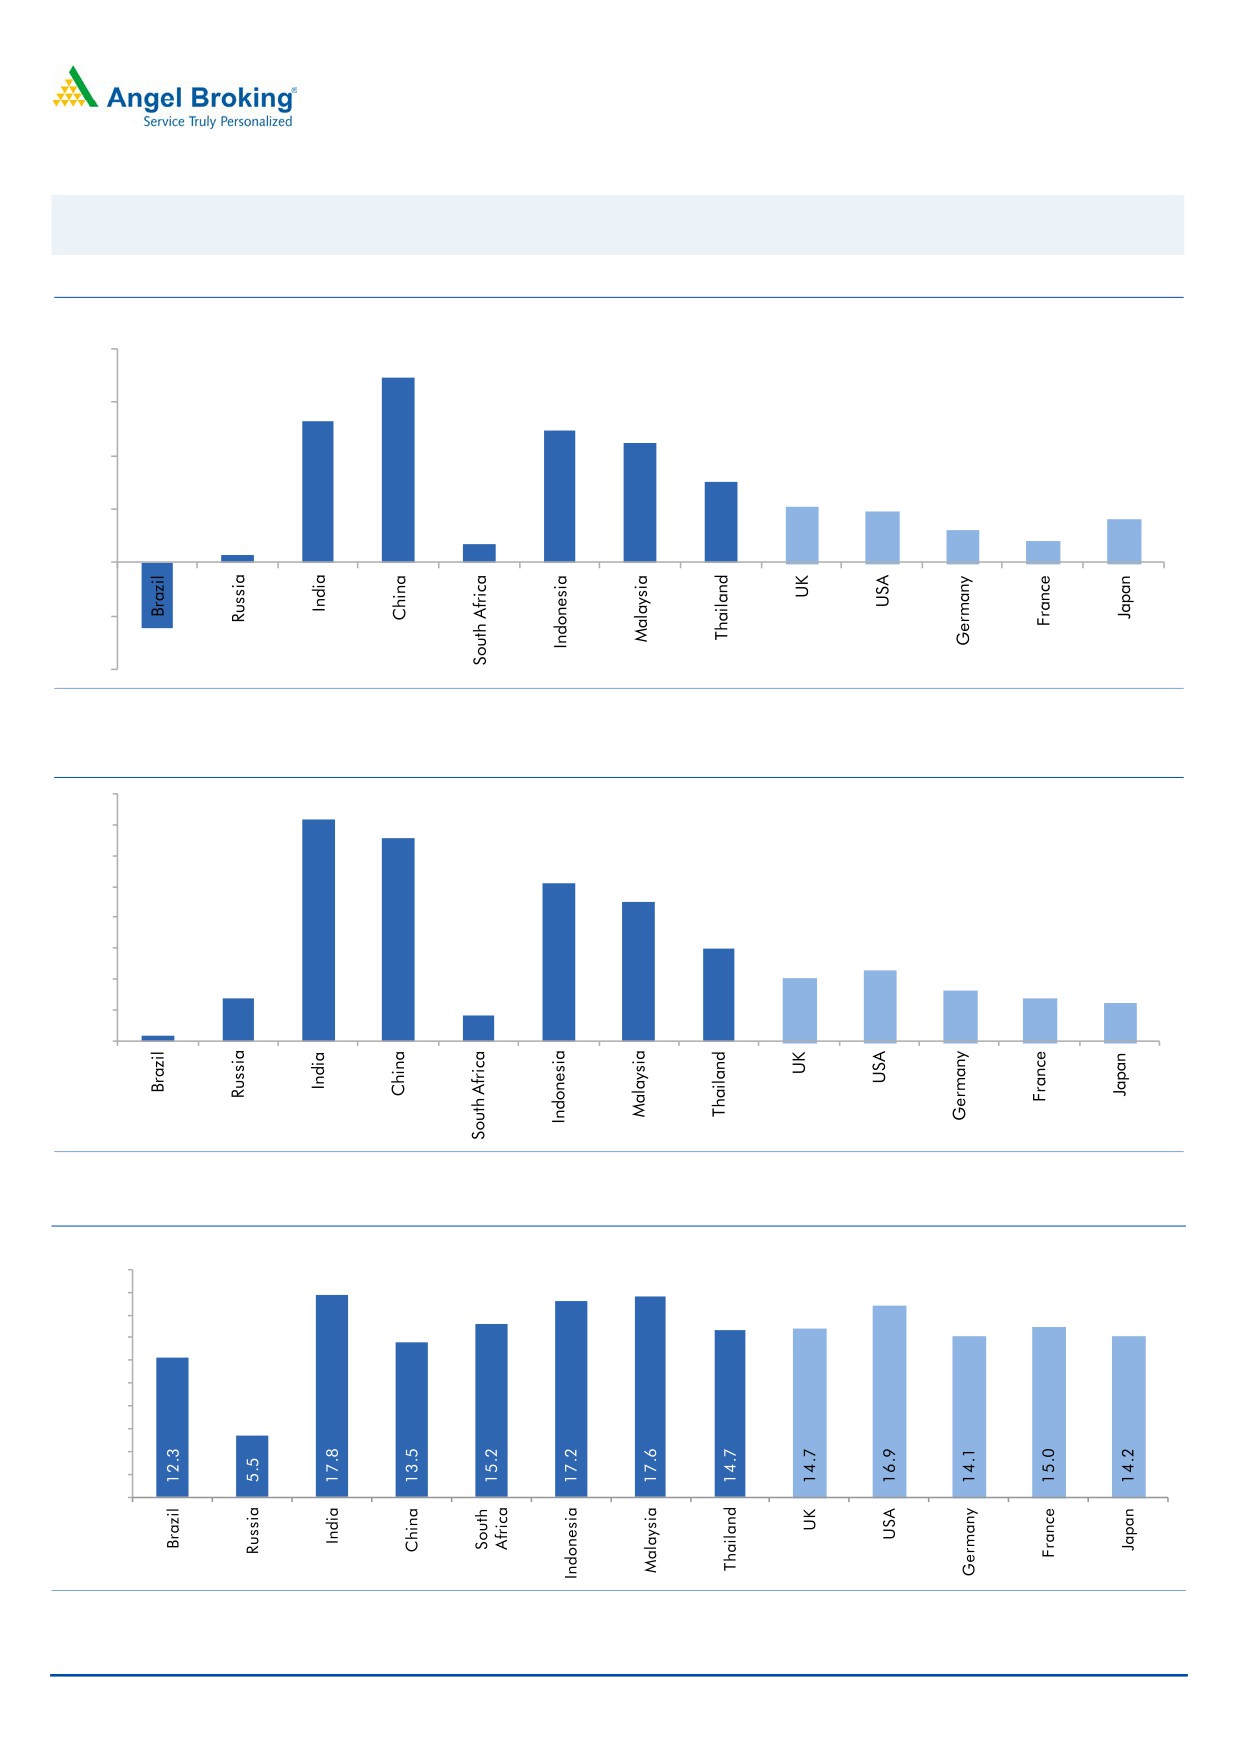
Global watch
Exhibit 8: Latest quarterly GDP Growth (%, yoy) across select developing and developed countries
(%)
8.0
6.9
6.0
5.3
4.9
0.7
4.5
4.0
3.0
2.1
1.9
2.0
0.3
1.6
1.2
0.8
-
(2.0)
(2.5)
(4.0)
Source: Bloomberg, Angel Research
Exhibit 9: 2017 GDP Growth projection by IMF (%, yoy) across select developing and developed countries
(%)
7.2
6.6
7.0
6.0
5.1
5.0
4.5
4.0
3.0
3.0
2.3
2.0
1.4
1.6
2.0
1.4
1.2
0.2
0.8
1.0
-
Source: IMF, Angel Research
Exhibit 10: One year forward P-E ratio across select developing and developed countries
(x)
20.0
18.0
16.0
14.0
12.0
10.0
8.0
6.0
4.0
2.0
-
Source: IMF, Angel Research
May 3, 2017
10
Top Picks Report | May 2017
Exhibit 11: Relative performance of indices across globe
Returns (%)
Country
Name of index
Closing price
1M
3M
1YR
Brazil
Bovespa
66,722
3.2
1.3
22.8
Russia
Micex
2,027
0.2
(10.6)
6.3
India
Nifty
9,314
2.3
9.9
16.7
China
Shanghai Composite
3,144
(3.1)
0.1
5.7
South Africa
Top 40
47,139
5.5
1.7
0.9
Mexico
Mexbol
49,589
0.5
2.7
8.6
Indonesia
LQ45
941
2.3
6.4
10.6
Malaysia
KLCI
1,778
1.7
5.1
3.7
Thailand
SET 50
993
(0.3)
0.2
10.0
USA
Dow Jones
20,950
1.1
4.9
18.0
UK
FTSE
7,250
(1.3)
0.9
18.6
Japan
Nikkei
19,446
2.8
2.1
10.7
Germany
DAX
12,508
3.0
5.9
26.7
France
CAC
5,304
5.1
9.6
22.3
Source: Bloomberg, Angel Research
May 3, 2017
11
Top Picks Report | May 2017
Stock Watch
May 3, 2017
12
Top Picks Report
May 03, 2017
Company Name
Reco
CMP
Target
Mkt Cap
Sales ( Čcr )
OPM(%)
EPS (Č)
PER(x)
P/BV(x)
RoE(%)
EV/Sales(x)
(Č)
Price ( Č)
( Č cr )
FY17E
FY18E
FY17E
FY18E
FY17E
FY18E
FY17E
FY18E
FY17E
FY18E
FY17E
FY18E
FY17E
FY18E
Agri / Agri Chemical
Rallis
Neutral
239
-
4,650
1,937
2,164
13.3
14.3
9.0
11.0
26.6
21.7
4.6
4.0
18.4
19.8
2.4
2.1
United Phosphorus
Neutral
805
-
40,894
15,176
17,604
18.5
18.5
37.4
44.6
21.5
18.1
4.2
3.5
21.4
21.2
2.8
2.4
Auto & Auto Ancillary
Amara Raja Batteries
Accumulate
890
1,009
15,207
5,305
6,100
16.0
16.3
28.4
34.0
31.4
26.2
6.1
5.1
19.3
19.3
2.9
2.5
Apollo Tyres
Neutral
251
-
12,759
12,877
14,504
14.3
13.9
21.4
23.0
11.7
10.9
1.8
1.6
16.4
15.2
1.2
1.1
Ashok Leyland
Buy
84
111
23,792
20,021
21,915
11.6
11.9
4.5
5.3
18.6
15.7
3.8
3.4
20.6
21.5
1.1
1.0
Bajaj Auto
Neutral
2,905
-
84,060
25,093
27,891
19.5
19.2
143.9
162.5
20.2
17.9
5.7
4.9
30.3
29.4
3.1
2.7
Bharat Forge
Neutral
1,160
-
27,004
7,726
8,713
20.5
21.2
35.3
42.7
32.9
27.2
6.1
5.5
18.9
20.1
3.6
3.1
Ceat
Neutral
1,588
-
6,425
7,524
8,624
13.0
12.7
131.1
144.3
12.1
11.0
2.2
1.9
19.8
18.6
0.9
0.8
Eicher Motors
Neutral
25,791
-
70,177
16,583
20,447
17.5
18.0
598.0
745.2
43.1
34.6
14.7
11.2
41.2
38.3
4.1
3.2
Exide Industries
Neutral
231
-
19,614
7,439
8,307
15.0
15.0
8.1
9.3
28.5
24.8
4.0
3.6
14.3
16.7
2.3
2.0
Gabriel India
Accumulate
124
130
1,778
1,544
1,715
9.0
9.3
5.4
6.3
22.9
19.7
4.3
3.8
18.9
19.5
1.1
1.0
Hero Motocorp
Neutral
3,351
-
66,918
28,083
30,096
15.3
15.7
171.8
187.0
19.5
17.9
6.8
5.7
30.1
27.9
2.2
2.0
Indag Rubber
Neutral
216
-
566
286
326
19.8
16.8
11.7
13.3
18.5
16.2
3.1
2.9
17.8
17.1
1.6
1.4
Jamna Auto Industries Neutral
241
-
1,924
1,486
1,620
9.8
9.9
15.0
17.2
16.1
14.0
3.5
3.0
21.8
21.3
1.4
1.2
JK Tyres
Neutral
170
-
3,860
7,455
8,056
15.0
15.0
21.8
24.5
7.8
7.0
1.6
1.3
22.8
21.3
0.6
0.6
L G Balakrishnan & Bros Neutral
638
-
1,001
1,302
1,432
11.6
11.9
43.7
53.0
14.6
12.0
2.1
1.9
13.8
14.2
0.9
0.8
Mahindra and Mahindra Neutral
1,341
-
83,288
46,534
53,077
11.6
11.7
67.3
78.1
19.9
17.2
3.2
2.8
15.4
15.8
1.8
1.5
Maruti
Neutral
6,706
-
202,564
67,822
83,288
16.0
16.4
253.8
312.4
26.4
21.5
6.1
4.9
23.0
22.9
2.7
2.1
Minda Industries
Neutral
497
-
4,295
2,728
3,042
9.0
9.1
68.2
86.2
7.3
5.8
1.7
1.3
23.8
24.3
1.6
1.4
Motherson Sumi
Neutral
401
-
56,255
45,896
53,687
7.8
8.3
13.0
16.1
30.7
24.9
9.9
7.9
34.7
35.4
1.3
1.1
Rane Brake Lining
Neutral
992
-
785
511
562
11.3
11.5
28.1
30.9
35.3
32.1
5.4
4.9
15.3
15.0
1.7
1.5
Setco Automotive
Neutral
42
-
560
741
837
13.0
13.0
15.2
17.0
2.8
2.5
0.5
0.4
15.8
16.3
1.1
1.0
Subros
Neutral
232
-
1,391
1,488
1,681
11.7
11.9
6.4
7.2
36.2
32.3
3.8
3.5
10.8
11.4
1.2
1.0
Swaraj Engines
Neutral
1,838
-
2,283
660
810
15.2
16.4
54.5
72.8
33.7
25.3
10.5
9.5
31.5
39.2
3.3
2.6
Tata Motors
Neutral
452
-
130,407
300,209
338,549
8.9
8.4
42.7
54.3
10.6
8.3
1.7
1.4
15.6
17.2
0.6
0.5
TVS Motor
Neutral
495
-
23,503
13,390
15,948
6.9
7.1
12.8
16.5
38.8
29.9
9.6
7.6
26.3
27.2
1.8
1.5
Capital Goods
ACE
Neutral
65
-
640
709
814
4.1
4.6
1.4
2.1
46.2
30.8
1.9
1.8
4.4
6.0
1.1
0.9
BEML
Neutral
1,390
-
5,787
3,451
4,055
6.3
9.2
31.4
57.9
44.3
24.0
2.7
2.4
6.3
10.9
1.8
1.5
BGR Energy
Neutral
161
-
1,158
16,567
33,848
6.0
5.6
7.8
5.9
20.6
27.2
1.2
1.1
4.7
4.2
0.2
0.1
Top Picks Report
May 03, 2017
Company Name
Reco
CMP
Target
Mkt Cap
Sales ( Čcr )
OPM(%)
EPS (Č)
PER(x)
P/BV(x)
RoE(%)
EV/Sales(x)
(Č)
Price ( Č)
( Č cr )
FY17E
FY18E
FY17E
FY18E
FY17E
FY18E
FY17E
FY18E
FY17E
FY18E
FY17E
FY18E
FY17E
FY18E
Capital Goods
Bharat Electronics
Neutral
183
-
40,898
8,137
9,169
16.8
17.2
58.7
62.5
3.1
2.9
0.5
0.4
44.6
46.3
4.0
3.6
BHEL
Neutral
175
-
42,919
28,797
34,742
-
2.8
2.3
6.9
76.2
25.4
1.3
1.3
1.3
4.8
1.1
0.8
Blue Star
Accumulate
675
760
6,447
4,283
5,077
5.9
7.3
14.9
22.1
45.3
30.5
8.8
7.4
20.4
26.4
1.6
1.3
CG Power and Industrial
Neutral
78
-
4,911
5,777
6,120
5.9
7.0
3.3
4.5
23.7
17.4
1.0
1.0
4.4
5.9
0.8
0.7
Solutions
Greaves Cotton
Neutral
169
-
4,117
1,755
1,881
16.8
16.9
7.8
8.5
21.6
19.8
4.3
4.0
20.6
20.9
2.0
1.9
Inox Wind
Neutral
203
-
4,505
5,605
6,267
15.7
16.4
24.8
30.0
8.2
6.8
2.3
1.7
25.9
24.4
0.8
0.7
KEC International
Neutral
217
-
5,583
9,294
10,186
7.9
8.1
9.9
11.9
21.9
18.3
3.2
2.8
15.6
16.3
0.8
0.8
KEI Industries
Accumulate
214
239
1,668
2,682
3,058
10.4
10.0
11.7
12.8
18.3
16.7
3.7
3.0
20.1
18.2
0.8
0.7
Thermax
Neutral
1,028
-
12,253
5,421
5,940
7.3
7.3
25.7
30.2
40.0
34.1
4.8
4.4
12.2
13.1
2.1
2.0
VATech Wabag
Neutral
681
-
3,717
3,136
3,845
8.9
9.1
26.0
35.9
26.2
19.0
3.3
2.8
13.4
15.9
1.1
0.9
Voltas
Neutral
414
-
13,697
6,511
7,514
7.9
8.7
12.9
16.3
32.1
25.4
5.8
5.1
16.7
18.5
1.9
1.6
Cement
ACC
Neutral
1,590
-
29,867
11,225
13,172
13.2
16.9
44.5
75.5
35.7
21.1
3.4
3.1
11.2
14.2
2.7
2.3
Ambuja Cements
Neutral
242
-
47,993
9,350
10,979
18.2
22.5
5.8
9.5
41.7
25.4
3.5
3.1
10.2
12.5
5.1
4.4
India Cements
Neutral
211
-
6,468
4,364
4,997
18.5
19.2
7.9
11.3
26.7
18.6
1.9
1.9
8.0
8.5
2.2
2.0
J K Lakshmi Cement
Neutral
467
-
5,496
2,913
3,412
14.5
19.5
7.5
22.5
62.3
20.8
3.8
3.2
12.5
18.0
2.5
2.1
JK Cement
Neutral
975
-
6,819
4,398
5,173
15.5
17.5
31.2
55.5
31.3
17.6
3.8
3.3
12.0
15.5
2.1
1.7
Orient Cement
Neutral
166
-
3,400
2,114
2,558
18.5
20.5
8.1
11.3
20.5
14.7
3.0
2.6
9.0
14.0
2.2
1.8
UltraTech Cement
Neutral
4,205
-
115,440
25,768
30,385
21.0
23.5
111.0
160.0
37.9
26.3
4.8
4.2
13.5
15.8
4.6
3.8
Construction
Engineers India
Neutral
171
-
11,490
1,725
1,935
16.0
19.1
11.4
13.9
15.0
12.3
2.1
2.0
13.4
15.3
5.6
5.0
Gujarat Pipavav Port
Neutral
160
-
7,750
705
788
52.2
51.7
5.0
5.6
32.1
28.6
3.2
2.8
11.2
11.2
10.6
9.0
ITNL
Neutral
114
-
3,745
8,946
10,017
31.0
31.6
8.1
9.1
14.1
12.5
0.5
0.5
4.2
5.0
3.8
3.5
KNR Constructions
Neutral
202
-
2,838
1,385
1,673
14.7
14.0
41.2
48.5
4.9
4.2
0.9
0.8
14.9
15.2
2.1
1.8
Larsen & Toubro
Neutral
1,730
-
161,414
111,017
124,908
11.0
11.0
61.1
66.7
28.3
25.9
3.4
3.2
13.1
12.9
2.5
2.3
MEP Infra
Neutral
69
-
1,114
1,877
1,943
30.6
29.8
3.0
4.2
22.8
16.3
11.1
7.5
0.6
0.6
2.0
1.8
Nagarjuna Const.
Neutral
99
-
5,495
8,842
9,775
9.1
8.8
5.3
6.4
18.7
15.5
1.5
1.4
8.2
9.1
0.8
0.7
NBCC
Neutral
196
-
17,627
7,428
9,549
7.9
8.6
8.2
11.0
23.9
17.8
1.2
0.9
28.2
28.7
2.1
1.6
PNC Infratech
Neutral
160
-
4,100
2,350
2,904
13.1
13.2
9.0
8.8
17.8
18.2
0.7
0.6
15.9
13.9
1.9
1.5
Power Mech Projects
Neutral
583
-
858
1,801
2,219
12.7
14.6
72.1
113.9
8.1
5.1
1.5
1.3
16.8
11.9
0.5
0.4
Sadbhav Engineering
Neutral
338
-
5,797
3,598
4,140
10.3
10.6
9.0
11.9
37.5
28.4
3.9
3.5
9.9
11.9
1.9
1.6
Top Picks Report
May 03, 2017
Company Name
Reco
CMP
Target
Mkt Cap
Sales ( Čcr )
OPM(%)
EPS (Č)
PER(x)
P/BV(x)
RoE(%)
EV/Sales(x)
(Č)
Price ( Č)
( Č cr )
FY17E
FY18E
FY17E
FY18E
FY17E
FY18E
FY17E
FY18E
FY17E
FY18E
FY17E
FY18E
FY17E
FY18E
Construction
Simplex Infra
Neutral
427
-
2,113
6,829
7,954
10.5
10.5
31.4
37.4
13.6
11.4
1.4
1.3
9.9
13.4
0.7
0.6
SIPL
Neutral
100
-
3,522
1,036
1,252
65.5
66.2
(8.4)
(5.6)
3.8
4.3
(22.8)
(15.9)
11.6
9.7
Financials
Axis Bank
Accumulate
505
580
121,022
46,932
53,575
3.5
3.4
32.4
44.6
15.6
11.3
2.0
1.8
13.6
16.5
-
-
Bank of Baroda
Neutral
189
-
43,503
19,980
23,178
1.8
1.8
11.5
17.3
16.4
10.9
1.9
1.6
8.3
10.1
-
-
Can Fin Homes
Neutral
2,836
-
7,550
420
526
3.5
3.5
86.5
107.8
32.8
26.3
7.1
5.8
23.6
24.1
-
-
Canara Bank
Neutral
367
-
21,897
15,225
16,836
1.8
1.8
14.5
28.0
25.3
13.1
1.8
1.4
5.8
8.5
-
-
Cholamandalam Inv. &
Accumulate
1,088
1,230
17,010
2,012
2,317
6.3
6.3
42.7
53.6
25.5
20.3
4.0
3.5
16.9
18.3
-
-
Fin. Co.
Dewan Housing Finance Neutral
447
-
14,010
2,225
2,688
2.9
2.9
29.7
34.6
15.1
12.9
2.4
1.6
16.1
14.8
-
-
Equitas Holdings
Buy
163
235
5,498
939
1,281
11.7
11.5
5.8
8.2
28.1
19.9
2.4
2.2
10.9
11.5
-
-
Federal Bank
Accumulate
113
125
19,393
8,259
8,995
3.0
3.0
4.3
5.6
26.2
20.1
2.2
2.1
8.5
10.1
-
-
HDFC
Neutral
1,583
-
251,478
11,475
13,450
3.4
3.4
45.3
52.5
34.9
30.2
6.7
6.0
20.2
20.5
-
-
HDFC Bank
Accumulate
1,542
1,650
395,445
46,097
55,433
4.5
4.5
58.4
68.0
26.4
22.7
4.6
3.9
18.8
18.6
-
-
ICICI Bank
Accumulate
276
315
160,753
42,800
44,686
3.1
3.3
18.0
21.9
15.3
12.6
2.1
1.9
11.1
12.3
-
-
Karur Vysya Bank
Buy
121
140
7,297
5,640
6,030
3.3
3.2
8.9
10.0
13.6
12.1
1.4
1.3
11.2
11.4
-
-
Lakshmi Vilas Bank
Neutral
181
-
3,461
3,339
3,799
2.7
2.8
11.0
14.0
16.4
12.9
1.7
1.6
11.2
12.7
-
-
LIC Housing Finance
Neutral
705
-
35,596
3,712
4,293
2.6
2.5
39.0
46.0
18.1
15.3
3.4
2.9
19.9
20.1
-
-
Punjab Natl.Bank
Neutral
171
-
36,335
23,532
23,595
2.3
2.4
6.8
12.6
25.1
13.6
3.9
2.8
3.3
6.5
-
-
RBL Bank
Neutral
585
-
21,966
1,783
2,309
2.6
2.6
12.7
16.4
46.1
35.7
5.0
4.5
12.8
13.3
-
-
Repco Home Finance
Accumulate
771
825
4,825
388
457
4.5
4.2
30.0
38.0
25.7
20.3
4.3
3.6
18.0
19.2
-
-
South Ind.Bank
Neutral
26
-
4,606
6,435
7,578
2.5
2.5
2.7
3.1
9.5
8.2
1.2
1.0
10.1
11.2
-
-
St Bk of India
Neutral
288
-
233,767
88,650
98,335
2.6
2.6
13.5
18.8
21.4
15.3
2.0
1.8
7.0
8.5
-
-
Union Bank
Neutral
171
-
11,721
13,450
14,925
2.3
2.3
25.5
34.5
6.7
4.9
1.0
0.8
7.5
10.2
-
-
Yes Bank
Neutral
1,631
-
74,494
8,978
11,281
3.3
3.4
74.0
90.0
22.0
18.1
4.2
3.6
17.0
17.2
-
-
FMCG
Akzo Nobel India
Neutral
1,962
-
9,411
2,955
3,309
13.3
13.7
57.2
69.3
34.3
28.3
11.2
9.4
32.7
33.3
3.0
2.6
Asian Paints
Neutral
1,116
-
107,018
17,128
18,978
16.8
16.4
19.1
20.7
58.4
53.9
20.3
19.2
34.8
35.5
6.2
5.6
Britannia
Neutral
3,572
-
42,868
9,594
11,011
14.6
14.9
80.3
94.0
44.5
38.0
18.3
14.1
41.2
-
4.3
3.7
Colgate
Neutral
1,029
-
28,000
4,605
5,149
23.4
23.4
23.8
26.9
43.3
38.3
23.9
18.7
64.8
66.8
6.0
5.4
Dabur India
Accumulate
284
304
50,045
8,315
9,405
19.8
20.7
8.1
9.2
35.1
30.9
9.8
8.1
31.6
31.0
5.7
5.0
GlaxoSmith Con*
Neutral
5,180
-
21,786
4,350
4,823
21.2
21.4
179.2
196.5
28.9
26.4
7.7
6.5
27.1
26.8
4.4
3.9
Top Picks Report
May 03, 2017
Company Name
Reco
CMP
Target
Mkt Cap
Sales ( Čcr )
OPM(%)
EPS (Č)
PER(x)
P/BV(x)
RoE(%)
EV/Sales(x)
(Č)
Price ( Č)
( Č cr )
FY17E FY18E
FY17E
FY18E
FY17E
FY18E
FY17E
FY18E
FY17E
FY18E
FY17E
FY18E
FY17E
FY18E
FMCG
Godrej Consumer
Neutral
1,778
-
60,549
10,235
11,428
18.4
18.6
41.1
44.2
43.3
40.2
9.6
8.1
24.9
24.8
6.0
5.3
HUL
Neutral
929
-
201,003
35,252
38,495
17.8
17.8
20.7
22.4
45.0
41.5
43.0
36.9
95.6
88.9
5.5
5.1
ITC
Neutral
279
-
338,426
40,059
44,439
38.3
39.2
9.0
10.1
31.0
27.5
8.7
7.6
27.8
27.5
8.0
7.2
Marico
Neutral
319
-
41,166
6,430
7,349
18.8
19.5
6.4
7.7
49.8
41.4
15.1
12.7
33.2
32.5
6.2
5.4
Nestle*
Neutral
6,715
-
64,739
10,073
11,807
20.7
21.5
124.8
154.2
53.8
43.5
22.1
19.9
34.8
36.7
6.2
5.3
Procter & Gamble
Neutral
7,379
-
23,954
2,939
3,342
23.2
23.0
146.2
163.7
50.5
45.1
12.8
10.6
25.3
23.5
7.7
6.7
Hygiene
Tata Global
Neutral
158
-
9,953
8,675
9,088
9.8
9.8
7.4
8.2
21.3
19.2
1.7
1.6
7.9
8.1
1.1
1.0
IT
HCL Tech^
Buy
822
1,000
117,333
49,242
57,168
20.5
20.5
55.7
64.1
14.8
12.8
3.0
2.3
20.3
17.9
2.2
1.8
Infosys
Buy
921
1,179
211,549
68,484
73,963
26.0
26.0
63.0
64.0
14.6
14.4
3.1
2.8
20.8
19.7
2.8
2.4
TCS
Buy
2,292
2,651
451,612
117,966
127,403
27.5
27.6
134.3
144.5
17.1
15.9
5.1
4.7
29.8
29.7
3.5
3.2
Tech Mahindra
Buy
418
600
40,722
29,673
32,937
15.5
17.0
32.8
39.9
12.7
10.5
2.5
2.2
19.6
20.7
1.1
0.9
Wipro
Buy
495
570
120,390
55,421
58,536
20.3
20.3
35.1
36.5
14.1
13.6
2.4
2.1
19.2
14.6
1.6
1.4
Media
D B Corp
Neutral
378
-
6,953
2,297
2,590
27.4
28.2
21.0
23.4
18.0
16.2
4.2
3.6
23.7
23.1
2.8
2.4
Hindustan Media
Neutral
290
-
2,128
1,016
1,138
24.3
25.2
27.3
30.1
10.6
9.6
2.0
1.8
16.2
15.8
1.4
1.2
Ventures
HT Media
Neutral
82
-
1,912
2,693
2,991
12.6
12.9
7.9
9.0
10.4
9.1
0.9
0.8
7.8
8.3
0.3
0.2
Jagran Prakashan
Accumulate
198
225
6,458
2,355
2,635
28.0
28.0
10.8
12.5
18.3
15.8
4.0
3.4
21.7
21.7
2.8
2.4
Sun TV Network
Neutral
924
-
36,394
2,850
3,265
70.1
71.0
26.2
30.4
35.3
30.4
9.0
8.0
24.3
25.6
12.4
10.7
TV Today Network
Buy
271
344
1,615
567
645
26.7
27.0
15.4
18.1
17.6
15.0
2.6
2.3
14.9
15.2
2.4
2.0
Metals & Mining
Coal India
Neutral
275
-
170,859
84,638
94,297
21.4
22.3
24.5
27.1
11.2
10.2
4.7
4.5
42.6
46.0
1.5
1.4
Hind. Zinc
Neutral
269
-
113,450
14,252
18,465
55.9
48.3
15.8
21.5
17.0
12.5
2.8
2.4
17.0
20.7
8.0
6.1
Hindalco
Neutral
200
-
44,900
107,899
112,095
7.4
8.2
9.2
13.0
21.8
15.4
1.1
1.0
4.8
6.6
0.9
0.9
JSW Steel
Neutral
196
-
47,329
53,201
58,779
16.1
16.2
130.6
153.7
1.5
1.3
0.2
0.2
14.0
14.4
1.7
1.4
NMDC
Neutral
128
-
40,340
6,643
7,284
44.4
47.7
7.1
7.7
18.0
16.6
1.6
1.5
8.8
9.2
3.8
3.5
SAIL
Neutral
59
-
24,471
47,528
53,738
(0.7)
2.1
(1.9)
2.6
22.8
0.6
0.6
(1.6)
3.9
1.4
1.2
Tata Steel
Neutral
445
-
43,243
121,374
121,856
7.2
8.4
18.6
34.3
23.9
13.0
1.5
1.4
6.1
10.1
1.0
1.0
Vedanta
Neutral
242
-
71,701
71,744
81,944
19.2
21.7
13.4
20.1
18.1
12.0
1.5
1.4
8.4
11.3
1.4
1.1
Oil & Gas
Cairn India
#VALUE!
9,127
10,632
4.3
20.6
8.8
11.7
3.3
4.2
GAIL
Neutral
430
-
72,718
56,220
65,198
9.3
10.1
27.1
33.3
15.9
12.9
1.5
1.4
9.3
10.7
1.5
1.3
Indian Oil Corp
Neutral
443
-
215,141
373,359
428,656
5.9
5.5
54.0
59.3
8.2
7.5
1.3
1.1
16.0
15.6
0.7
0.6
Top Picks Report
May 03, 2017
Company Name
Reco
CMP
Target
Mkt Cap
Sales ( Čcr )
OPM(%)
EPS (Č)
PER(x)
P/BV(x)
RoE(%)
EV/Sales(x)
(Č)
Price ( Č)
( Č cr )
FY17E FY18E
FY17E
FY18E
FY17E
FY18E
FY17E
FY18E
FY17E
FY18E
FY17E
FY18E
FY17E
FY18E
Oil & Gas
ONGC
Neutral
192
-
246,591
137,222
152,563
15.0
21.8
19.5
24.1
9.9
8.0
0.8
0.8
8.5
10.1
2.1
1.9
Reliance Industries
Neutral
1,371
-
445,725
301,963
358,039
12.1
12.6
87.7
101.7
15.6
13.5
1.6
1.5
10.7
11.3
2.0
1.6
Pharmaceuticals
Alembic Pharma
Accumulate
619
689
11,668
3,483
4,244
20.2
21.4
24.3
33.6
25.5
18.4
5.8
4.6
25.5
25.3
3.3
2.6
Alkem Laboratories Ltd
Accumulate
1,988
2,257
23,765
6,065
7,009
18.7
20.0
80.2
92.0
24.8
21.6
5.6
4.7
22.5
21.6
3.9
3.3
Aurobindo Pharma
Buy
597
877
34,963
15,720
18,078
23.7
23.7
41.4
47.3
14.4
12.6
3.8
2.9
29.6
26.1
2.4
2.1
Aventis*
Neutral
4,198
-
9,668
2,277
2,597
16.6
17.4
128.9
157.0
32.6
26.7
5.6
4.3
21.6
26.4
4.0
3.3
Cadila Healthcare
Neutral
447
-
45,807
10,429
12,318
17.7
21.6
13.1
19.2
34.2
23.3
7.2
5.7
22.8
27.1
4.4
3.6
Cipla
Sell
555
465
44,610
15,378
18,089
15.7
16.8
19.3
24.5
28.7
22.6
3.4
3.0
12.3
13.9
3.1
2.6
Dishman Pharma
Sell
309
143
4,981
1,718
1,890
22.7
22.8
9.5
11.3
32.5
27.3
3.1
2.9
10.1
10.9
3.4
3.0
Dr Reddy's
Neutral
2,580
-
42,752
16,043
18,119
18.0
23.0
78.6
130.9
32.8
19.7
3.2
2.8
10.1
15.2
2.4
2.3
GSK Pharma*
Neutral
2,423
-
20,526
2,800
3,290
10.2
20.6
32.2
60.3
75.3
40.2
13.9
13.8
17.2
34.5
7.1
6.1
Indoco Remedies
Accumulate
220
240
2,028
1,112
1,289
16.2
18.2
11.6
16.0
19.0
13.8
3.0
2.6
17.0
20.1
1.9
1.6
Ipca labs
Neutral
588
-
7,419
3,258
3,747
12.8
15.3
12.1
19.2
48.6
30.6
3.0
2.8
6.4
9.5
2.4
2.1
Lupin
Buy
1,304
1,809
58,914
15,912
18,644
26.4
26.7
58.1
69.3
22.5
18.8
4.4
3.6
21.4
20.9
3.8
3.1
Natco Pharma
Accumulate
921
974
16,049
2,090
2,335
32.1
26.6
26.8
23.2
34.3
39.7
9.7
8.4
28.4
21.1
7.7
95.1
Sun Pharma
Buy
632
847
151,715
31,129
35,258
32.0
32.9
30.2
35.3
20.9
17.9
3.4
2.8
20.0
20.1
4.4
3.7
Power
NTPC
Neutral
162
-
133,659
86,605
95,545
17.5
20.8
11.8
13.4
13.7
12.1
1.4
1.3
10.5
11.1
2.9
2.9
Power Grid
Accumulate
206
223
107,771
25,315
29,193
88.2
88.7
14.2
17.2
14.6
12.0
2.2
1.9
15.2
16.1
8.9
8.0
Tata Power
Neutral
83
-
22,531
36,916
39,557
17.4
27.1
5.1
6.3
16.3
13.2
1.4
1.3
9.0
10.3
1.6
1.5
Real Estate
MLIFE
Buy
444
522
1,824
1,152
1,300
22.7
24.6
29.9
35.8
14.9
12.4
1.1
1.0
7.6
8.6
2.3
1.9
Prestige Estate
Neutral
241
-
9,043
4,707
5,105
25.2
26.0
10.3
13.0
23.4
18.6
1.9
1.7
10.3
10.2
3.1
2.8
Telecom
Bharti Airtel
Neutral
348
-
138,910
105,086
114,808
34.5
34.7
12.2
16.4
28.5
21.2
1.9
1.8
6.8
8.4
2.2
1.9
Idea Cellular
Neutral
85
-
30,541
40,133
43,731
37.2
37.1
6.4
6.5
13.2
13.0
1.1
1.0
8.2
7.6
1.8
1.5
zOthers
Abbott India
Neutral
4,264
-
9,060
3,153
3,583
14.1
14.4
152.2
182.7
28.0
23.3
137.5
117.5
25.6
26.1
2.6
2.2
Asian Granito
Accumulate
384
405
1,154
1,060
1,169
12.2
12.5
12.7
15.9
30.3
24.1
2.9
2.6
9.5
10.7
1.4
1.2
Bajaj Electricals
Accumulate
353
395
3,570
4,801
5,351
5.7
6.2
10.4
13.7
33.8
25.8
4.2
3.7
12.4
14.5
0.7
0.7
Banco Products (India)
Neutral
232
-
1,656
1,353
1,471
12.3
12.4
14.5
16.3
16.0
14.2
22.1
19.9
14.5
14.6
1.2
125.3
Coffee Day Enterprises
Neutral
251
-
5,171
2,964
3,260
20.5
21.2
4.7
8.0
-
31.4
2.9
2.7
5.5
8.5
2.2
1.9
Ltd
Competent Automobiles Neutral
237
-
152
1,137
1,256
3.1
2.7
28.0
23.6
8.5
10.0
45.6
41.2
14.3
11.5
0.1
0.1
Top Picks Report
May 03, 2017
Company Name
Reco
CMP
Target
Mkt Cap
Sales ( Čcr )
OPM(%)
EPS (Č)
PER(x)
P/BV(x)
RoE(%)
EV/Sales(x)
(Č)
Price ( Č)
( Č cr )
FY17E
FY18E
FY17E
FY18E
FY17E
FY18E
FY17E
FY18E
FY17E
FY18E
FY17E
FY18E
FY17E
FY18E
zOthers
Elecon Engineering
Neutral
60
-
678
1,482
1,660
13.7
14.5
3.9
5.8
15.5
10.4
3.6
3.3
7.8
10.9
0.8
0.7
Finolex Cables
Neutral
527
-
8,061
2,883
3,115
12.0
12.1
14.2
18.6
37.1
28.3
19.7
17.3
15.8
14.6
2.5
2.3
Garware Wall Ropes
Neutral
795
-
1,739
863
928
15.1
15.2
36.4
39.4
21.8
20.2
4.0
3.4
17.5
15.9
1.9
1.8
Goodyear India*
Neutral
887
-
2,045
1,598
1,704
10.4
10.2
49.4
52.6
18.0
16.9
82.9
72.7
18.2
17.0
1.0
137.6
Hitachi
Neutral
1,778
-
4,835
2,081
2,433
8.8
8.9
33.4
39.9
53.2
44.6
43.0
35.8
22.1
21.4
2.3
2.0
HSIL
Neutral
342
-
2,471
2,384
2,515
15.8
16.3
15.3
19.4
22.3
17.6
22.2
19.1
7.8
9.3
1.2
1.1
Interglobe Aviation
Neutral
1,125
-
40,660
21,122
26,005
14.5
27.6
110.7
132.1
10.2
8.5
60.8
43.4
168.5
201.1
1.9
1.5
Jyothy Laboratories
Neutral
394
-
7,157
1,440
2,052
11.5
13.0
8.5
10.0
46.4
39.4
11.2
10.4
18.6
19.3
5.3
3.7
Kirloskar Engines India
Neutral
398
-
5,750
2,554
2,800
9.9
10.0
10.5
12.1
37.9
32.9
15.8
14.9
10.7
11.7
1.9
1.7
Ltd
Linc Pen & Plastics
Neutral
291
-
430
382
420
9.3
9.5
13.5
15.7
21.6
18.5
3.7
3.2
17.1
17.3
1.2
1.1
M M Forgings
Neutral
619
-
747
546
608
20.4
20.7
41.3
48.7
15.0
12.7
84.8
75.0
16.6
17.0
1.2
1.1
Manpasand Bever.
Neutral
704
-
4,028
836
1,087
19.6
19.4
16.9
23.8
41.7
29.6
5.0
4.4
12.0
14.8
4.6
3.4
Mirza International
Neutral
113
-
1,355
963
1,069
17.2
18.0
6.1
7.5
18.4
15.0
2.8
2.4
15.0
15.7
1.6
1.4
MT Educare
Neutral
79
-
314
366
417
17.7
18.2
9.4
10.8
8.4
7.3
1.9
1.6
22.2
22.3
0.8
0.7
Narayana Hrudaya
Neutral
319
-
6,521
1,873
2,166
11.5
11.7
2.6
4.0
120.7
80.5
7.4
6.7
6.1
8.3
3.6
3.1
Navkar Corporation
Buy
214
265
3,052
369
561
42.9
42.3
6.9
11.5
31.0
18.6
2.2
2.0
7.4
10.5
9.3
6.1
Navneet Education
Neutral
167
-
3,897
1,062
1,147
24.0
24.0
6.1
6.6
27.4
25.2
5.6
5.0
20.6
19.8
3.7
3.5
Nilkamal
Neutral
2,205
-
3,291
1,995
2,165
10.7
10.4
69.8
80.6
31.6
27.4
126.0
109.5
16.6
16.5
1.6
1.5
Page Industries
Neutral
14,704
-
16,401
2,450
3,124
20.1
17.6
299.0
310.0
49.2
47.4
327.5
250.0
47.1
87.5
6.7
5.3
Parag Milk Foods
Neutral
239
-
2,008
1,919
2,231
9.3
9.6
9.5
12.9
25.3
18.5
3.9
3.2
15.5
17.5
1.2
1.0
Quick Heal
Neutral
243
-
1,702
408
495
27.3
27.0
7.7
8.8
31.4
27.6
2.9
2.9
9.3
10.6
3.3
2.7
Radico Khaitan
Buy
123
147
1,630
1,667
1,824
13.0
13.2
6.7
8.2
18.4
15.0
1.7
1.5
9.0
10.2
1.4
1.2
Relaxo Footwears
Neutral
495
-
5,944
2,085
2,469
9.2
8.2
7.6
8.0
65.5
62.3
25.4
21.7
17.9
18.8
2.9
2.5
S H Kelkar & Co.
Neutral
327
-
4,729
1,036
1,160
15.1
15.0
6.1
7.2
53.6
45.6
5.7
5.3
10.7
11.5
4.4
3.9
Siyaram Silk Mills
Accumulate
1,674
1,872
1,569
1,652
1,857
11.6
11.7
92.4
110.1
18.1
15.2
2.7
2.3
14.7
15.2
1.2
1.0
Styrolution ABS India*
Neutral
733
-
1,290
1,440
1,537
9.2
9.0
40.6
42.6
18.1
17.2
46.1
41.9
12.3
11.6
0.9
0.8
Surya Roshni
Neutral
265
-
1,161
3,342
3,625
7.8
7.5
17.3
19.8
15.3
13.4
29.1
23.4
10.5
10.8
0.6
0.5
Team Lease Serv.
Neutral
1,086
-
1,857
3,229
4,001
1.5
1.8
22.8
32.8
47.7
33.1
5.1
4.4
10.7
13.4
0.5
0.4
The Byke Hospitality
Neutral
208
-
835
287
384
20.5
20.5
7.6
10.7
27.4
19.5
5.7
4.6
20.7
23.5
2.9
2.2
Top Picks Report
May 03, 2017
Company Name
Reco
CMP
Target Mkt Cap
Sales ( Čcr )
OPM(%)
EPS (Č)
PER(x)
P/BV(x)
RoE(%)
EV/Sales(x)
(Č)
Price ( Č)
( Č cr )
FY17E FY18E FY17E FY18E FY17E FY18E FY17E FY18E FY17E FY18E FY17E FY18E FY17E FY18E
zOthers
Transport Corporation of
Neutral
247
-
1,895
2,671
2,911
8.5
8.8
13.9
15.7
17.9
15.8
2.4
2.2
13.7
13.8
0.8
0.8
India
TVS Srichakra
Neutral
4,213
-
3,226
2,304
2,614
13.7
13.8
231.1
266.6
18.2
15.8
473.4
372.8
33.9
29.3
1.4
1.2
UFO Moviez
Neutral
455
-
1,256
619
685
33.2
33.4
30.0
34.9
15.2
13.0
2.1
1.8
13.8
13.9
1.7
1.4
Visaka Industries
Neutral
328
-
521
1,051
1,138
10.3
10.4
21.0
23.1
15.6
14.2
42.1
39.4
9.0
9.2
0.8
0.7
VRL Logistics
Neutral
339
-
3,092
1,902
2,119
16.7
16.6
14.6
16.8
23.3
20.1
5.1
4.5
21.9
22.2
1.7
1.5
Wonderla Holidays
Neutral
386
-
2,178
287
355
38.0
40.0
11.3
14.2
34.1
27.2
4.9
4.3
21.4
23.9
7.3
5.9
VIP Industries
Accumulate
201
218
2,843
1,270
1,450
10.4
10.4
5.6
6.5
35.9
31.0
7.5
6.5
20.7
21.1
2.2
2.0
Navin Fluorine
Buy
3,002
3,650
2,939
789
945
21.1
22.4
120.1
143.4
25.0
20.9
4.0
3.5
17.8
18.5
3.7
3.0
Source: Company, Angel Research; Note: *December year end; #September year end; &October year end; Price as on May 02, 2017
Top Picks Report | May 2017
Research Team Tel: 022 - 39357800
DISCLAIMER
Angel Broking Private Limited (hereinafter referred to as “Angel”) is a registered Member of National Stock Exchange of India Limited,
Bombay Stock Exchange Limited and Metropolitan Stock Exchange Limited. It is also registered as a Depository Participant with CDSL
and Portfolio Manager with SEBI. It also has registration with AMFI as a Mutual Fund Distributor. Angel Broking Private Limited is a
registered entity with SEBI for Research Analyst in terms of SEBI (Research Analyst) Regulations, 2014 vide registration number
INH000000164. Angel or its associates has not been debarred/ suspended by SEBI or any other regulatory authority for accessing
/dealing in securities Market. Angel or its associates/analyst has not received any compensation / managed or co-managed public
offering of securities of the company covered by Analyst during the past twelve months.
This document is solely for the personal information of the recipient, and must not be singularly used as the basis of any investment
decision. Nothing in this document should be construed as investment or financial advice. Each recipient of this document should
make such investigations as they deem necessary to arrive at an independent evaluation of an investment in the securities of the
companies referred to in this document (including the merits and risks involved), and should consult their own advisors to determine
the merits and risks of such an investment.
Reports based on technical and derivative analysis center on studying charts of a stock's price movement, outstanding positions and
trading volume, as opposed to focusing on a company's fundamentals and, as such, may not match with a report on a company's
fundamentals. Investors are advised to refer the Fundamental and Technical Research Reports available on our website to evaluate the
contrary view, if any.
The information in this document has been printed on the basis of publicly available information, internal data and other reliable
sources believed to be true, but we do not represent that it is accurate or complete and it should not be relied on as such, as this
document is for general guidance only. Angel Broking Pvt. Limited or any of its affiliates/ group companies shall not be in any way
responsible for any loss or damage that may arise to any person from any inadvertent error in the information contained in this report.
Angel Broking Pvt. Limited has not independently verified all the information contained within this document. Accordingly, we cannot
testify, nor make any representation or warranty, express or implied, to the accuracy, contents or data contained within this document.
While Angel Broking Pvt. Limited endeavors to update on a reasonable basis the information discussed in this material, there may be
regulatory, compliance, or other reasons that prevent us from doing so.
This document is being supplied to you solely for your information, and its contents, information or data may not be reproduced,
redistributed or passed on, directly or indirectly.
Neither Angel Broking Pvt. Limited, nor its directors, employees or affiliates shall be liable for any loss or damage that may arise from
or in connection with the use of this information.
Ratings (Based on expected returns
Buy (> 15%)
Accumulate (5% to 15%)
Neutral (-5 to 5%)
over 12 months investment period):
Reduce (-5% to -15%)
Sell (< -15)