
Please refer to important disclosures at the end of this report
1
Angel Top Picks – March 2021
Indian equities rallied sharply on back of a bold budget by the Government –
Indian equities rallied by 6.6% in January post the 2.5% correction last month.
Markets rallied on back of the bold Union Budget with a clear focus on reviving
growth through deficit spending. FPI flows for February improved to `25,787 cr.
from ` 19472 cr in January.
Indian Economic activity back to pre-Covid levels in Q3FY21- GDP data
released by the Government points to significant improvement in the economy in
Q3FY21 led by recovery in the Industrial sector. Real GDP growth for Q3FY21
stood at 0.4% YoY as compared to contraction of 24.3% and 7.3% in Q1FY21 and
Q2FY21 respectively. With this positive growth rate, the Indian economy has now
returned to its pre Covid levels of activity. Growth in the manufacturing and
constructing sectors has rebounded strongly to 1.6% and 6.2% respectively in
Q3FY21 as compared to contraction of 35.9% and 49.4% in Q1FY21. However,
services sector witnessed a marginal contraction of 1.0% YoY for Q3 as compared
to a contraction of 21.4% in Q1. Agriculture growth remained stable at 3.9% for the
quarter as compared to 3.3% in Q1FY21.
High frequency indicators point to further improvement in the economy in the
fourth quarter - High frequency indicators like the manufacturing PMI, services
PMI and auto sales numbers point to continued improvement in the underlying
economy in line with the GDP report. Manufacturing PMI for February was very
strong at 57.5, well above the long-term average of 53.6. Services PMI of 52.8 for
January also points to an expansion though at a slower pace as compared to
manufacturing. Moreover, the services PMI also rose sharply to 55.3 in February
with output expanding at the sharpest rate in over a year.
Positive global sentiments leading to a broad-based rally - Currently the US
Government is working on a third fiscal stimulus package of USD 1.9tn currently
being discussed in their parliament. If the US Government is able to pass the USD
1.9tn stimulus package then it would be positive for global equities. Vaccination
programs globally are proceeding as per schedule which is positive. Mass
vaccination has already commenced globally and we should see significant
progress over the next couple of quarters. Given the continued improvement in the
economy, abundant global liquidity and strong earnings growth we remain positive
on the markets from a medium to long term horizon despite any short-term volatility.
Top Picks Performance
Return Since Inception (30th Oct, 2015)
Top Picks Return
124.9%
BSE 100
79.7%
Outperformance
45.2%
Source: Company, Angel Research
Exhibit 1: Top Picks
Company
CMP (₹)
TP (₹)
IT
HCL Technologies
941.3
1,161
Auto
GNA Axles
394.6
500
NRB Bearings
116.8
135
Escorts
1318
1,573
Banking
IDFC First Bank
66.8
77
Federal Bank
87.3
110
Shri.City Union
1519
1,800
Chemicals
Galaxy Surfact.
2360
2,750
Cement & Infra
JK Lakshmi Cement
428.2
470
PNC Infratech
268.4
302
Others
Carborundum Universal
502.9
600
PVR
1452.6
1800
Source: Company, Angel Research
Note: Closing price as on 5th March, 2021

Angel Top Picks | March 2021
March 8, 2021
2
Top Picks
Angel Top Picks | March 2021
March 8, 2021
3
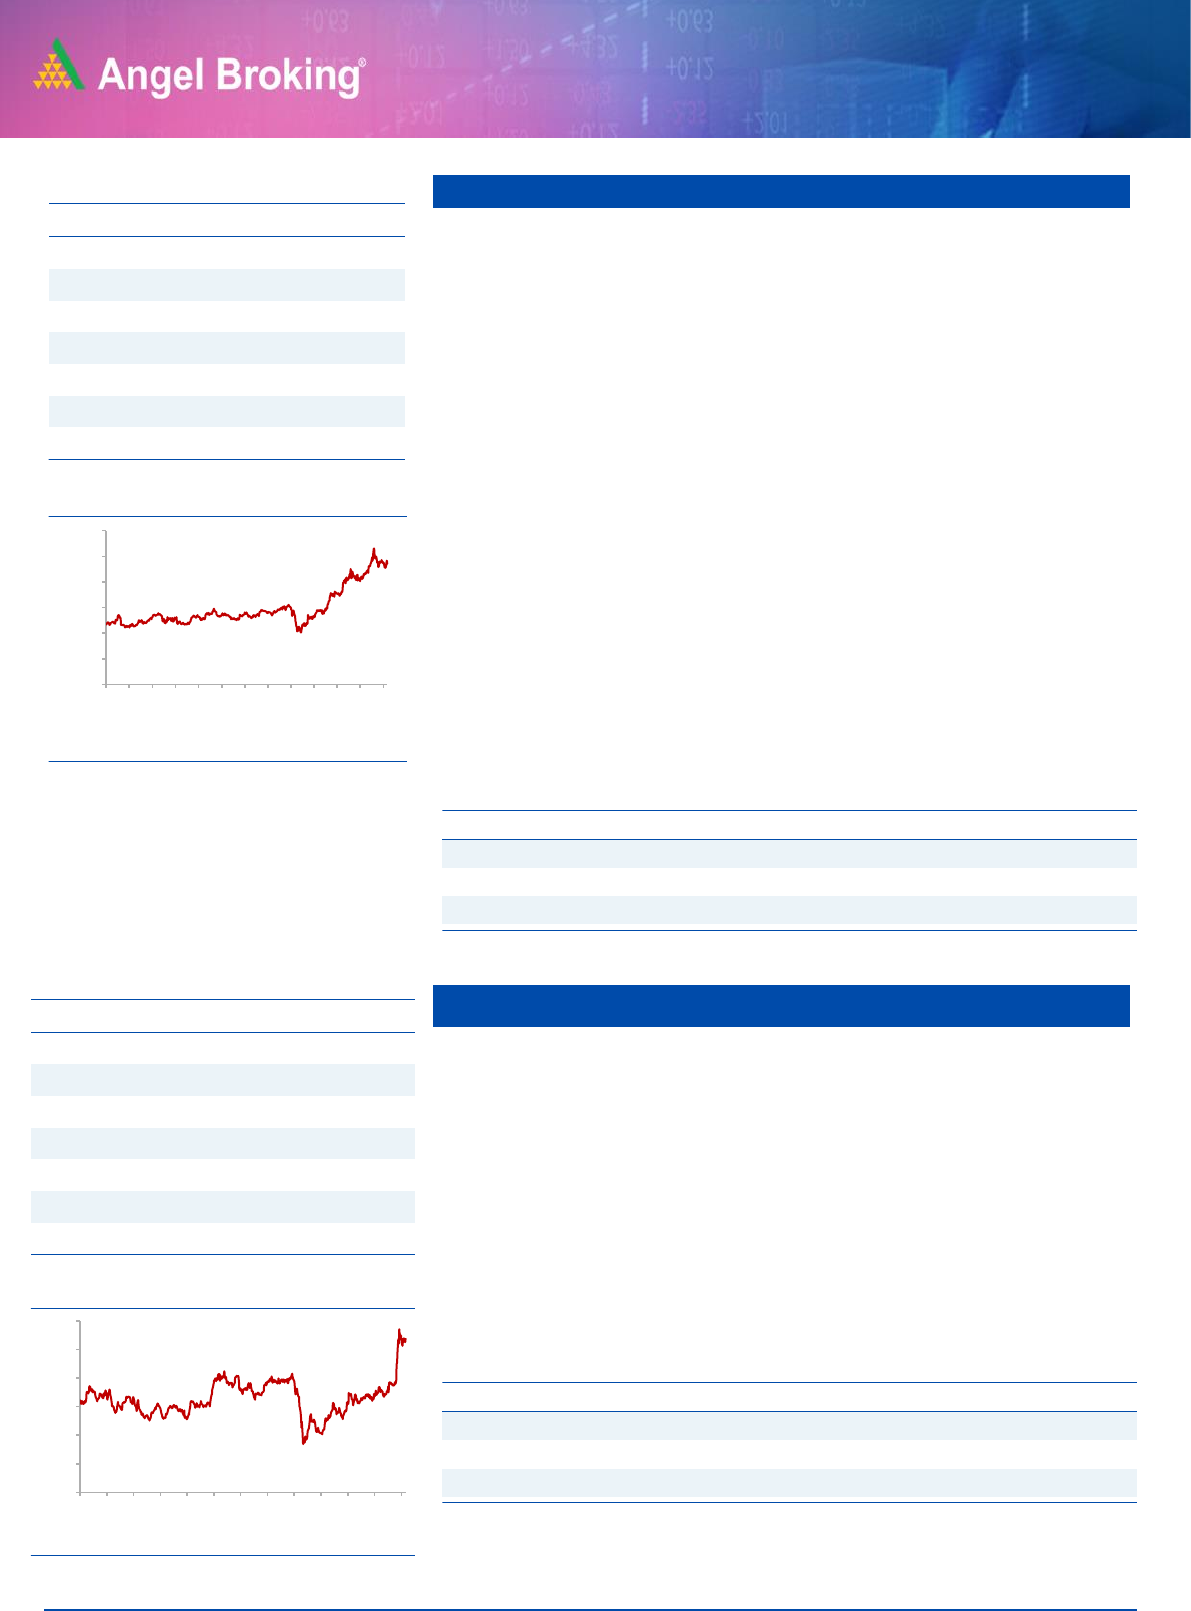
PNC Infratech
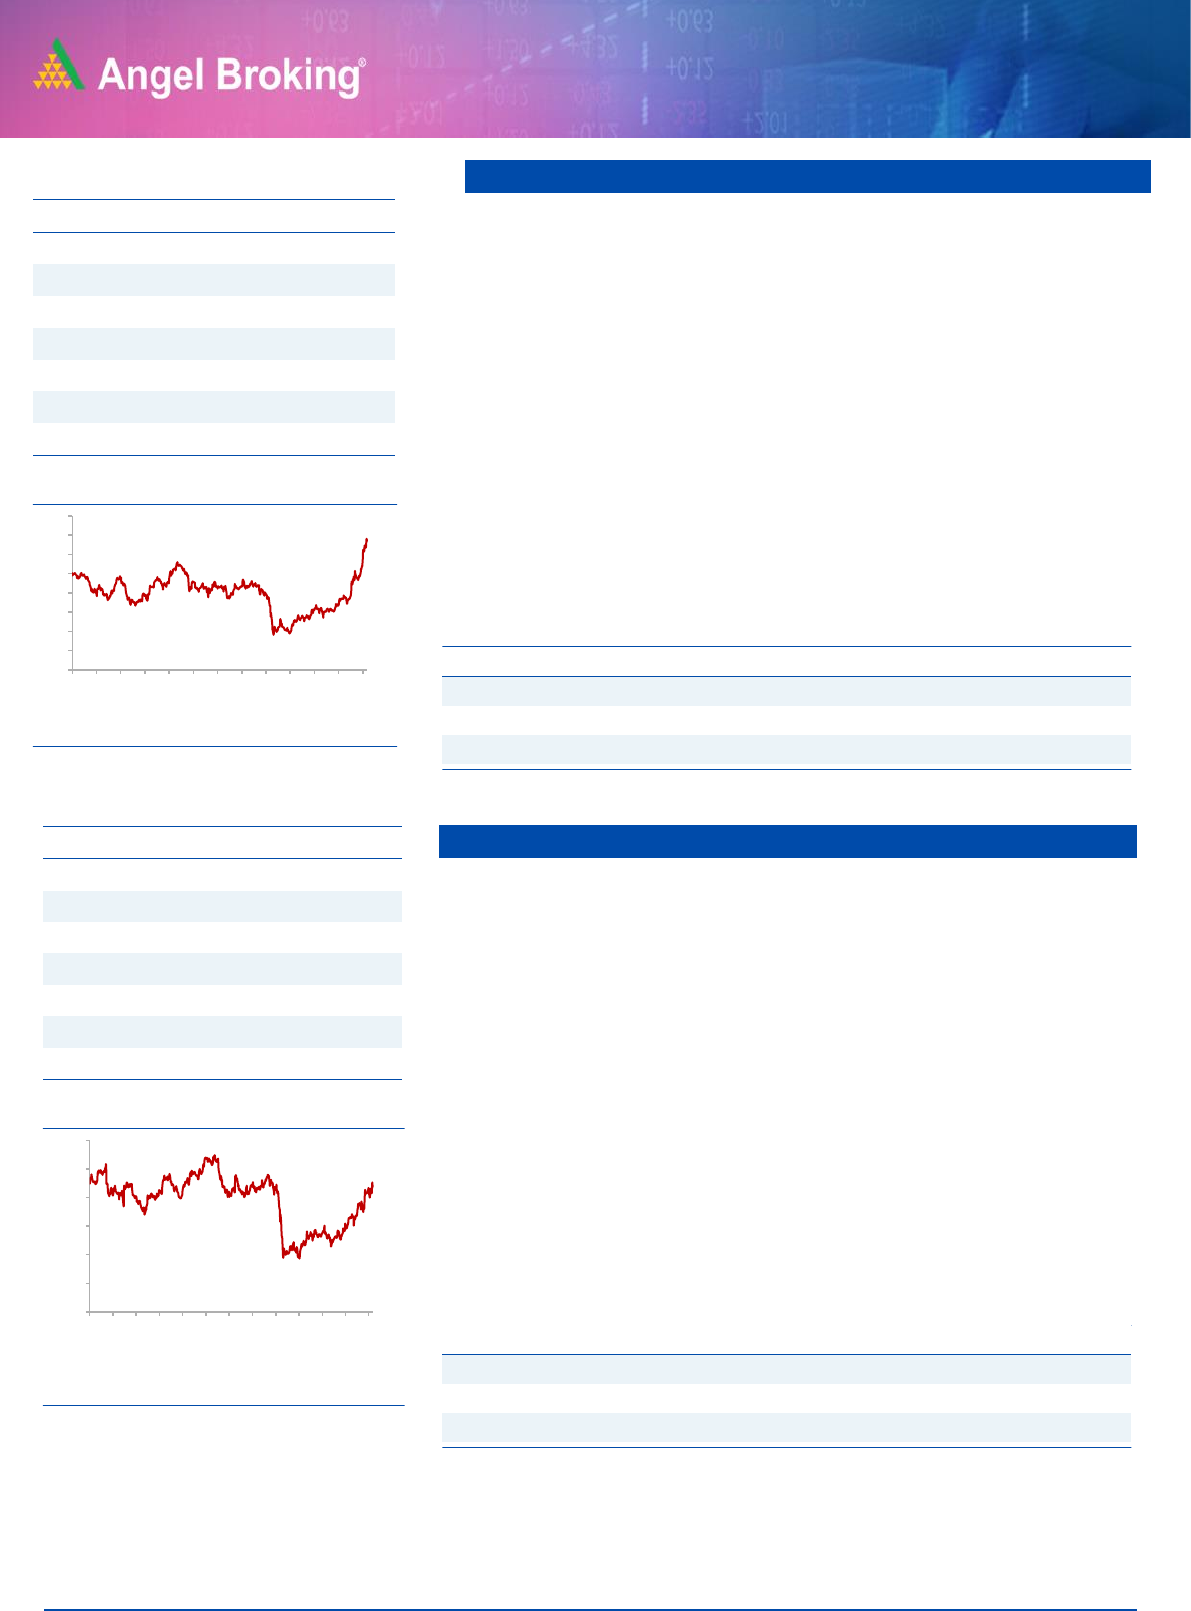
HCL Tech
HCL Tech is amongst the top four It services companies based out of India and
provides a vast gamut of services like ADM, Enterprise
solutions, Infrastructure management services etc. HCL Tech Q3FY21
revenues grew by 4.4% qoq. Operating profit for the quarter was up by 9.9%
qoq while EBIT margins were up by ~130bps qoq to 22.9%..
Net profit for the quarter was up by 26.3% qoq to ₹3,918 crore. While the
Q1FY21 numbers were marginally ahead of our estimates in terms of revenue
growth the expansion in margins despite wage hikes during the quarter was a
pleasant surprise. Management has highlighted that demand and supply
related issues are now over for the company and the deal pipeline has
improved significantly since September led by cloud related services.
Management has guided for 2.0-3.0% qoq growth in revenue in constant
currency terms for the rest of the year providing visibility. At CMP the stock is
trading at a P/E multiple of 17.0x FY22 EPS estimate which is at a significant
discount to the other large cap IT companies like Infosys and TCS and offers
tremendous value at current levels given market leader status in Infrastructure
management.
PNC Infratech is a mid-sized road EPC player. It has more than two decades
of experience in executing projects for marquee clients such as NHAI, UPEIDA,
MSRDC, UPPCL etc.
Company has a strong and healthy order book. On an F20 basis it has a book
to bill ratio of more than 3.5x. PNC has a track record of completing projects
ahead of timelines, as a result of which it is eligible for early completion bonus
from its clients.
Key Financials
Y/E
Sales
OPM
PAT
EPS
ROE
P/E
P/BV
EV/Sales
March
(` cr)
(%)
(` cr)
(`)
(%)
(x)
(x)
(x)
FY2021E
75806
21.8
13563
49.3
22.1
19.1
8.4
3.2
FY2022E
89736
22.4
15657
56.9
21.6
16.5
7.1
2.6
Source: Company, Angel Research
Key Financials
Y/E
Sales
OPM
PAT
EPS
ROE
P/E
P/BV
EV/Sales
March
(` cr)
(%)
(` cr)
(`)
(%)
(x)
(x)
(x)
FY2021E
4862
13.8
343
13.4
12.7
20.1
2.4
1.3
FY2022E
5574
14.1
445
17.4
14.5
15.5
2.1
1.2
Source: Company, Angel Research
Stock Info
CMP
268
TP
302
Upside
12.5%
Sector
Infra
Market Cap (` cr)
6885
Beta
0.86
52 Week High / Low
285/84
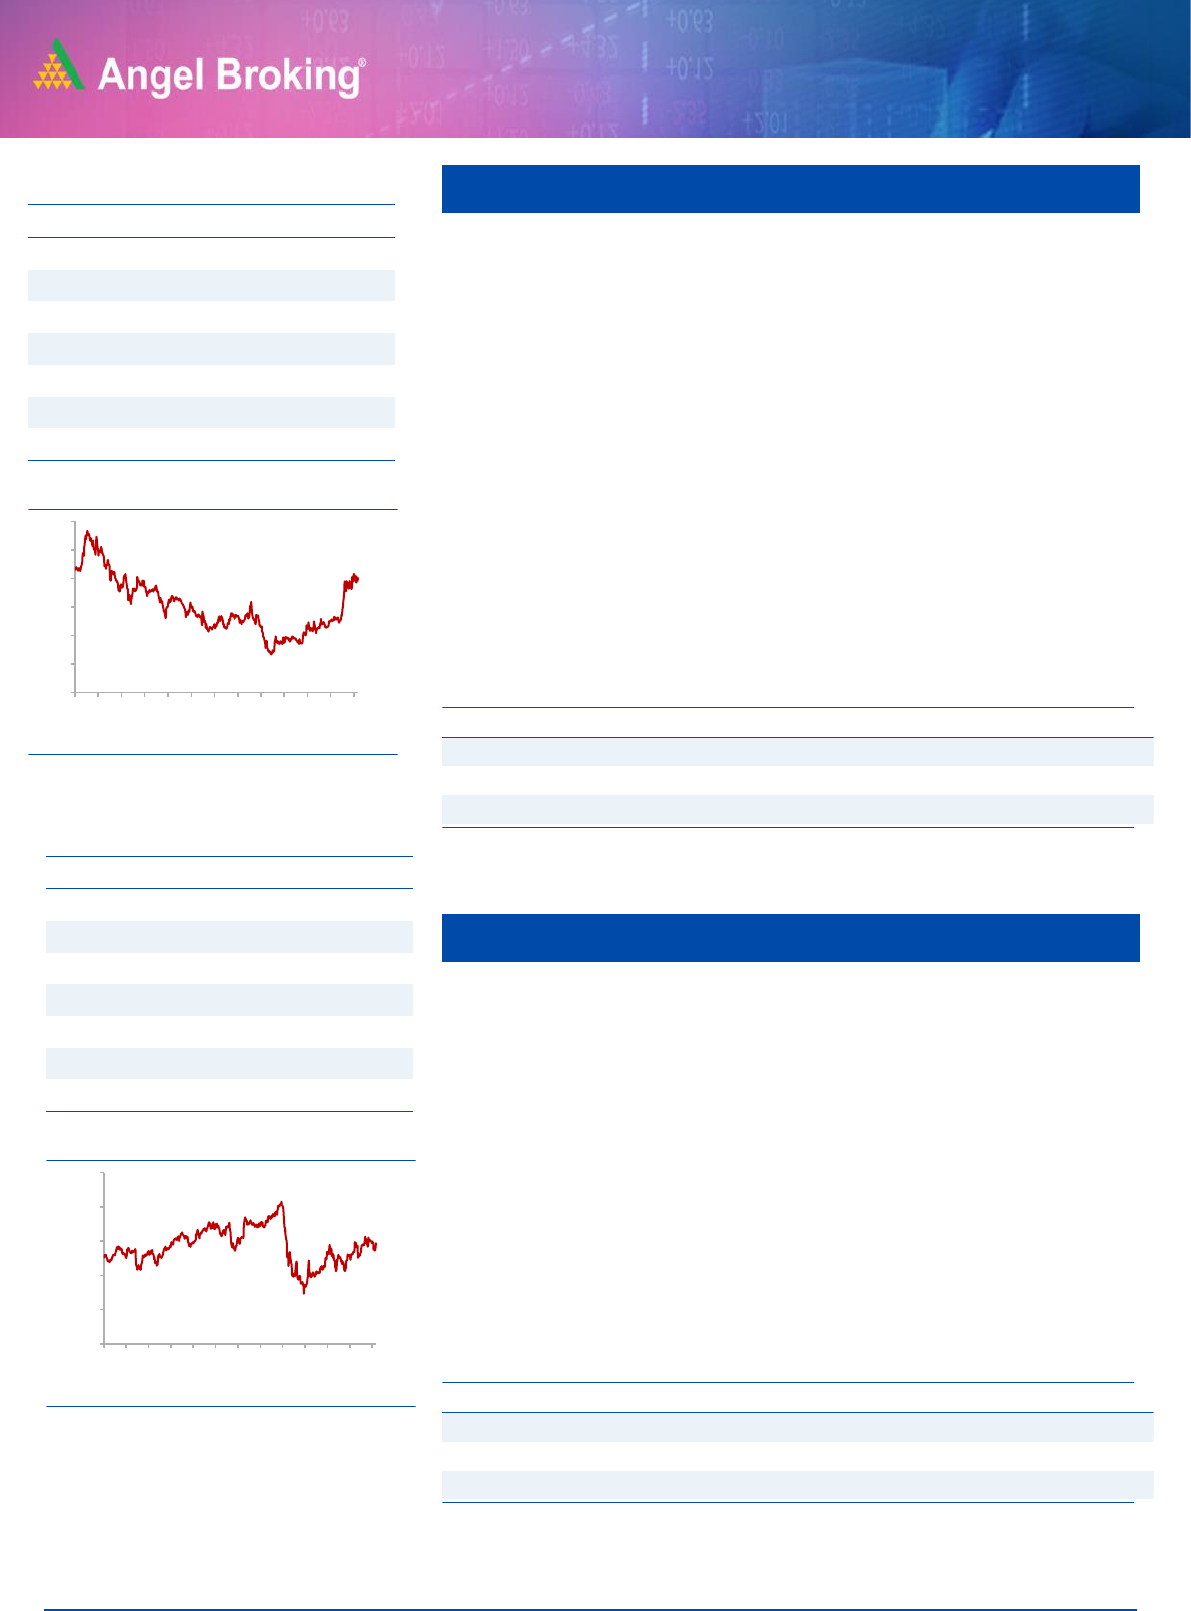
3 year-Chart
Source: Company, Angel Research
-
50
100
150
200
250
300
Mar-18
Jun-18
Sep-18
Dec-18
Mar-19
May-19
Aug-19
Nov-19
Feb-20
May-20
Aug-20
Nov-20
Feb-21
Stock Info
CMP
941.3
TP
1161
Upside
23.3%
Sector
IT
Market Cap (` cr)
255437
Beta
0.7487
52 Week High / Low
1062/405
3 year-Chart
Source: Company, Angel Research
-
200
400
600
800
1,000
1,200
Mar-18
Jun-18
Sep-18
Dec-18
Mar-19
May-19
Aug-19
Nov-19
Feb-20
May-20
Aug-20
Nov-20
Feb-21
Angel Top Picks | March 2021
March 8, 2021
4
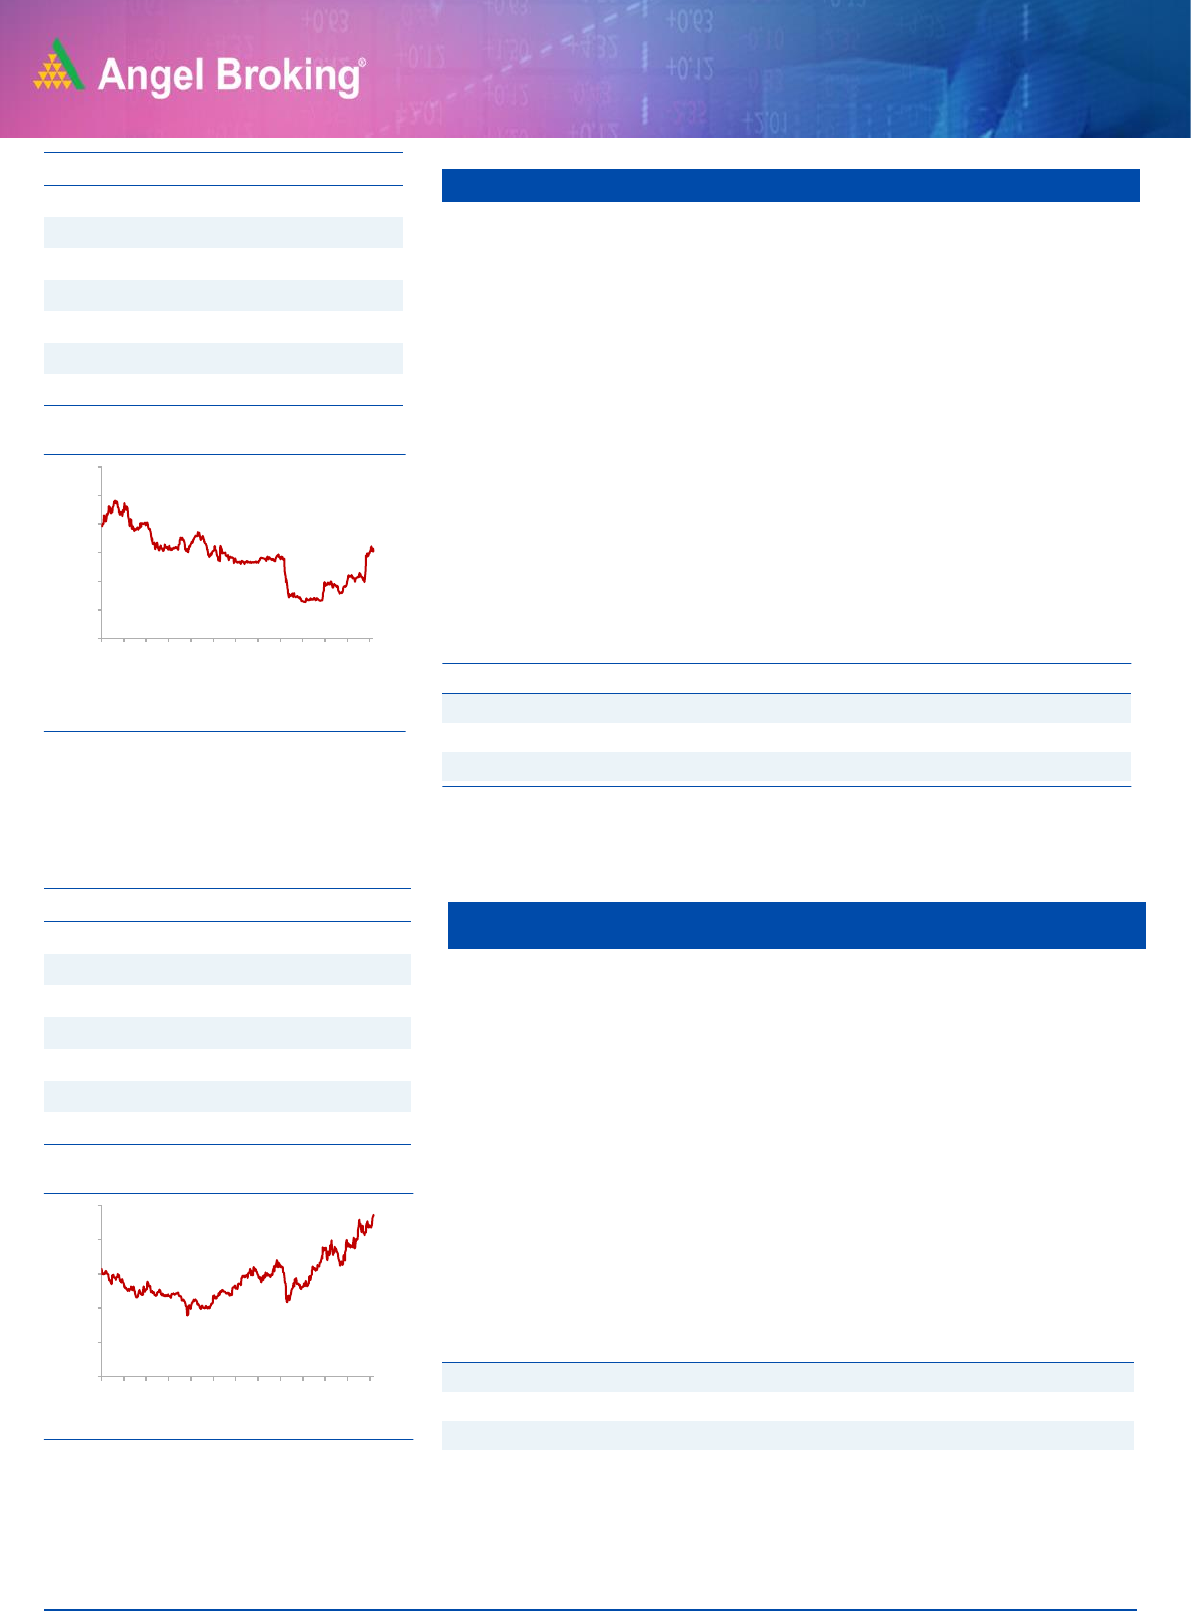
Federal Bank
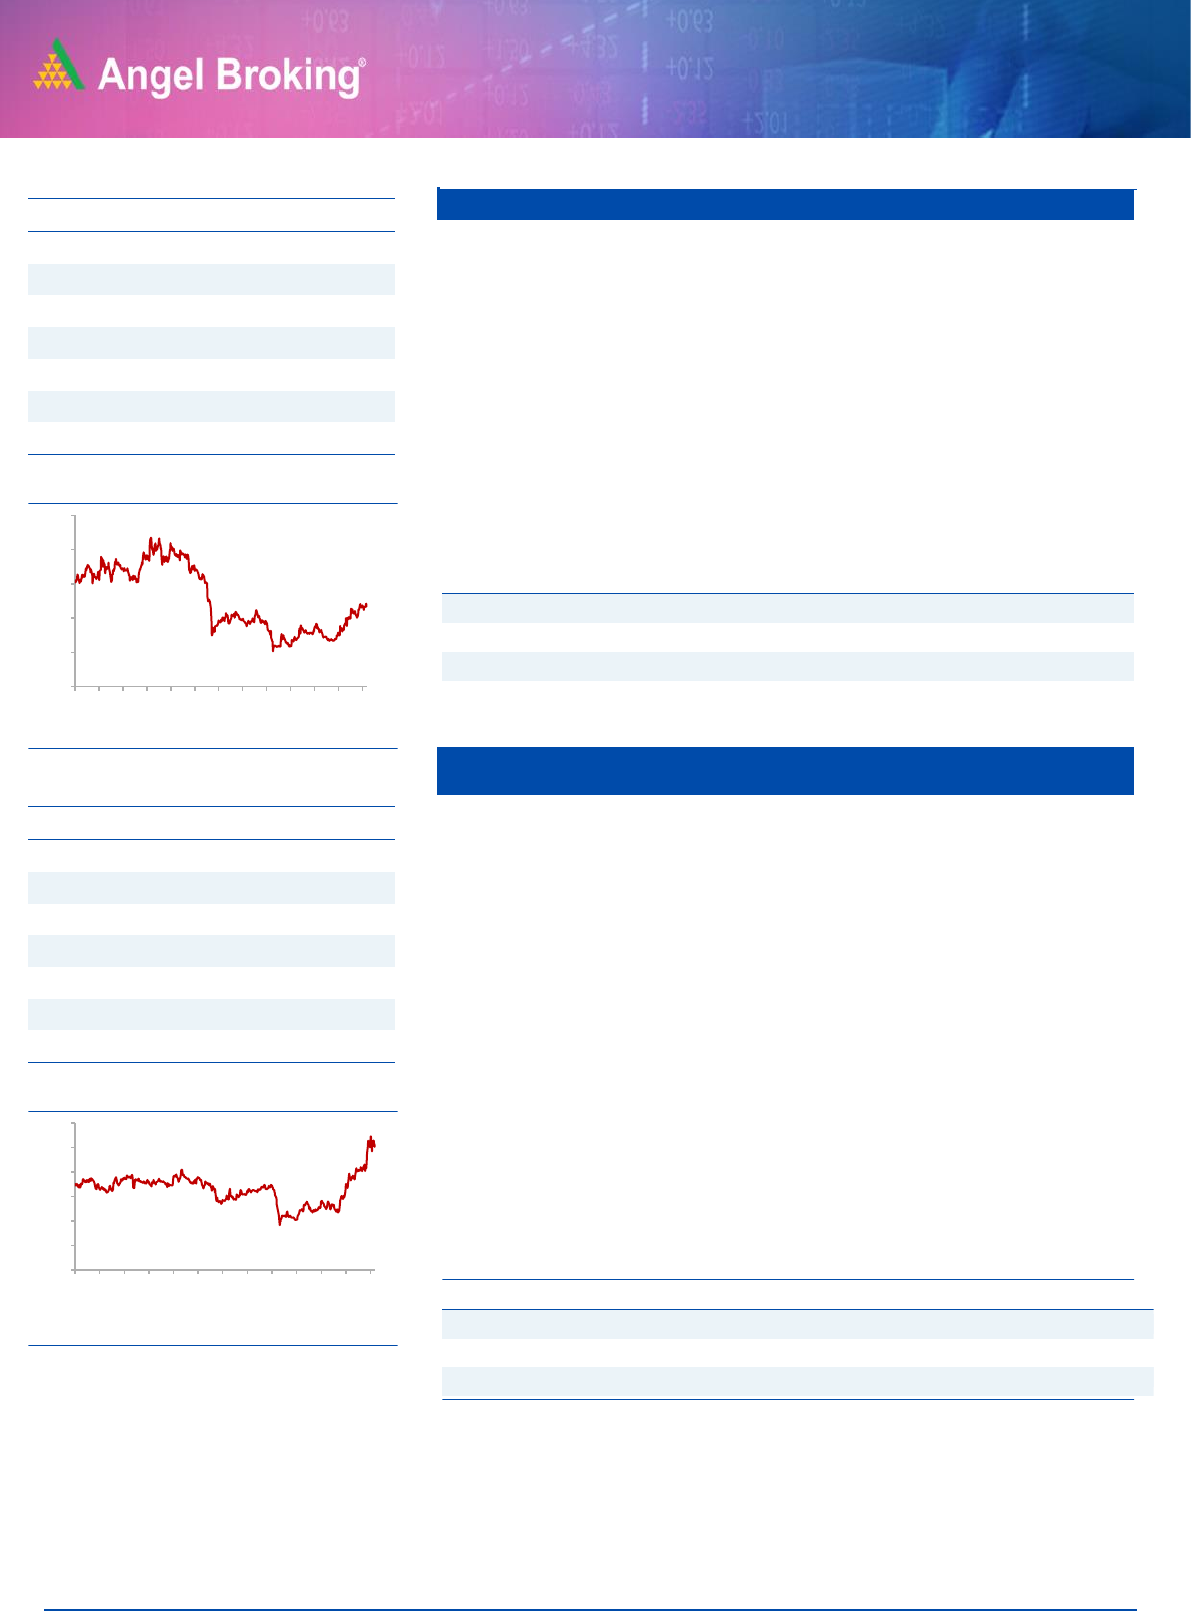
IDFC First Bank
The Ability to raise sufficient liquidity at Low cost would be The Key criteria for
banks to navigate the current situation, as asset side inflow would be limited.
IDFC Fist Bank, Post management change has clearly outperformed in building
liability franchise and retail lending.
Since new management took charge, every qtr. liability franchise has been
strengthened. CASA ratio improved from 10.4% in Q3FY19 to ~43% In
Q3FY21. NIM’s have also been stable for the bank despite interest reversals in
Q3FY21. Moreover, the bank is back on the growth path driven by strong
growth in Retail AUM.
The Bank had raised Rs. 2,000 crores of fresh equity capital during Q1FY21.
Post the capital raise, the company has been aggressively looking to expand
its retail book.
Federal bank is one of India’s largest old generation private sector banks. At
the end of FY2021 the bank had total assets of Rs. 1.9 lakh cr. with deposits of
Rs. 1.56 lakh cr. and a loan book of Rs. 1.2 lakh cr.
NPA's have remained steady for the bank over the past few years with GNPA
for Q3FY21 at 3.38% while NNPA ratio stood at 1.14%. PCR at the end of
Q3FY21 stood at ~67% which we believe is adequate. Restructuring book is
expected to be at Rs. 1,500-1,600 crore out of which Rs. 1,067 crore has
already been restructured. This is against earlier expectations of total
restructuring of Rs. 3,000-3,500 crore.
The company has posted a decent set of numbers for Q3FY21 as the loan book
grew by 6.0% YoY led by strong growth in retail portfolio. NIM's for the quarter
was up by 9bps QoQ to 3.22% while NII grew by a strong 24.4% YoY to Rs.
1,437 crore.
Key Financials
Y/E
NII
NIM
PAT
EPS
ABV
ROA
ROE
P/E
P/ABV
March
(` cr)
(%)
(` cr)
(`)
(`)
(%)
(%)
(x)
(x)
FY2021E
6,908
4.6
554
1.0
30
0.3
3.3
68
2.3
FY2022E
8,179
4.7
1,149
2.0
32
0.6
6.2
33
2.1
Source: Company, Angel Research
Stock Info
CMP
87.3
TP
110
Upside
26%
Sector
Banking
Market Cap (` cr)
17426
Beta
1.36
52 Week High / Low
90/37
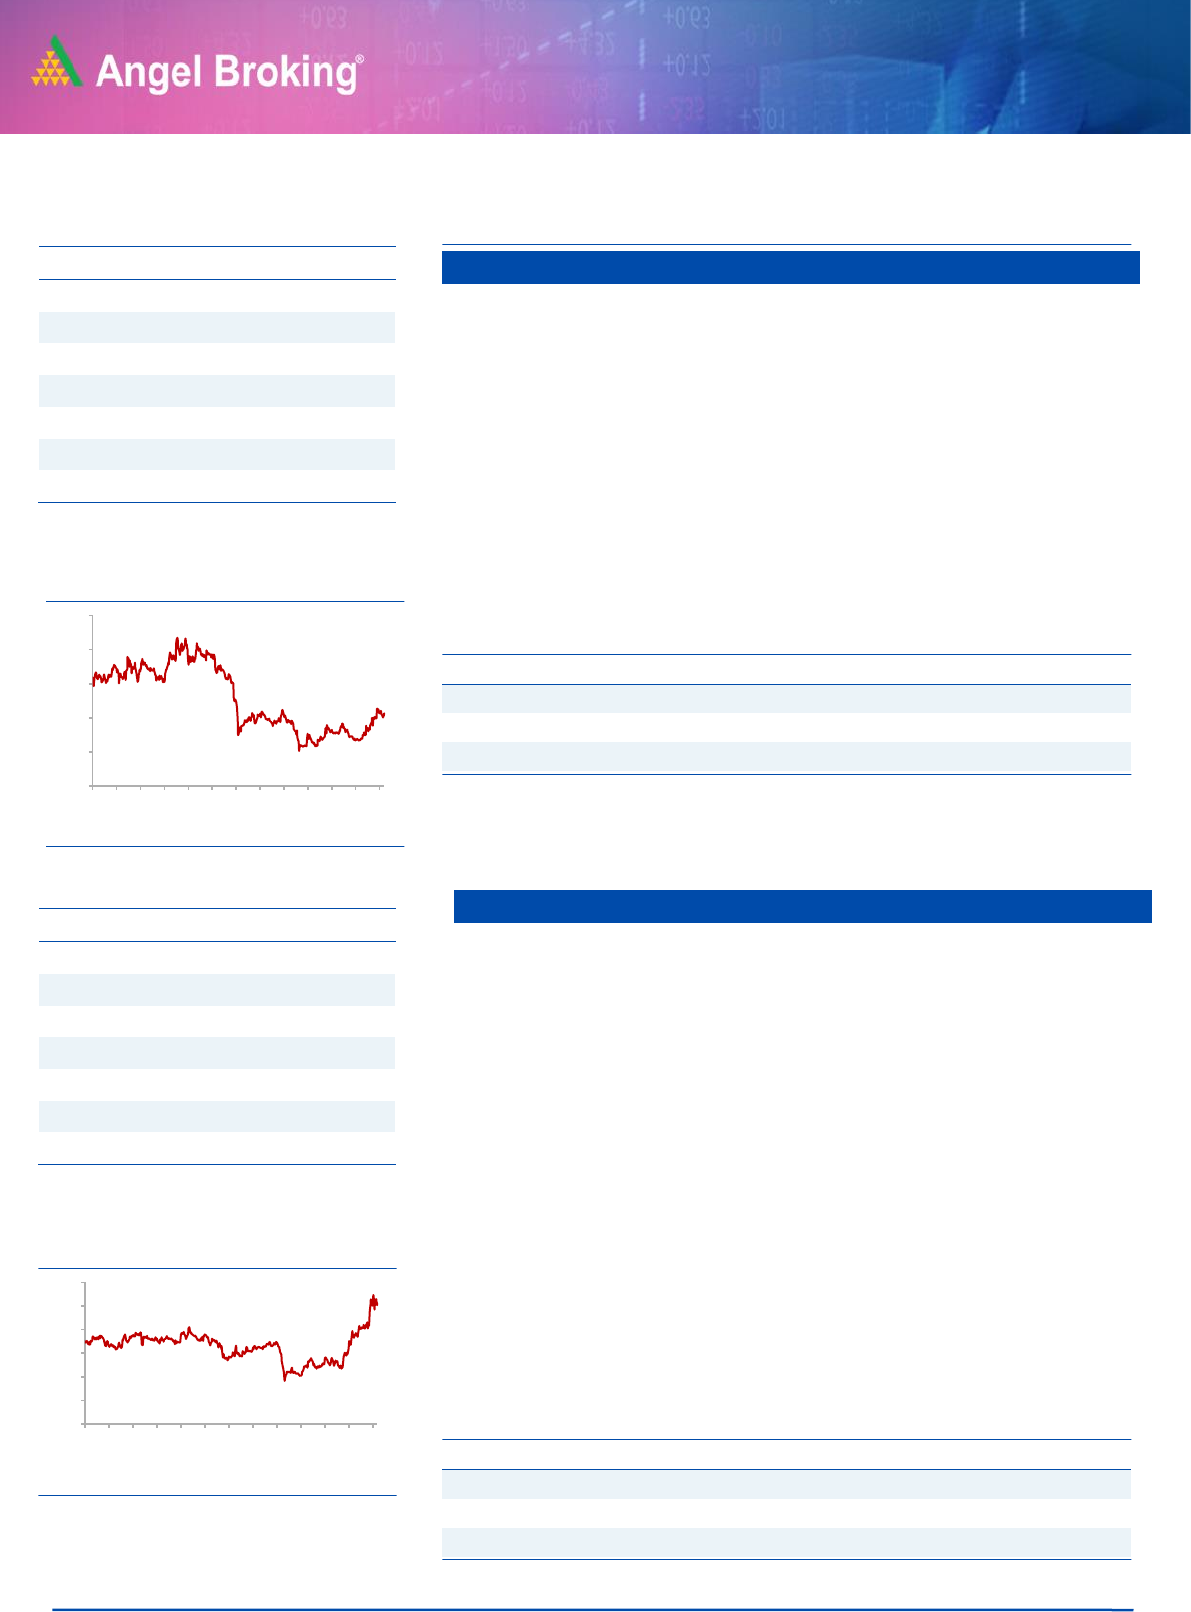
3 year-Chart
Source: Company, Angel Research
Key Financials
Y/E
NII
NIM
PAT
EPS
ABV
ROA
ROE
P/E
P/ABV
March
(` cr)
(%)
(` cr)
(`)
(`)
(%)
(%)
(x)
(x)
FY2021E
5,911
3.1
1,428
7.2
73
0.8
9.4
12
1.2
FY2022E
7,064
3.4
1,940
9.7
83
0.9
11.5
9
1.1
Source: Company, Angel Research
-
20
40
60
80
100
120
Mar-18
Jun-18
Sep-18
Dec-18
Mar-19
May-19
Aug-19
Nov-19
Feb-20
May-20
Aug-20
Nov-20
Feb-21
Stock Info
CMP
66.8
TP
77.0
Upside
15.3%
Sector
Banking
Market Cap (` cr)
37899
Beta
1.16
52 Week High / Low
68/18
3 year-Chart
Source: Company, Angel Research
-
10
20
30
40
50
60
70
80
Mar-18
Jun-18
Sep-18
Dec-18
Mar-19
May-19
Aug-19
Nov-19
Feb-20
May-20
Aug-20
Nov-20
Feb-21
Angel Top Picks | March 2021
March 8, 2021
5
Shriram City Union
Galaxy Surfactants
Shriram City Union Finance is part of the Shriram group and is in the high
margin business of lending to small businesses which account for 57.3% of the
loan book as of end FY20. The company also provides auto, 2-wheeler, gold,
and personal loans. The company posted a good set of number s for the quarter
due to positive surprise on the asset quality front. NII for Q3FY21 was down by
1.3% YoY to Rs. 876.5 crore while PPOP was down by 2.2 YoY to Rs. 560
crores. provision during the quarter was down by 13% qoq to Rs. 175.5 crore
while profits were down by 5.7% yoy to Rs. 280 crores.
SCUF reported a strong 50% sequential growth in disbursement for the quarter
which led to a 3.7% qoq growth in AUM to ~ Rs. 28,500 crore. SCUF surprised
positively on the asset quality front Gross stage 3 loans decreased by 20bps
qoq to 6.5% in Q3FY21. Net stage 3 for the quarter was stable at 3.3% while
PCR ratio stood at 52.7%.
Galaxy Surfact.
Galaxy Surfactants is a market leader in oleochemical-based surfactants,
which is used in personal and home care products including skin care, oral
care, hair care, cosmetics, toiletries and detergent products.
The company has been increasing it’s share of high margin specialty care
products in it’s portfolio which now accounts for ~ 40% of it’s revenues while
the balance is accounted for by the performance surfactant business.
Company has very strong relationship with MNC clients like Unilever, P&G,
Henkel, Colgate-Palmolive and supplies raw materials to them not only in India
but also in US, EU and MENA region.
Y/E
Sales
OPM
PAT
EPS
ROE
P/E
P/BV
EV/Sales
March
(` cr)
(%)
(` cr)
(`)
(%)
(x)
(x)
(x)
FY2021E
2,737
16.3
295
83.1
21.9
28.4
6.5
3.1
FY2022E
3,204
16.2
344
97.2
22
24.3
5.3
2.6
Stock Info
CMP
1519
TP
1800
Upside
18.5%
Sector
Banking
Market Cap (` cr)
10023
Beta
0.51
52 Week High / Low
1610/632
3 year-Chart
Source: Company, Angel Research
Stock Info
CMP
2360
TP
2750
Upside
16.5%
Sector
Chemicals
Market Cap (` cr)
8368
Beta
0.57
52 Week High / Low
2360/1085
3 year-Chart
Source: Company, Angel Research
Key Financials
Y/E
NII
NIM
PAT
EPS
ABV
ROA
ROE
P/E
P/ABV
March
(` cr)
(%)
(` cr)
(`)
(`)
(%)
(%)
(x)
(x)
FY2021E
3,365
12
988
149.6
1,095
3.1
12.5
10
1.4
FY2022E
3,786
12.4
1,264
191.5
1,240
3.8
14
8
1.2
Source: Company, Angel Research
-
500
1,000
1,500
2,000
2,500
3,000
Mar-18
Jun-18
Sep-18
Dec-18
Mar-19
May-19
Aug-19
Nov-19
Feb-20
May-20
Aug-20
Nov-20
Feb-21
-
500
1,000
1,500
2,000
2,500
Mar-18
Jun-18
Sep-18
Dec-18
Mar-19
May-19
Aug-19
Nov-19
Feb-20
May-20
Aug-20
Nov-20
Feb-21
Angel Top Picks | March 2021
March 8, 2021
6
NRB Bearing
Escort
NRB is one of the leading supplier of bearings to Auto companies. The
company supplies bearings to two wheelers, PV, CV, Three wheelers and
tractors OEMs and has a wide customer base. The company has also been
focusing on exports markets in order to diversify its revenue base.
The company has posted a good set of numbers for Q2FY21 as revenues grew
by 4.6% YoY while PAT was up by 56% YoY. This was led by strong company.
With the Auto industry back on growth track and exports also doing well for the
company we expect the company to do well going forward. The management
has highlighted that exports growth should be in excess of 20% for FY21 driven
by demand from existing customers as well as new customers.
Y/E
Sales
OPM
PAT
EPS
ROE
P/E
P/BV
EV/Sales
March
(` cr)
(%)
(` cr)
(`)
(%)
(x)
(x)
(x)
FY2021E
697
12.2
33
3.4
6.8
34.3
2.4
1.9
FY2022E
898
15.5
72
7.4
13.2
15.8
2.1
1.5
Escorts is a prominent tractor player domestically with market share in excess
of 11%. The company’s brand of tractors is particularly strong in the northern
as well as the eastern belt of India.
With rural India relatively less impacted due to Covid-19, record food-grain
procurement by government agencies as well as better than expected Kharif
crop in 2020, we expect the tractor industry will continue to outperform the
larger automobile space in FY21 with Escorts a key beneficiary
Escorts in the recent past has also entered into a strategic partnership with
Kubota Corporation of Japan (one of the global leaders in farm machinery and
implements), which provides further visibility of growth for the company, going
forward. The company has been reporting strong growth in monthly sales
numbers so far in FY21 with sales growth of 12.5% YoY to 74,153 units in
9MFY21.
Stock Info
CMP
116.8
TP
135.0
Upside
15.6
Sector
Auto
Market Cap (` cr)
1132
Beta
0.65
52 Week High / Low
121/51
3 year-Chart
Source: Company, Angel Research
Stock Info
CMP
1318
TP
1573
Upside
19.3%
Sector
Auto
Market Cap (` cr)
17775
Beta
1.18
52 Week High / Low
1442/551
3 year-Chart
Source: Company, Angel Research
Key Financials
Y/E
Sales
OPM
PAT
EPS
ROE
P/E
P/BV
EV/Sales
March
(` cr)
(%)
(` cr)
(`)
(%)
(x)
(x)
(x)
FY2021E
6,562
16.1
801
59.4
15.7
23.3
3.5
2.9
FY2022E
7,415
15.6
873
64.6
14.9
21.4
3.0
2.5
Source: Company, Angel Research
-
50
100
150
200
250
Mar-18
Jun-18
Sep-18
Dec-18
Mar-19
May-19
Aug-19
Nov-19
Feb-20
May-20
Aug-20
Nov-20
Feb-21
-
100
200
300
400
500
600
Mar-18
Jun-18
Sep-18
Dec-18
Mar-19
May-19
Aug-19
Nov-19
Feb-20
May-20
Aug-20
Nov-20
Feb-21
Angel Top Picks | March 2021
March 8, 2021
7
GNA Axles
PVR
GNA Axles is one of the leading suppliers of rear axles to the Auto industry.
The company is a major supplier of rear axles to the CV industry and is
expected to be one of the biggest beneficiaries of the revival in the CV
cycle. The company derives 60% of its revenues from exports while the
balance 40% of the company’s revenues comes from the domestic markets.
GNA is expected to be one of the biggest beneficiaries of strong growth outlook
for truck sales in US and Europe markets which are witnessing strong recovery
in demand. US which accounts for almost 40% of the company's revenues has
been registering strong class 8 truck sales.
The venture into the SUV axle would provide the company with new growth
avenues while the recovery in the domestic CV cycle also bodes well for the
company. At current level the stock is trading at a P/E multiple of 9xFY23E EPS
estimate of Rs. 42 and offers value.
PVR is the largest multiplex chain in India with 800+ screens across
India. Multiplex screens are gaining ground in India at the expense of single
screens. Share prices have corrected significantly as most of the theaters are
operating at very low capacity utilization due to the lack of any major releases
due to the Covid-19 crisis.
However, with a significant decrease in Covid-19 cases over the past few
months we believe that it’s a matter of time before we see new releases by
production houses post April 2021 which should lead to significant increase in
business for the companies.
Stock Info
CMP
394.6
TP
500.0
Upside
26.7%
Sector
Auto
Market Cap (` cr)
847
Beta
0.55
52 Week High / Low
416/133
3 year-Chart
Source: Company, Angel Research
Stock Info
CMP
1452.6
TP
1800.0
Upside
23.9%
Sector
Other
Market Cap (` cr)
8930
Beta
0.78
52 Week High / Low
1683/732
3 year-Chart
Source: Company, Angel Research
Key Financials
Y/E
Sales
OPM
PAT
EPS
ROE
P/E
P/BV
EV/Sales
March
(` cr)
(%)
(` cr)
(`)
(%)
(X)
(X)
(X)
FY2021E
841
15.2
51
23.8
10.4
16.6
1.7
1.1
FY2022E
1009
15.8
73
33.9
13.1
11.6
1.5
0.9
Source: Company, Angel Research
Key Financials
Y/E
Sales
OPM
PAT
EPS
ROE
P/E
P/BV
EV/Sales
March
(` cr)
(%)
(` cr)
(`)
(%)
(X)
(X)
(X)
FY2021E
2,057
2.8
-209
-40.8
-11.9
-35.6
4.6
3.6
FY2022E
3,775
15.9
127
24.7
7.5
58.8
4.3
2.0
Source: Company, Angel Research
-
100
200
300
400
500
600
Mar-18
Jun-18
Sep-18
Dec-18
Mar-19
May-19
Aug-19
Nov-19
Feb-20
May-20
Aug-20
Nov-20
Feb-21
-
500
1,000
1,500
2,000
2,500
Mar-18
Jun-18
Sep-18
Dec-18
Mar-19
May-19
Aug-19
Nov-19
Feb-20
May-20
Aug-20
Nov-20
Feb-21
Please refer to important disclosures at the end of this report
8
Angel Top Picks – March 2021
Carborundum Universal
JK Lakshmi
Met
JK Lakshmi promoted by Singhania group is a predominantly north India
cement company with capacity of 13.3 Mn Mt.
Currently, north India is favorable location for the cement industry as it is
consolidated to a large extent as well as demand and supply outlook is better
compared to other locations. So far FY21 numbers of the company were better
compared to its peers due to favorable regional presence.
Power & fuel are important line items of cost for cement companies. Lower cost
inventory of petcock will help the company to report better margins for the
upcoming quarter on YoY basis.
Carborundum Universal (CUMI) is part of the Murugappa group and is
a leading manufacturer of abrasives, industrial ceramics, refractories, and
electro minerals in India having application across diversified user
industries. The company is expected to benefit from improving demand
scenarios across its end user industries such as auto, auto components,
engineering, basic metals, infrastructure, and power.
While demand from the Auto sector has been robust we expect demand from
metal industry pick up given increased economic activity. The company has
posted a robust set of numbers for Q3Fy21 with revenues increasing by
13.0% yoy to Rs. 730 crore driven by domestic growth.
Overseas operations were impacted due to the second wave of Covid-19.
EBIDTA for the quarter was up by 37.8% YoY to Rs. 123 crore while EBIDTA
margins also improved to 16.9%. Net profit for the quarter was up by
39.5% YoY to Rs. 87.7 crore.
Stock Info
CMP
428.2
TP
470.0
Upside
10%
Sector
Cement
Market Cap (` cr)
5039
Beta
0.67
52 Week High / Low
434/181
Key Financials
Y/E
Sales
OPM
PAT
EPS
ROE
P/E
P/BV
EV/Sales
March
(` cr)
(%)
(` cr)
(`)
(%)
(x)
(x)
(x)
FY2021E
4359
18.2
326
27.7
14.5
15.5
2.5
1.3
FY2022E
4729
17.2
357
30.3
17.5
14.2
2.2
1.1
Source: Company, Angel Research (Standalone nos.)
Stock Info
CMP
502.9
TP
600
Upside
19.3%
Sector
Other
Market Cap (` cr)
9530
Beta
0.64
52 Week High / Low
546/182
Key Financials
Y/E
Sales
OPM
PAT
EPS
ROE
P/E
P/BV
EV/Sales
March
(` cr)
(%)
(` cr)
(`)
(%)
(X)
(X)
(X)
FY2021E
2638
15.5
280
14.8
13.6
34.0
4.6
3.5
FY2022E
3166
16.0
348
18.4
15.0
27.4
4.1
2.9
Source: Company, Angel Research
3 year-Chart
Source: Company, Angel Research
-
50
100
150
200
250
Feb-18
May-18
Jul-18
Oct-18
Jan-19
Apr-19
Jul-19
Oct-19
Jan-20
Apr-20
Jul-20
Oct-20
Jan-21
3 year-Chart
Source: Company, Angel Research
-
100
200
300
400
500
600
Mar-18
Jun-18
Sep-18
Dec-18
Mar-19
May-19
Aug-19
Nov-19
Feb-20
May-20
Aug-20
Nov-20
Feb-21

Angel Top Picks | March 2021
March 8, 2021
9
Changes in Recommendation
Stocks bought in last 6 months
Stock Name
Buy Call Date
Buy Price
Hindustan Aeronautics
9/3/2020
926
Atul
10/28/2020
6,072
Galaxy Surfactants
11/4/2020
1,664
Gujarat Gas
11/24/2020
329.70
Bandhan Bank
11/25/2020
365.5
Whirlpool India
12/16/2020
2,174
Narayana Hrudayalaya
12/17/2020
414.7
NRB Bearings
12/18/2020
95.7
Ashok Leyland
1/4/2021
100.4
Escorts
1/13/2021
1387.0
L&T Fin. Holdings
1/13/2021
105.0
MindTree
1/20/2021
1756.0
Federal Bank
1/21/2021
77.6
PNC Infratech
2/4/2021
230.6
Shri.City Union
08-02-2021
1468
HCL Technologies
11-02-2021
965
GNA Axles
17-02-2021
406
PVR
04-03-2021
1494
Source: Company, Angel Research

Angel Top Picks | March 2021
March 8, 2021
10
Stocks sold in last 6 months
Stock Name
Sell Date
Exit Price
Alembic Pharma
9/2/2020
921
Britannia Industries
9/14/2020
3,786
Chalet Hotels
9/28/2020
142
Zensar Technologies
10/30/2020
179
Reliance Industries
11/2/2020
1,912
Hindustan Aeronautics
11/3/2020
681
V I P Inds.
11/17/2020
311
Endurance Tech.
11/19/2020
1,036
Inox Leisure
12/17/2020
285.2
Cholamandalam Inv & Fin Comp
12/24/2020
376.3
Bandhan Bank
1/13/2021
387
Swaraj Engines
1/13/2021
1415
Gujarat Gas
1/15/2021
371
Persistent Sys
1/15/2021
1620
L&T Fin. Holdings
1/20/2021
104.5
Atul
2/1/2021
6470
Hawkins Cookers
2/4/2021
5,710
Whirlpool India
2/4/2021
2,465
Ashok Leyland
11-02-2021
134
Metropolis Healt
11-02-2021
2120
Narayana Hrudaya
03-03-2021
430

Angel Top Picks | March 2021
March 8, 2021
11
Research Team Tel: 022 - 39357800 E-mail: [email protected] Website: www.angelbroking.com
DISCLAIMER
Angel Broking Limited (hereinafter referred to as “Angel”) is a registered Member of National Stock Exchange of India Limited, Bombay
Stock Exchange Limited, Metropolitan Stock Exchange Limited, Multi Commodity Exchange of India Ltd and National Commodity &
Derivatives Exchange Ltd It is also registered as a Depository Participant with CDSL and Portfolio Manager and Investment Adviser
with SEBI. It also has registration with AMFI as a Mutual Fund Distributor. Angel Broking Limited is a registered entity with SEBI for
Research Analyst in terms of SEBI (Research Analyst) Regulations, 2014 vide registration number INH000000164. Angel or its
associates has not been debarred/ suspended by SEBI or any other regulatory authority for accessing /dealing in securities Market.
Angel or its associates/analyst has not received any compensation / managed or co-managed public offering of securities of the
company covered by Analyst during the past twelve months.
This document is solely for the personal information of the recipient, and must not be singularly used as the basis of any investment
decision. Nothing in this document should be construed as investment or financial advice. Each recipient of this document should make
such investigations as they deem necessary to arrive at an independent evaluation of an investment in the securities of the companies
referred to in this document (including the merits and risks involved), and should consult their own advisors to determine the merits
and risks of such an investment.
Reports based on technical and derivative analysis center on studying charts of a stock's price movement, outstanding positions and
trading volume, as opposed to focusing on a company's fundamentals and, as such, may not match with a report on a company's
fundamentals. Investors are advised to refer the Fundamental and Technical Research Reports available on our website to evaluate
the contrary view, if any
The information in this document has been printed on the basis of publicly available information, internal data and other reliable sources
believed to be true, but we do not represent that it is accurate or complete and it should not be relied on as such, as this document is
for general guidance only. Angel Broking Limited or any of its affiliates/ group companies shall not be in any way responsible for any
loss or damage that may arise to any person from any inadvertent error in the information contained in this report. Angel Broking
Limited has not independently verified all the information contained within this document. Accordingly, we cannot testify, nor make any
representation or warranty, express or implied, to the accuracy, contents or data contained within this document. While Angel Broking
Limited endeavors to update on a reasonable basis the information discussed in this material, there may be regulatory, compliance, or
other reasons that prevent us from doing so.
This document is being supplied to you solely for your information, and its contents, information or data may not be reproduced,
redistributed or passed on, directly or indirectly.
Neither Angel Broking Limited, nor its directors, employees or affiliates shall be liable for any loss or damage that may arise from or in
connection with the use of this information.
Disclosure of Interest Statement
Top Picks
1. Financial interest of research analyst or Angel or his Associate or his relative
No
2. Ownership of 1% or more of the stock by research analyst or Angel or associates or
relatives
No
3. Served as an officer, director or employee of the company covered under Research
No
4. Broking relationship with company covered under Research
No
Ratings (Based on Expected Returns: Buy (> 15%) Accumulate (5% to 15%) Neutral (-5 to 5%)
Over 12 months investment period) Reduce (-5% to -15%) Sell (< -15%)
Hold (Fresh purchase not recommended)
