3QFY2016 Result Update | Banking
February 2, 2016
Yes Bank
NEUTRAL
CMP
`772
Performance Highlights
Target Price
-
Investment Period
-
Particulars (` cr)
3QFY16
2QFY16
% chg (qoq)
3QFY15
% chg (yoy)
NII
1,157
1,108
4.4
909
27.3
Pre-prov. profit
1,150
1,019
12.8
863
33.3
Stock Info
PAT
676
610
10.7
540
25.1
Sector
Banking
Source: Company, Angel Research
Market Cap (` cr)
32,434
Beta
1.6
Yes Bank reported a healthy performance during 3QFY2016 with PAT growth of
52 Week High / Low
910/ 590
25.1% yoy to `675.7cr, which is above our expectation. The NII for the bank grew strong
Avg. Daily Volume
3,343,514
by 27.3% yoy on account of strong growth in advances and Retail & CASA deposits.
Face Value (`)
10
Advances and deposits growth remains strong: During the quarter, advances grew
BSE Sensex
24,825
at a healthy pace of 26.7% yoy while deposits grew 23.1% yoy, suggesting a
Nifty
7,556
Reuters Code
YESB.BO
healthy balance sheet growth. Savings deposits continued to witness robust
Bloomberg Code
YES@IN
traction, growing by 64.1% yoy, on account of the bank’s growing retail franchise
while current deposits grew by 18.4% yoy. Overall, CASA deposits grew by 45.1%
yoy; as a result the CASA ratio improved 400bp yoy and 120bp qoq to 26.6%.
Shareholding Pattern (%)
NIM improved qoq backed by lower cost of funds: The NIM for the bank inched
Promoters
22.0
up 10bp qoq to 3.4%. During the quarter, the bank reduced the rate offered on its
MF / Banks / Indian Fls
23.6
savings deposits from 7% to 6% and this helped lower the cost of fund, thereby leading
FII / NRIs / OCBs
42.0
to improvement in margins. The non-interest income grew by 39% yoy, while operating
Indian Public / Others
12.5
expenses grew by 29.2% yoy, leading to a 33.3% yoy growth in operating profit.
Asset quality continues to be healthy: Despite the prevalent economic
Abs. (%)
3m 1yr
3yr
slowdown, the bank has maintained its asset quality strong. GNPA and NNPA
ratios went up marginally by 5bp and 2bp qoq to 0.66% and 0.22% respectively
Sensex
(6.9)
(14.9)
25.5
as compared to 0.61% (GNPA) and 0.20% (NNPA) in the sequential previous
Yes Bank
1.7
(10.5)
45.3
quarter. Restructured assets stand at `568.3cr, which represent 0.67% of gross
advances. Also, the bank indicated that there has neither been any sale to ARCs
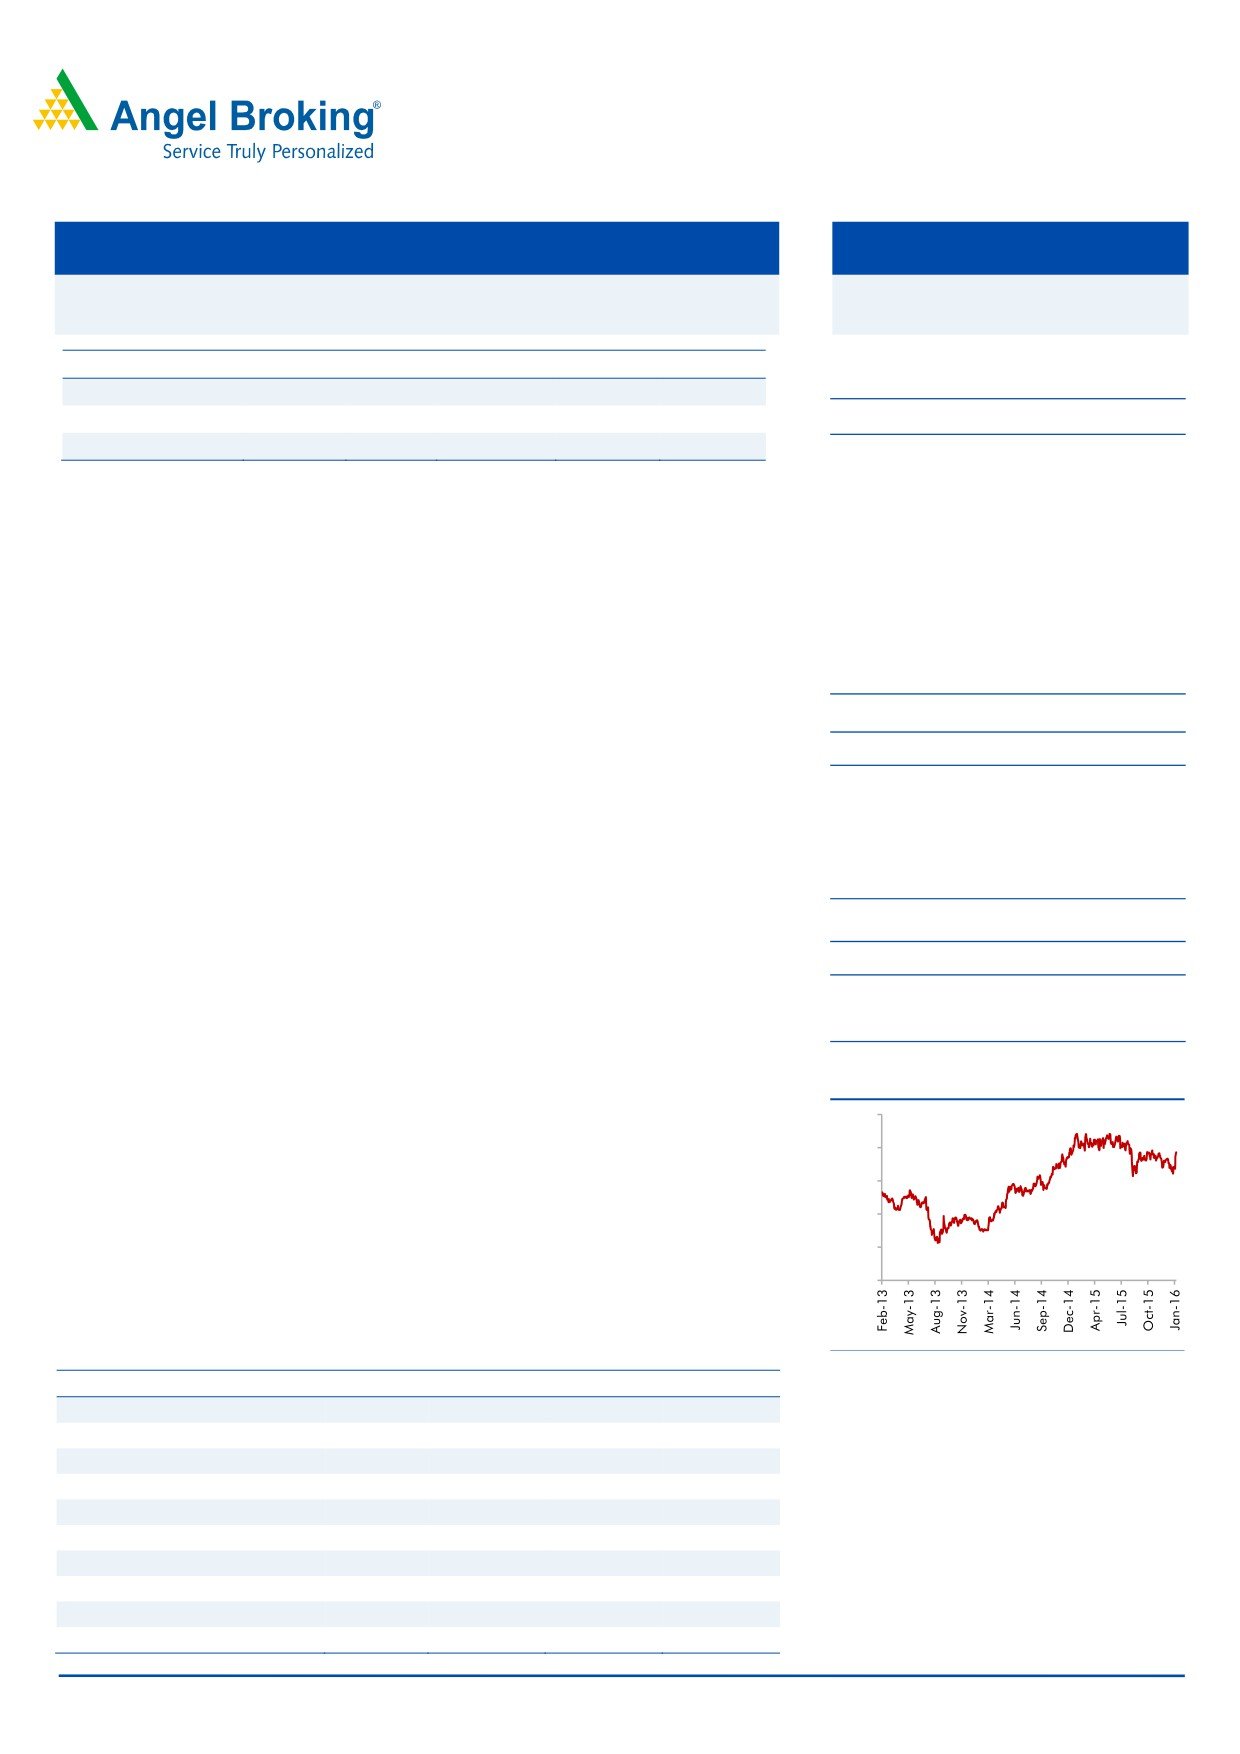
3-year price chart
nor has the bank refinanced any loan through the 5-25 route or SDR, during the
1,000
quarter. Credit cost for the quarter was at 56bp (annualized), while it has further
800
reduced its credit cost guidance for FY2016 to 50bp from 70bp earlier. The
600
Provision coverage ratio came in at 66.5% (reported).
400
Outlook and valuation: The bank’s asset quality performance has held up well
200
so far. Going forward, we expect Yes Bank to deliver a CAGR of 20.5% in earnings
0
for FY2015-17E. Currently the stock trades at 2.0x FY2017E ABV which seems to
be fully valued in our view. Hence, we recommend NEUTRAL rating on the stock.
Key financials
Source: Company, Angel Research
Y/E March (` cr)
FY2014
FY2015
FY2016E
FY2017E
NII
2,716
3,488
4,616
5,826
Vaibhav Agrawal
% chg
22.4
28.4
32.3
26.2
022 - 3935 7800 Ext: 6808
Net profit
1,618
2,005
2,433
2,910
% chg
24.4
24.0
21.3
19.6
NIM (%)
2.8
3.0
3.2
3.3
Siddharth Purohit
EPS (`)
44.9
48.0
58.2
69.7
022 - 3935 7800 Ext: 6872
P/E (x)
17.2
16.1
13.3
11.1
P/ABV (x)
3.9
2.8
2.4
2.0
Chintan Shah
RoA (%)
1.6
1.6
1.6
1.6
022 - 4000 3600 Ext: 6828
RoE (%)
25.0
21.3
19.2
19.6
Source: Company, Angel Research; Note: CMP as of February 1, 2016
Please refer to important disclosures at the end of this report
1
Yes Bank | 3QFY2016 Result Update
Exhibit 1: 3QFY2016 performance summary (standalone)
Particulars (` cr)
3QFY16
2QFY16
% chg (qoq) 3QFY15
% chg (yoy) FY2015 FY2014
% chg
Interest earned
3,376
3,377
(0.0)
2,972
13.6
11,572
9,981
15.9
- on Advances / Bills
2,421
2,415
0.3
2,071
16.9
8,016
6,540
22.6
- on investments
885
856
3.4
889
(0.4)
3,511
3,414
2.8
- on balance with RBI & others
22
52
(57.1)
11
98.0
43
24
79.5
- on others
48
54
(12.6)
1
7,215.4
2
3
(20.9)
Interest Expended
2,219
2,269
(2.2)
2,063
7.6
8,084
7,265
11.3
Net Interest Income
1,157
1,108
4.4
909
27.3
3,488
2,716
28.4
Other income
746
618
20.7
537
39.0
2,046
1,722
18.9
-Corporate Trade & Cash Management
112
101
10.9
109
2.5
356
478
(25.6)
-Forex, Debt Capital Markets & Securities
103
152
(32.7)
80
28.9
850
607
40.1
-Corporate Banking Fees
380
220
73.1
233
63.3
548
423
29.5
-Retail Banking Fees
152
145
4.4
115
31.4
293
214
36.9
Operating income
1,903
1,727
10.2
1,446
31.6
5,534
4,438
24.7
Operating expenses
753
707
6.5
583
29.2
2,285
1,750
30.6
- Employee expenses
343
313
9.5
254
34.8
980
784
24.9
- Other Opex
411
395
4.1
329
24.9
1,305
965
35.2
Pre-provision Profit
1,150
1,019
12.8
863
33.3
3,250
2,688
20.9
Provisions & Contingencies
148
104
42.3
70
111.8
339
362
(6.1)
PBT
1,002
915
9.5
793
26.3
2,910
2,326
25.1
Provision for Tax
326
305
6.9
253
29.0
905
709
27.7
PAT
676
610
10.7
540
25.1
2,005
1,618
24.0
Effective Tax Rate (%)
32.5
33.3
(76)bp
31.9
68bp
31.1
30.5
2.1
Source: Company, Angel Research
February 2, 2016
2
Yes Bank | 3QFY2016 Result Update
Exhibit 2: 3QFY2016 performance analysis (standalone)
Particulars
3QFY16 2QFY16
% chg (qoq) 3QFY15
% chg (yoy)
Balance sheet
Advances (` cr)
84,396
80,015
5.5
66,607
26.7
Deposits (` cr)
1,01,437
99,344
2.1
82,370
23.1
Credit-to-Deposit Ratio (%)
83.2
80.5
266bp
80.9
234bp
Current deposits (` cr)
9,152
8,554
7.0
7,730
18.4
Savings deposits (` cr)
17,868
16,764
6.6
10,890
64.1
CASA deposits (` cr)
27,019
25,318
6.7
18,623
45.1
CASA ratio (%)
26.6
25.5
115bp
22.6
403bp
CAR (%)*
16.1
14.9
120bp
16.7
(60)bp
CET 1 CAR (%)*
10.9
10.9
0bp
11.9
(100)bp
Profitability Ratios (%)
Yield on advances
11.6
11.6
0bp
12.2
(60)bp
Cost of funds
7.3
7.3
0bp
8.1
(80)bp
Reported NIM
3.4
3.3
10bp
3.2
20bp
Cost-to-income ratio
39.6
41.0
(138)bp
40.3
(74)bp
Asset quality
Gross NPAs (` cr)
687
491
39.9
279
146.7
Gross NPAs (%)
0.66
0.61
5bp
0.42
24bp
Net NPAs (` cr)
187
159
18.0
65
190.1
Net NPAs (%)
0.22
0.20
2bp
0.10
12bp
Provision Coverage Ratio (%)
72.8
67.7
505bp
76.8
(404)bp
Provisions to avg. assets (%)
0.4
0.3
12bp
0.3
19bp
Source: Company, Angel Research, Note: *Basel III including profits
Advances as well as deposit growth remained strong
During the quarter, advances grew at a healthy pace of 26.7% yoy while deposits
grew 23.1% yoy, suggesting a healthy balance sheet growth. Savings deposits
continued to witness robust traction, growing by 64.1% yoy, on account of the
bank’s growing retail franchise while current deposits grew by 18.4% yoy. Overall,
CASA deposits grew by 45.1% yoy; as a result the CASA ratio improved 400bp yoy
and 120bp qoq to 26.6%.
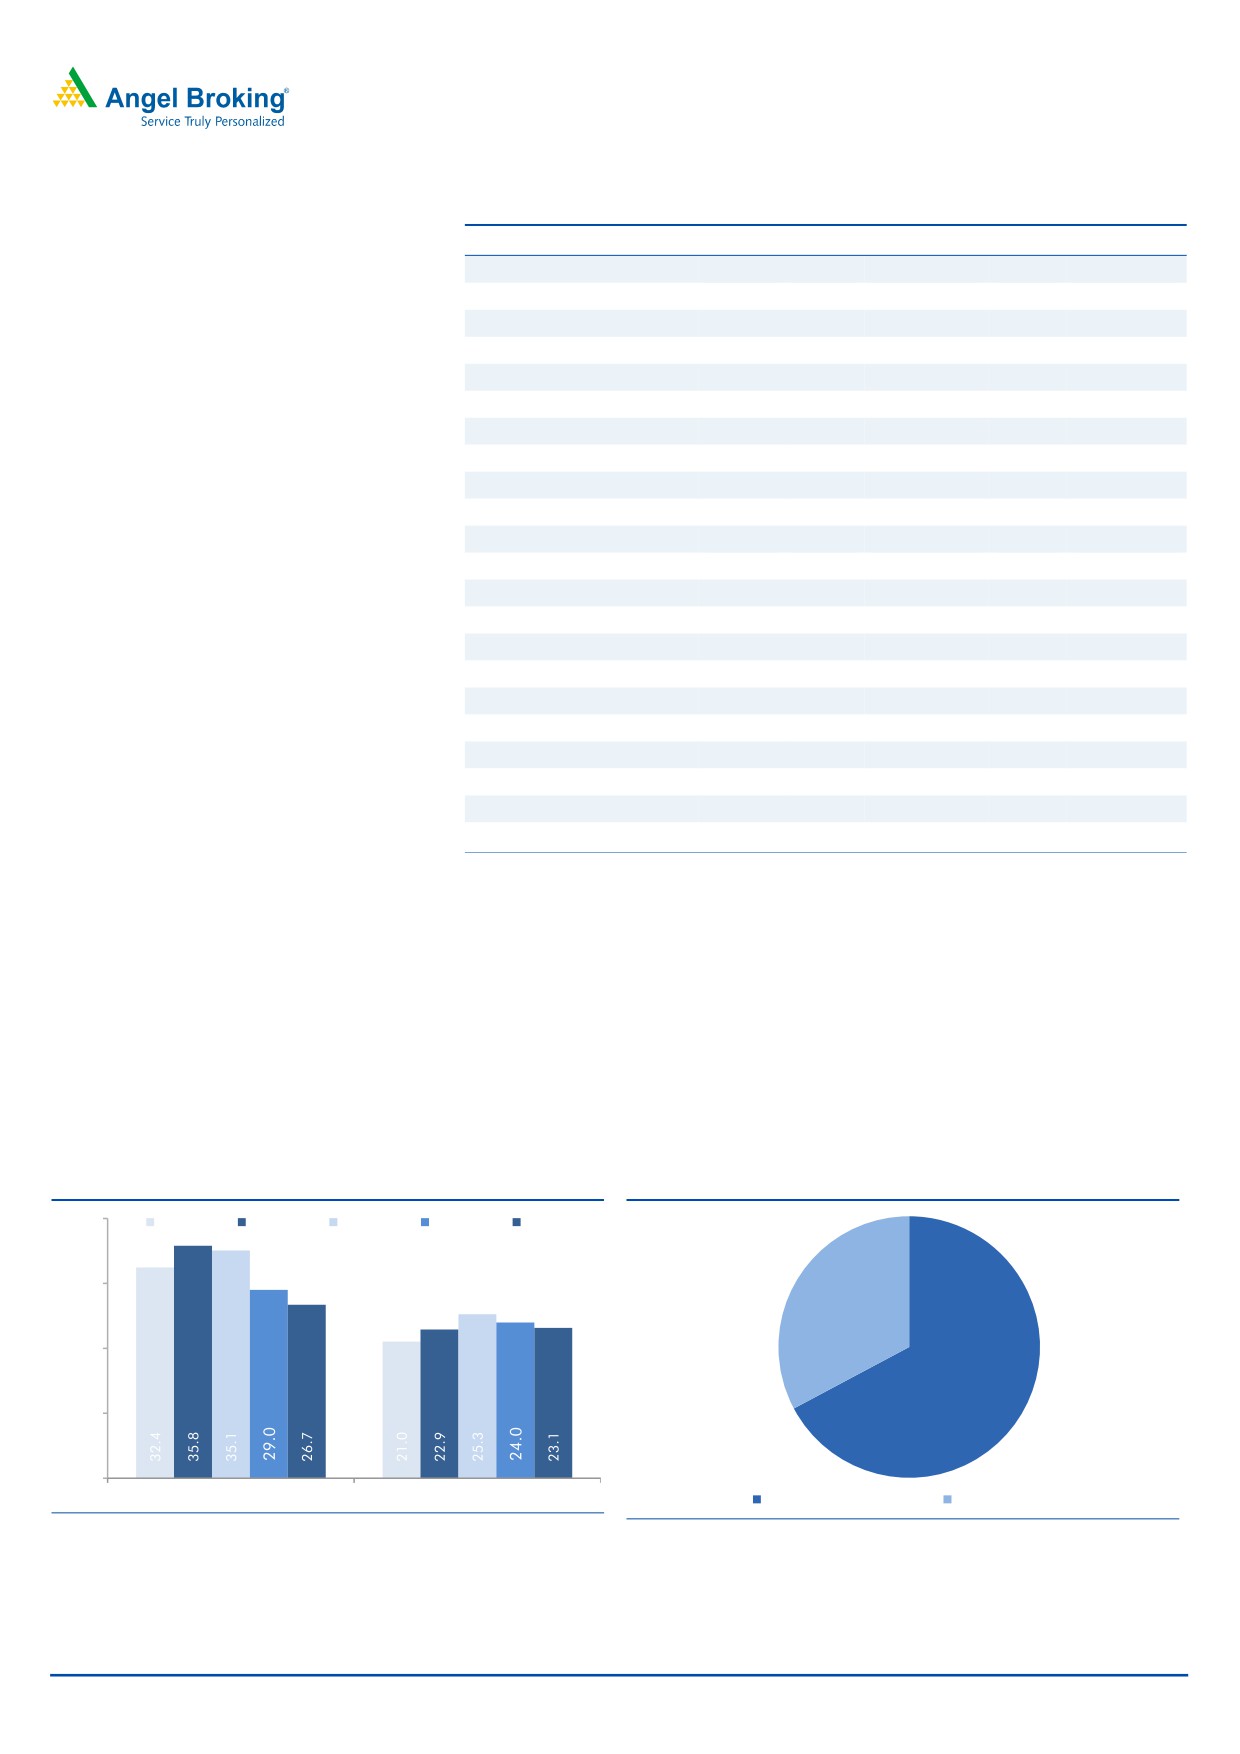
Exhibit 3: Healthy loan book growth continues
Exhibit 4: Business segment breakup as of 3QFY2016
40.0
3QFY15
4QFY15
1QFY16
2QFY16
3QFY16
30.0
32.8
20.0
67.2
10.0
-
Advances yoy growth (%)
Deposits yoy growth (%)
Corp. and Insti. Banking
Branch Banking
Source: Company, Angel Research
Source: Company, Angel Research
February 2, 2016
3
Yes Bank | 3QFY2016 Result Update
NIM improved qoq backed by lower cost of funds
The NIM for the bank inched up 10bp qoq to 3.4%. During the quarter, the bank
reduced the rate offered on its savings deposits from 7% to 6% and this helped
lower the cost of fund, thereby leading to improvement in margins. The non-
interest income grew by 39% yoy, while operating expenses grew by 29.2% yoy,
leading to a 33.3% yoy growth in operating profit.
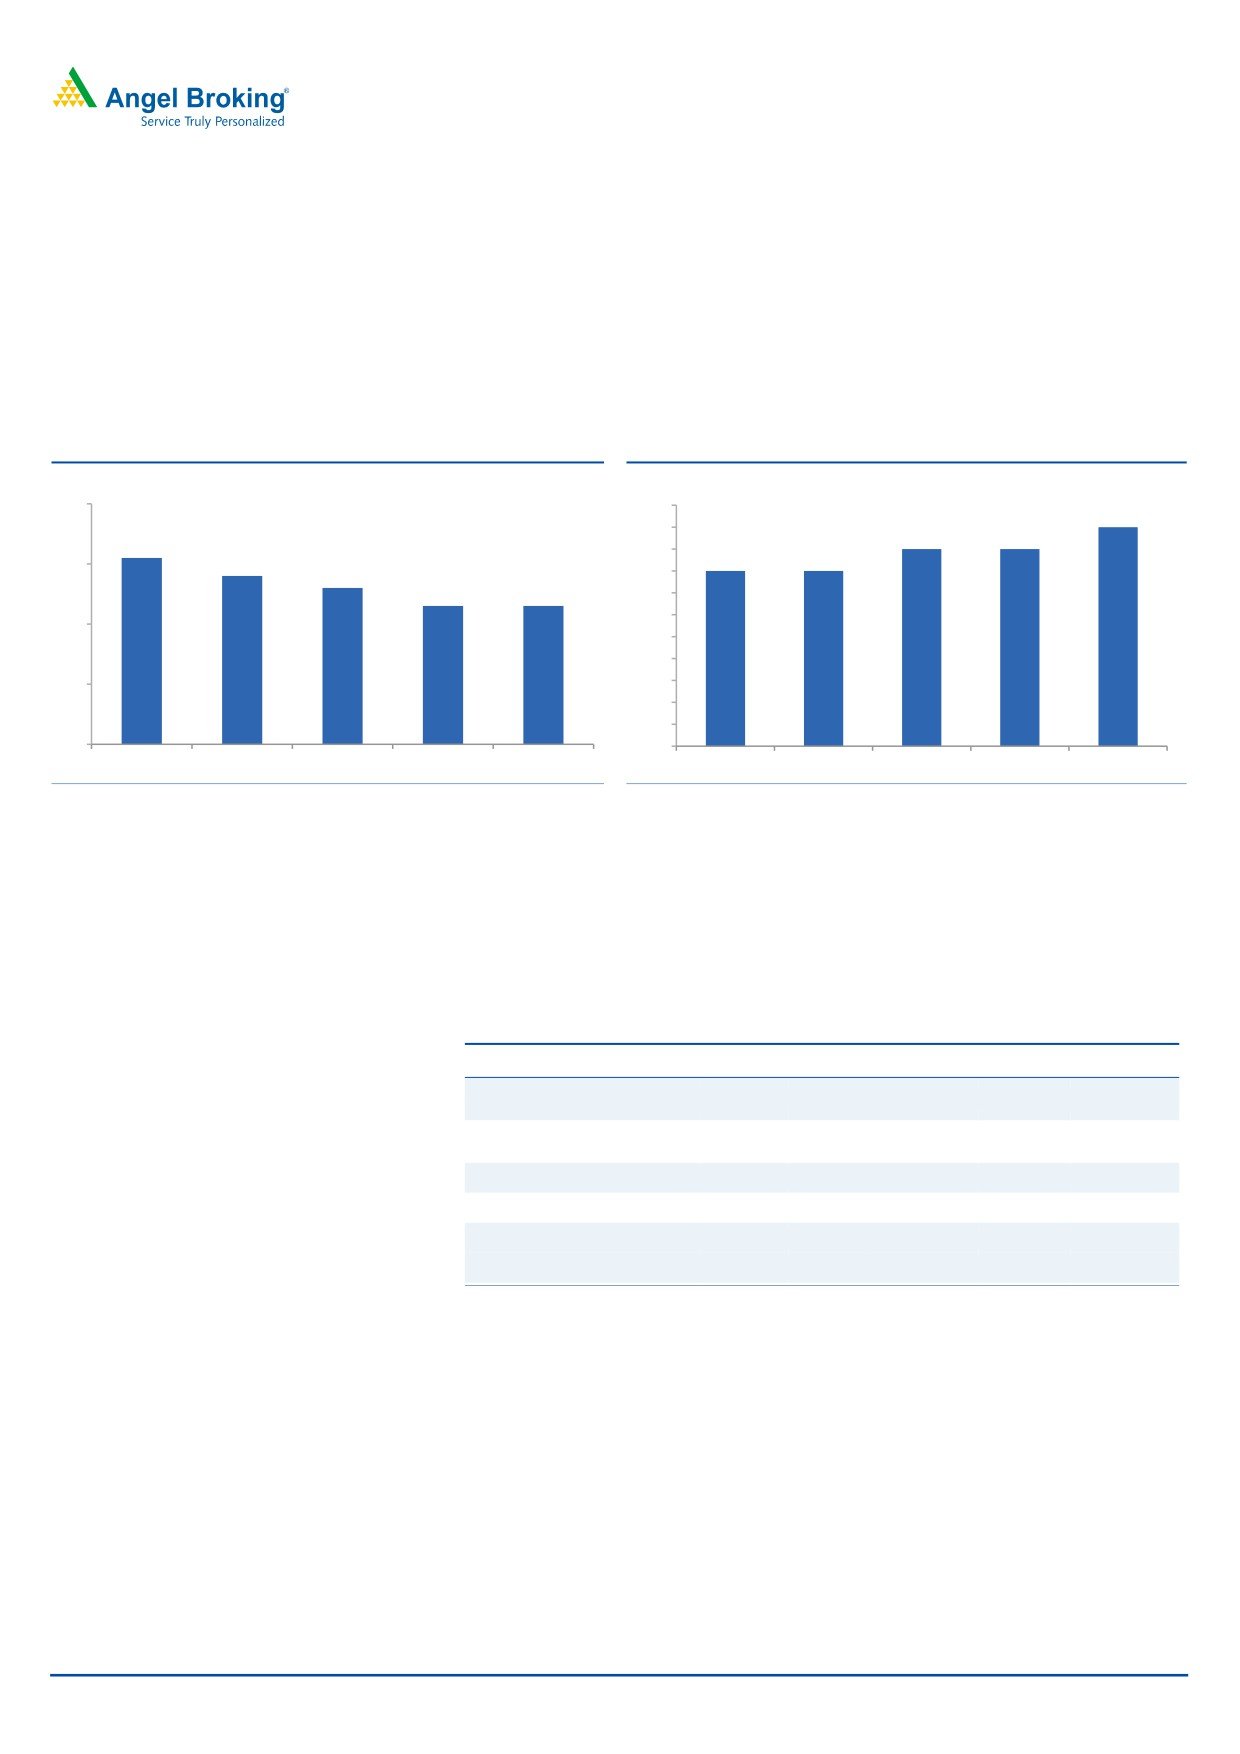
Exhibit 5: Cost of funds stable qoq; dips 80bp yoy
Exhibit 6: NIM jumps 10bp qoq to 3.40%
(%)
(%)
9
3.5
3.4
3.4
3.3
3.3
8.1
3.3
3.2
3.2
8
7.8
7.6
3.2
7.3
7.3
3.1
3.0
7
2.9
2.8
6
2.7
2.6
2.5
5
2.4
3QFY15
4QFY15
1QFY16
2QFY16
3QFY16
3QFY15
4QFY15
1QFY16
2QFY16
3QFY16
Source: Company, Angel Research
Source: Company, Angel Research
Strong non-interest income growth
The non-interest income grew at a faster pace, ie at 39.0% yoy to `746.1cr. The
growth in retail banking fees witnessed a bit of a slowdown as compared to the
sequential previous quarter. However, it still continues to grow at a healthy pace.
Exhibit 7: Non-int. Inc. performance
Particulars (` cr)
3QFY16
2QFY16
% chg (qoq) 3QFY15
% chg (yoy)
Corporate Trade & Cash
112
101
10.9
109
2.5
Management
Forex, Debt Capital Markets
103
152
(32.7)
80
28.9
& Securities
Corporate Banking Fees
380
220
73.1
233
63.3
Retail Banking Fees
152
145
4.4
115
31.4
Total other income
746
618
20.7
537
39.0
Other income excl. Treasury
644
466
38.2
457
40.7
Source: Company, Angel Research
Asset quality continues to be healthy
Despite the prevalent economic slowdown, the bank has maintained its asset
quality strong. GNPA and NNPA ratios went up marginally by 5bp and 2bp qoq to
0.66% and 0.22% respectively as compared to 0.61% (GNPA) and 0.20% (NNPA)
in the sequential previous quarter. Restructured assets stand at `568.3cr, which
represent 0.67% of gross advances. Also, the bank indicated that there has neither
been any sale to ARCs nor has the bank refinanced any loan through the 5-25
route or SDR, during the quarter. Credit cost for the quarter was at 56bp
(annualized), while it has further reduced its credit cost guidance for FY2016 to
50bp from 70bp earlier. The Provision coverage ratio came in at 66.5% (reported).
February 2, 2016
4
Yes Bank | 3QFY2016 Result Update
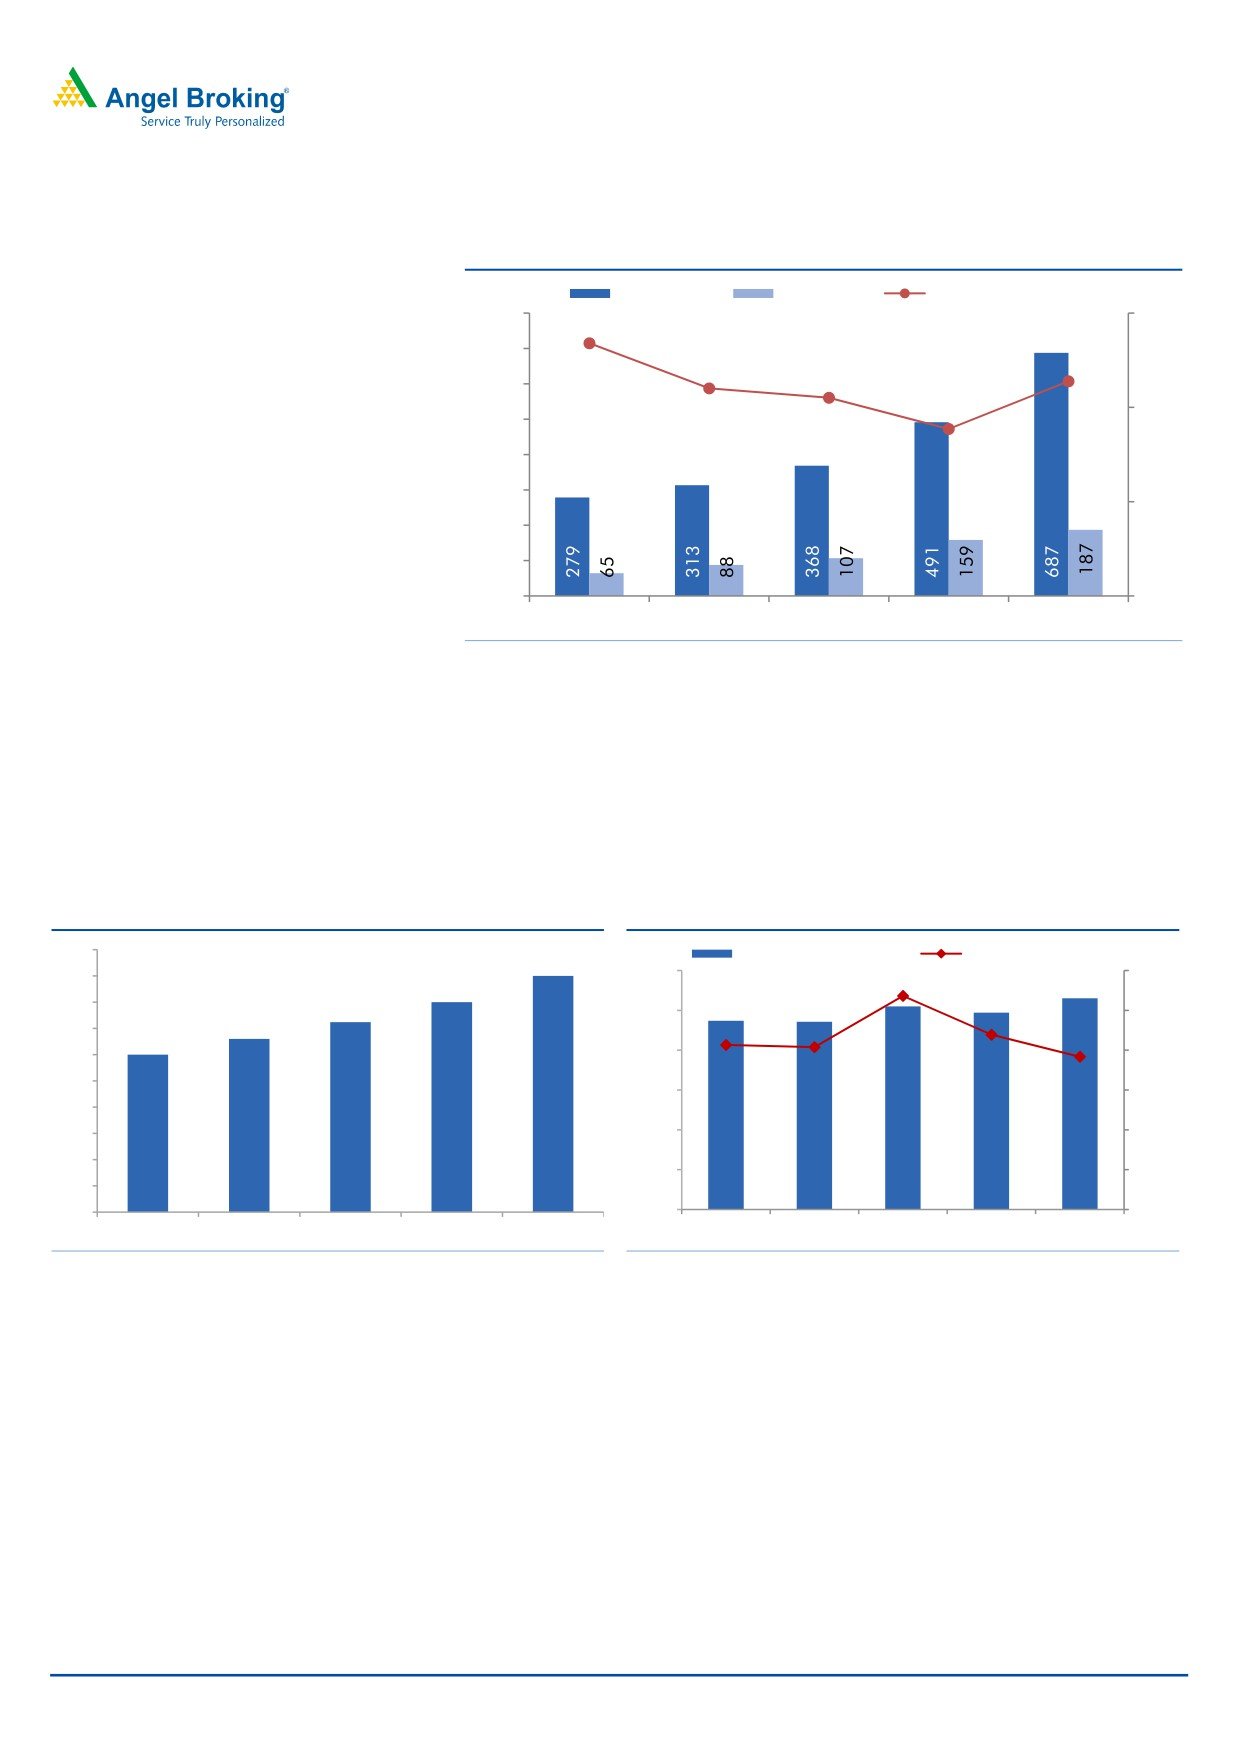
Exhibit 8: Asset quality amongst the top in the industry
Gross NPA
Net NPA
NPA coverage % (RHS)
800
80
77
700
73
72
71
600
68
70
500
400
300
60
200
100
-
50
3QFY15
4QFY15
1QFY16
2QFY16
3QFY16
Source: Company, Angel Research
Steady network expansion continues
The bank added
50 branches since 2QFY2016 and
150 branches since
3QFY2015, taking the total number of branches to 750. This aided the bank to
increase the CASA ratio from 22.6% in 3QFY2015 to 26.6% in 3QFY2016. The
cost to income ratio declined by 74bp yoy to 39.6%.
Exhibit 9: Steady branch network expansion continues
Exhibit 10: Cost to Income ratio declines qoq to 39.6%
800
Opex to avg assets (%, RHS)
Cost-to-income ratio (%)
750
750
45.0
2.2
700
700
662
42.5
2.0
630
43.4
650
600
600
40.0
1.8
41.0
40.3
40.2
550
39.6
37.5
1.6
500
450
35.0
1.4
400
32.5
1.2
350
1.9
1.9
2.0
2.0
2.1
300
30.0
1.0
3QFY15
4QFY15
1QFY16
2QFY16
3QFY16
3QFY15
4QFY15
1QFY16
2QFY16
3QFY16
Source: Company, Angel Research
Source: Company, Angel Research
February 2, 2016
5
Yes Bank | 3QFY2016 Result Update
Outlook and valuation
The bank’s asset quality performance has held up well so far. Going forward, we
expect Yes Bank to deliver a CAGR of 20.5% in earnings over FY2015-17E.
Currently the stock trades at 2.0x FY2017E ABV which seems to be fully valued in
our view. Hence, we recommend NEUTRAL rating on the stock.
Exhibit 11: Recommendation summary
CMP
Tgt. Price
Upside
FY2017E
FY2017E
FY2017E
FY15-17E
FY2017E
FY2017E
Company
Reco.
(`)
(`)
(%)
P/ABV (x)
Tgt. P/ABV (x)
P/E (x)
EPS CAGR (%)
RoA (%)
RoE (%)
HDFCBk
Buy
1,061
1,262
18.9
3.2
3.8
17.4
22.4
1.9
19.7
ICICIBk*
Buy
217
254
16.9
1.5
1.3
8.9
13.5
1.6
14.7
YesBk
Neutral
772
-
-
2.0
2.0
11.1
20.5
1.6
19.6
AxisBk
Buy
399
494
23.7
1.6
2.0
9.2
18.4
1.8
18.9
SBI*
Buy
173
202
16.7
0.8
0.8
7.1
17.8
0.7
12.7
FedBk
Neutral
47
-
-
0.9
0.9
8.5
(2.9)
0.9
10.8
SIB
Neutral
19
-
-
0.7
0.7
5.6
21.6
0.7
11.6
BOB
Neutral
122
-
-
0.6
0.7
5.8
17.5
0.6
10.6
PNB
Neutral
90
-
-
0.4
0.4
3.3
28.5
0.7
12.0
BOI
Neutral
98
-
-
0.2
0.7
2.9
14.0
0.3
7.6
IndBk
Neutral
92
-
-
0.3
0.3
3.1
19.4
0.6
8.6
Vijaya Bank
Neutral
31
-
-
0.4
0.4
4.6
14.1
0.4
8.8
OBC
Neutral
109
-
-
0.2
0.3
2.4
65.5
0.5
9.4
Allahabad Bank Neutral
52
-
-
0.2
0.2
1.9
56.2
0.6
11.9
UnionBk
Neutral
126
-
-
0.4
0.3
3.2
18.1
0.6
11.4
CanBk
Neutral
188
-
-
0.3
0.2
2.7
12.0
0.6
11.2
IDBI#
Neutral
59
-
-
0.4
0.5
4.1
61.6
0.6
9.3
DenaBk
Neutral
36
-
-
0.3
0.4
3.5
45.6
0.4
7.9
Source: Company, Angel Research; Note:*Target multiples=SOTP Target Price/ABV (including subsidiaries), #Without adjusting for SASF
February 2, 2016
6
Yes Bank | 3QFY2016 Result Update
Company Background
Yes Bank is the youngest private sector bank in the country, promoted by
professional bankers. The bank started its operations in CY2004 and has been
growing at a scorching pace, focusing on niche assets to maintain profitable
margins and asset quality. The bank's thrust so far has been primarily on
wholesale banking operations for mid-sized corporate. Now aiming for a higher
share of retail deposits, the bank has increased its network to 750 branches which
is approximately 82% growth in the past three years (targeting the urban affluent
segment).
Income statement
Y/E March (` cr)
FY11
FY12
FY13
FY14 FY15P FY16E FY17E
Net Interest Income
1,247
1,616
2,219
2,716
3,488
4,616
5,826
- YoY Growth (%)
58.2
29.6
37.3
22.4
28.4
32.3
26.2
Other Income
623
857
1,258
1,722
2,046
2,574
3,185
- YoY Growth (%)
8.3
37.5
46.7
36.9
18.9
25.8
23.7
Operating Income
1,870
2,473
3,476
4,438
5,534
7,190
9,011
- YoY Growth (%)
37.2
32.2
40.6
27.7
24.7
29.9
25.3
Operating Expenses
680
933
1,335
1,750
2,285
2,978
3,766
- YoY Growth (%)
35.9
37.2
43.1
31.1
30.6
30.4
26.5
Pre - Provision Profit
1,190
1,540
2,142
2,688
3,250
4,212
5,245
- YoY Growth (%)
37.9
29.4
39.1
25.5
20.9
29.6
24.5
Prov. & Cont.
98
90
216
362
339
635
795
- YoY Growth (%)
(28.2)
(8.1)
139.3
67.5
(6.1)
87.0
25.3
Profit Before Tax
1,092
1,450
1,926
2,326
2,910
3,577
4,450
- YoY Growth (%)
50.3
32.8
32.8
20.8
25.1
22.9
24.4
Prov. for Taxation
365
473
625
709
905
1,145
1,540
- as a % of PBT
33.4
32.6
32.5
30.5
31.1
32.0
34.6
PAT
727
977
1,301
1,618
2,005
2,433
2,910
- YoY Growth (%)
52.2
34.4
33.1
24.4
24.0
21.3
19.6
February 2, 2016
7
Yes Bank | 3QFY2016 Result Update
Balance sheet
Y/E March (` cr)
FY11
FY12
FY13
FY14
FY15P
FY16E
FY17E
Share Capital
347
353
359
361
418
418
418
Reserves & Surplus
3,447
4,324
5,449
6,761
11,262
13,234
15,609
Deposits
45,939
49,152
66,956
74,192
91,176
1,14,882
1,45,900
- Growth (%)
71.4
7.0
36.2
10.8
22.9
26.0
27.0
Borrowings
3,333
9,343
14,148
14,543
19,788
21,870
26,053
Tier 2 Capital
3,358
4,813
6,774
6,771
6,433
6,111
5,806
Other Liab. & Prov.
2,583
5,677
5,419
6,388
7,094
8,545
10,555
Total Liabilities
59,007
73,662
99,104
1,09,016
1,36,170
1,65,060
2,04,341
Cash Balances
3,076
2,333
3,339
4,542
5,241
5,744
7,295
Bank Balances
420
1,253
727
1,350
2,317
2,476
3,065
Investments
18,829
27,757
42,976
40,950
46,605
52,319
61,504
Advances
34,364
37,989
47,000
55,633
75,550
96,704
1,22,814
- Growth (%)
54.8
10.5
23.7
18.4
35.8
28.0
27.0
Fixed Assets
132
177
230
293
319
375
450
Other Assets
2,186
4,153
4,833
6,247
6,139
7,442
9,213
Total Assets
59,007
73,662
99,104
1,09,016
1,36,170
1,65,060
2,04,341
- Growth (%)
62.2
24.8
34.5
10.0
24.9
21.2
23.8
February 2, 2016
8
Yes Bank | 3QFY2016 Result Update
Ratio analysis
Y/E March
FY11
FY12
FY13
FY14
FY15P
FY16E
FY17E
Profitability ratios (%)
NIMs
2.7
2.6
2.7
2.8
3.0
3.2
3.3
Cost to Income Ratio
36.3
37.7
38.4
39.4
41.3
41.4
41.8
RoA
1.5
1.5
1.5
1.6
1.6
1.6
1.6
RoE
21.1
23.1
24.8
25.0
21.3
19.2
19.6
B/S ratios (%)
CASA Ratio
10.3
15.0
18.9
22.0
23.1
24.7
26.3
Credit/Deposit Ratio
74.8
77.3
70.2
75.0
82.9
84.2
84.2
CAR
16.5
17.9
18.3
14.4
15.8
14.5
13.2
- Tier I
9.7
9.9
9.5
9.8
12.3
11.7
11.0
Asset Quality (%)
Gross NPAs
0.2
0.2
0.2
0.3
0.4
0.9
1.2
Net NPAs
0.0
0.0
0.0
0.0
0.1
0.2
0.3
Slippages
0.2
0.2
0.6
0.8
0.8
1.2
1.2
Loan Loss Prov. /Avg. Assets
0.1
0.0
0.2
0.1
0.1
0.3
0.3
Provision Coverage
88.6
79.2
92.6
85.1
72.0
71.6
75.9
Per Share Data (`)
EPS
20.9
27.7
36.3
44.9
48.0
58.2
69.7
ABVPS (75% cover.)
109.3
132.5
162.0
197.5
279.4
326.1
383.7
DPS
2.5
4.0
6.0
8.0
8.1
9.5
11.0
Valuation Ratios
PER (x)
36.9
27.9
21.3
17.2
16.1
13.3
11.1
P/ABVPS (x)
7.1
5.8
4.8
3.9
2.8
2.4
2.0
Dividend Yield
0.3
0.5
0.8
1.0
1.0
1.2
1.4
DuPont Analysis
NII
2.6
2.4
2.6
2.6
2.8
3.1
3.2
(-) Prov. Exp.
0.2
0.1
0.2
0.3
0.3
0.4
0.4
Adj. NII
2.4
2.3
2.3
2.3
2.6
2.6
2.7
Treasury
(0.1)
0.1
0.2
0.2
0.1
0.2
0.2
Int. Sens. Inc.
2.3
2.4
2.5
2.4
2.7
2.8
2.9
Other Inc.
1.4
1.2
1.3
1.5
1.5
1.5
1.5
Op. Inc.
3.7
3.6
3.8
3.9
4.2
4.4
4.4
Opex
1.4
1.4
1.5
1.7
1.9
2.0
2.0
PBT
2.3
2.2
2.2
2.2
2.4
2.4
2.4
Taxes
0.8
0.7
0.7
0.7
0.7
0.8
0.8
RoA
1.5
1.5
1.5
1.6
1.6
1.6
1.6
Leverage
13.9
15.7
16.5
16.1
13.0
11.9
12.4
RoE
21.1
23.1
24.8
25.0
21.3
19.2
19.6
February 2, 2016
9
Yes Bank | 3QFY2016 Result Update
Research Team Tel: 022 - 39357800
DISCLAIMER
Angel Broking Private Limited (hereinafter referred to as “Angel”) is a registered Member of National Stock Exchange of India Limited,
Bombay Stock Exchange Limited and Metropolitan Stock Exchange of India Limited. It is also registered as a Depository Participant with
CDSL and Portfolio Manager with SEBI. It also has registration with AMFI as a Mutual Fund Distributor. Angel has received in-principal
approval from SEBI for registering as a Research Entity in terms of SEBI (Research Analyst) Regulations, 2014. Angel or its associates
has not been debarred/ suspended by SEBI or any other regulatory authority for accessing /dealing in securities Market. Angel or its
associates including its relatives/analyst do not hold any financial interest/beneficial ownership of more than 1% in the company
covered by Analyst. Angel or its associates/analyst has not received any compensation / managed or co-managed public offering of
securities of the company covered by Analyst during the past twelve months. Angel/analyst has not served as an officer, director or
employee of company covered by Analyst and has not been engaged in market making activity of the company covered by Analyst.
This document is solely for the personal information of the recipient, and must not be singularly used as the basis of any investment
decision. Nothing in this document should be construed as investment or financial advice. Each recipient of this document should
make such investigations as they deem necessary to arrive at an independent evaluation of an investment in the securities of the
companies referred to in this document (including the merits and risks involved), and should consult their own advisors to determine
the merits and risks of such an investment.
Reports based on technical and derivative analysis center on studying charts of a stock's price movement, outstanding positions and
trading volume, as opposed to focusing on a company's fundamentals and, as such, may not match with a report on a company's
fundamentals.
The information in this document has been printed on the basis of publicly available information, internal data and other reliable
sources believed to be true, but we do not represent that it is accurate or complete and it should not be relied on as such, as this
document is for general guidance only. Angel Broking Pvt. Limited or any of its affiliates/ group companies shall not be in any way
responsible for any loss or damage that may arise to any person from any inadvertent error in the information contained in this report.
Angel Broking Pvt. Limited has not independently verified all the information contained within this document. Accordingly, we cannot
testify, nor make any representation or warranty, express or implied, to the accuracy, contents or data contained within this document.
While Angel Broking Pvt. Limited endeavors to update on a reasonable basis the information discussed in this material, there may be
regulatory, compliance, or other reasons that prevent us from doing so.
This document is being supplied to you solely for your information, and its contents, information or data may not be reproduced,
redistributed or passed on, directly or indirectly.
Neither Angel Broking Pvt. Limited, nor its directors, employees or affiliates shall be liable for any loss or damage that may arise from
or in connection with the use of this information.
Note: Please refer to the important ‘Stock Holding Disclosure' report on the Angel website (Research Section). Also, please refer to the
latest update on respective stocks for the disclosure status in respect of those stocks. Angel Broking Pvt. Limited and its affiliates may
have investment positions in the stocks recommended in this report.
Disclosure of Interest Statement
Yes Bank
1. Analyst ownership of the stock
No
2. Angel and its Group companies ownership of the stock
No
3. Angel and its Group companies' Directors ownership of the stock
No
4. Broking relationship with company covered
No
Note: We have not considered any Exposure below ` 1 lakh for Angel, its Group companies and Directors
Ratings (Based on expected returns
Buy (> 15%)
Accumulate (5% to 15%)
Neutral (-5 to 5%)
over 12 months investment period):
Reduce (-5% to -15%)
Sell (< -15)
February 2, 2016
10