Initiating Coverage | Recreation/Amusement Parks
August 31, 2015
Wonderla Holidays
BUY
CMP
`275
A joy ride candidate
Target Price
`322
Investment Period
12 Months
Investment Arguments
New amusement park at Hyderabad to boost footfalls: We expect Wonderla
Holidays to report a healthy growth in footfalls (~18% CAGR over FY2015-17E)
Stock Info
with it setting up a new amusement park in Hyderabad, which would be
Sector
Amusement Parks
operational in FY2017. The company also has plans to venture across other parts
Market Cap (` cr)
1,557
of India to cater to a wider audience. In its first year of operation in Hyderabad,
Net Debt (` cr)
(187)
we expect the company to achieve ~7 lakh footfalls with lower utilisation of
~19%. Going forward, we expect the company to be able to report strong
Beta
1.0
footfalls growth on back of increase in utilisation. Further, we expect the existing
52 Week High / Low
349 / 242
parks in Kochi and Bengaluru to post a ~4% CAGR over FY2015-17E. Moreover,
Avg. Daily Volume
6,735
the company has a proven track record and is expected to consistently increase its
Face Value (`)
10
average realisation (realisation CAGR of ~10% over FY2009-15). The company is
expected to incur strong cash flows and achieve higher assets turnover due to lower
BSE Sensex
26,392
capex requirement, as most of the rides are manufactured at the in-house plant.
Nifty
8,002
Huge potential for F&B segment to grow: Apart from ticket sales, the company
Reuters Code
NA
also generates income from food and beverage (F&B) sales, and product sales at
Bloomberg Code
WONH@IN
its amusement parks, which contribute by almost 25% to the company’s total
revenue. As per a report by CARE Ratings, global amusement parks draw 60-65%
of their revenues from other segments (non-ticket sales). Since FY2009, the
Shareholding Pattern (%)
company’s revenue from other segments has increased from 15% to 25% and we
expect such contribution to rise further.
Promoters
71.0
Company to benefit from higher occupancy rate at Wonderla Resort and
MF / Banks / Indian Fls
2.0
turnaround at the operating level: Over the last three years, Wonderla Resort’s
FII / NRIs / OCBs
9.1
occupancy rate has increased significantly from ~30% to ~45%. Also, Wonderla
Indian Public / Others
17.9
Resort has turned around at the operating level in FY2015. Increase in footfalls at
the Bengaluru park is likely to further boost growth for Wonderla Resort.
Moreover, we expect occupancy rate as well as profitability to rise, going forward.
Abs. (%)
3m 1yr
3yr
Outlook and Valuation: India’s young demographic profile and increasing
Sensex
(4.1)
(14.3)
49.6
discretionary spends are expected to benefit the entertainment industry in the
Wonderla
5.3
14.2
NA
country. Also, the addition of a new park in the company’s portfolio and expected
increase in contribution from other segments like F&B, resort, etc will drive growth
for the company, going forward. Further, the company has negative working
Historical share price chart
capital and negligible debt on its balance sheet. With the company’s stock price
360
having corrected by 20-22% from its all time high, the company now poses as a
340
good buying opportunity in our view. At the current market price, the stock trades
320
at a P/E of 21.3x its FY2017E EPS. We initiate coverage on the stock with a Buy
300
recommendation and target price of `322 (25x FY2017E EPS), indicating an
280
upside of ~17% in the stock price from the present levels.
260
Key Financials
240
Y/E March (` cr)
FY2014
FY2015E
FY2016E
FY2017E
220
Net sales
154
182
206
308
% chg
11.4
18.4
13.4
49.5
Net profit
40
51
51
73
% chg
18.8
27.0
0.6
43.0
Source: Company, Angel Research
EBITDA margin (%)
46.0
44.3
44.0
43.6
EPS (`)
7.1
9.0
9.0
12.9
P/E (x)
39.0
30.7
30.5
21.3
P/BV (x)
10.4
4.4
4.2
3.8
RoE (%)
26.6
14.2
13.7
17.8
RoCE (%)
33.1
17.3
18.9
24.5
Amarjeet S Maurya
EV/Sales (x)
10.1
7.5
7.4
4.9
022-39357800 Ext: 6831
EV/EBITDA (x)
22.0
17.0
16.9
11.3
Source: Company, Angel Research, Note: CMP as of August 28, 2015
Please refer to important disclosures at the end of this report
1
Wonderla Holidays | Initiating Coverage
Investment Arguments
Healthy growth in existing parks coupled with new addition of
Hyderabad Park to drive growth
The company is continuously making efforts to increase footfalls through capacity
expansion and introducing innovative rides at the existing amusement parks. For
Total capex for Hyderabad amusement
instance, over FY2009-15, the company has reported a CAGR of 7.3% in footfalls.
park is `250cr which has been funded
Moreover, the company is setting up a new amusement park in Hyderabad at a
partly through IPO money (`180cr) and
total capex is `250cr which has been partly funded through IPO money (`180cr)
balance from internal accrual
and the balance from internal accruals. The company also plans to expand by
venturing into other parts of India and thereby cater to a wider audience. Going
forward, we believe that the company would witness an increase in footfalls
through new and existing amusement parks.
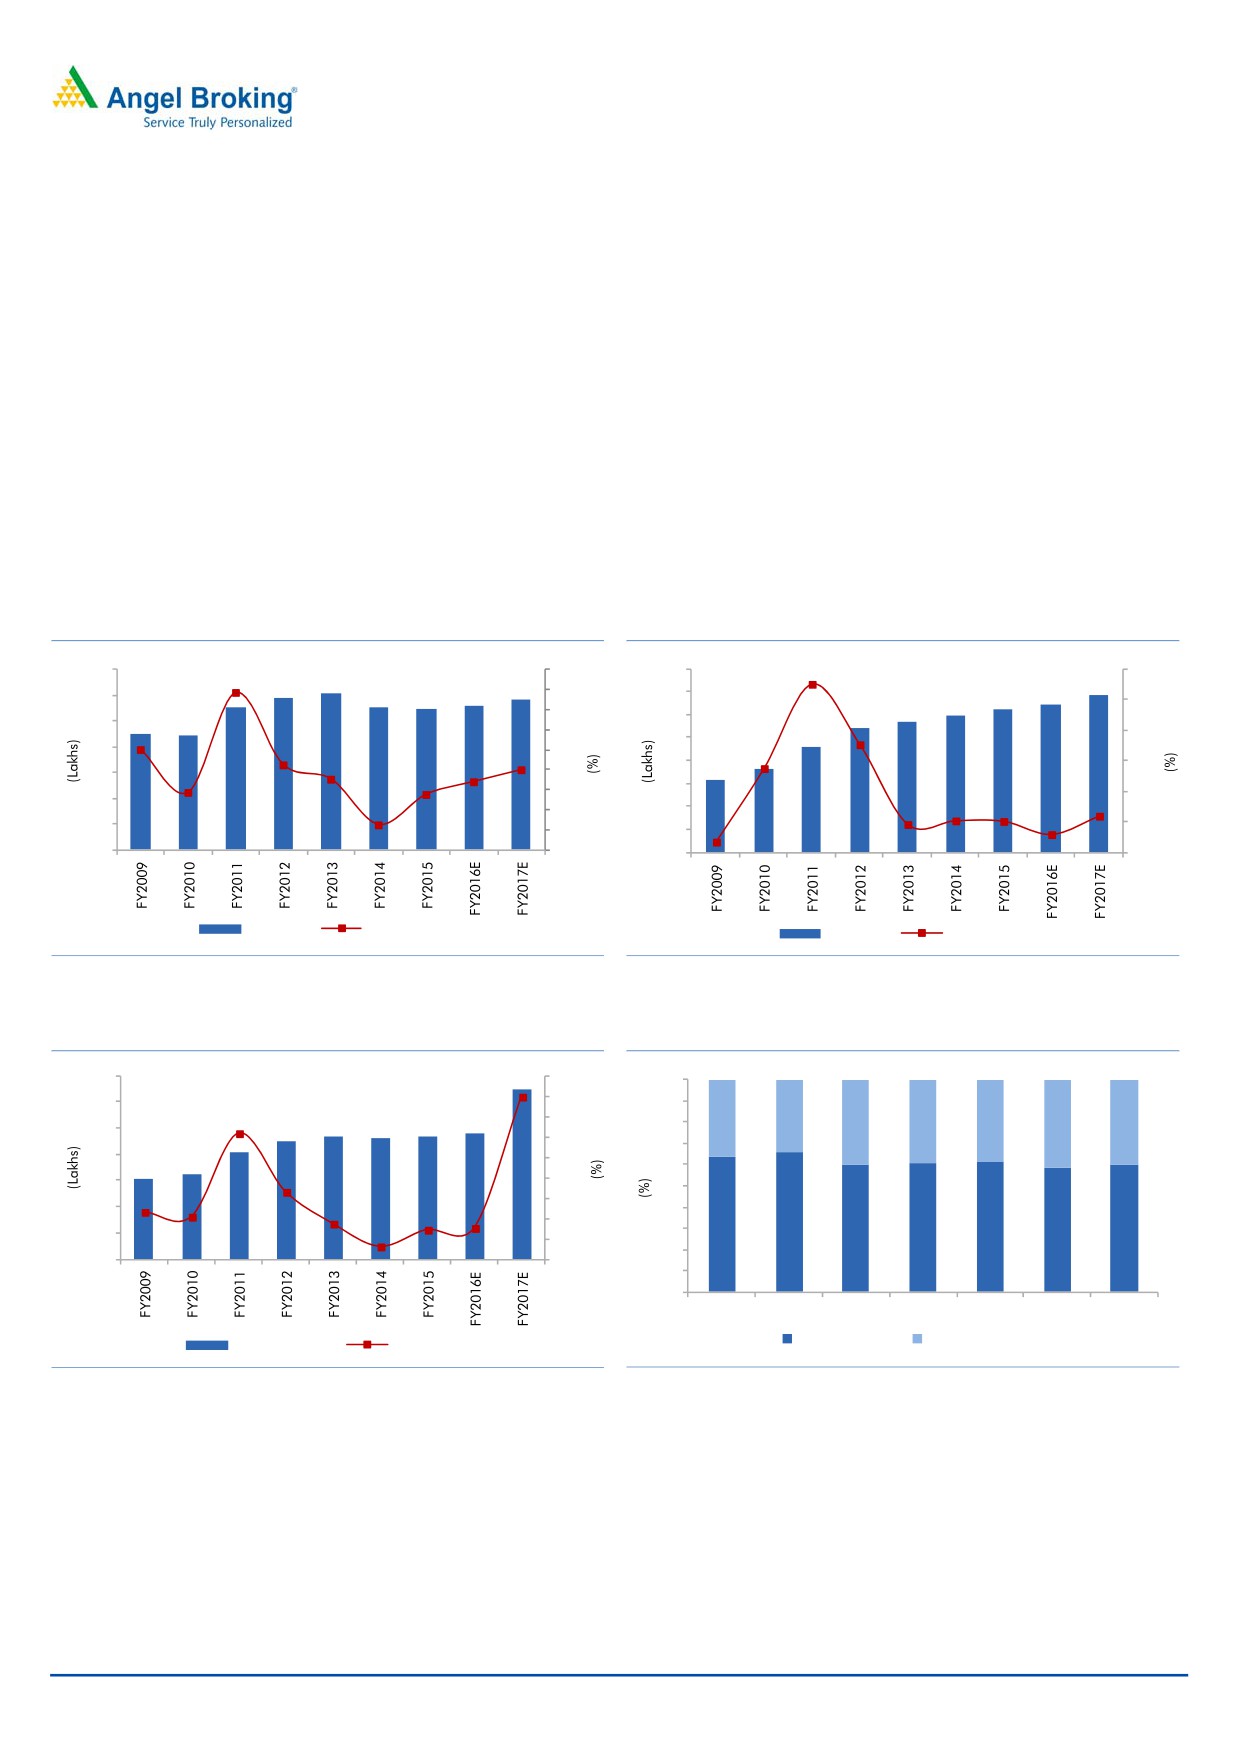
Exhibit 1: Kochi Park footfalls growth trend
Exhibit 2: Bengaluru Park footfalls growth trend
14
11.1
30
16
27.5
30
11.8
12.1
11.7
13.6
11.0
10.9
11.1
25
14
12.5
12.9
12
11.9
25
20
10.8
11.3
9.0
8.9
24.3
12
10
15
9.2
20
10
8
6.2
5.0
10
7.2
2.6
2.0
8
15
10.0
6.3
17.7
6
(0.7)
(1.2)
5
6
13.8
-
10
4
5.2
5.1
6.0
(8.8)
4
4.6
(5)
3.0
2
1.8
5
(10)
2
0
(15)
0
0
Footfalls
yoy growth (%)
Footfalls
yoy growth (%)
Source: Company, Angel Research
Source: Company, Angel Research
Exhibit 3: New + Existing Parks’ footfall growth trend
Exhibit 4: Customer mix
35
32.3
40
100
35
30
90
25.7
24.0
34.7
30
34
22.6
23.4
22.9
23.4
80
36
40
39
39
41
40
25
25
20.3
70
20
16.1
20
15.3
60
11.4
15
15
50
6.5
5.3
10
10
3.6
2.1
2.5
40
5
66
(2.0)
30
64
60
61
61
60
5
59
-
20
0
(5)
10
0
FY2009
FY2010
FY2011
FY2012
FY2013
FY2014
FY2015
Walk-in Visitors
Institutional Visitors
Total Footfalls
yoy growth (%)
Source: Company, Angel Research
Source: Company, Angel Research
We expect the company to report a CAGR of 17.5% in footfalls over FY2015-17E
on the back of healthy growth in existing parks, ie Kochi (3.5% CAGR expected
over FY2015-17E) and Bengaluru (4.5% CAGR expected over FY2015-17E), and
also owing to expected growth of the new park at Hyderabad where we have
factored in 7 lakh footfalls and average realisation of `800.
August 31, 2015
2
Wonderla Holidays | Initiating Coverage
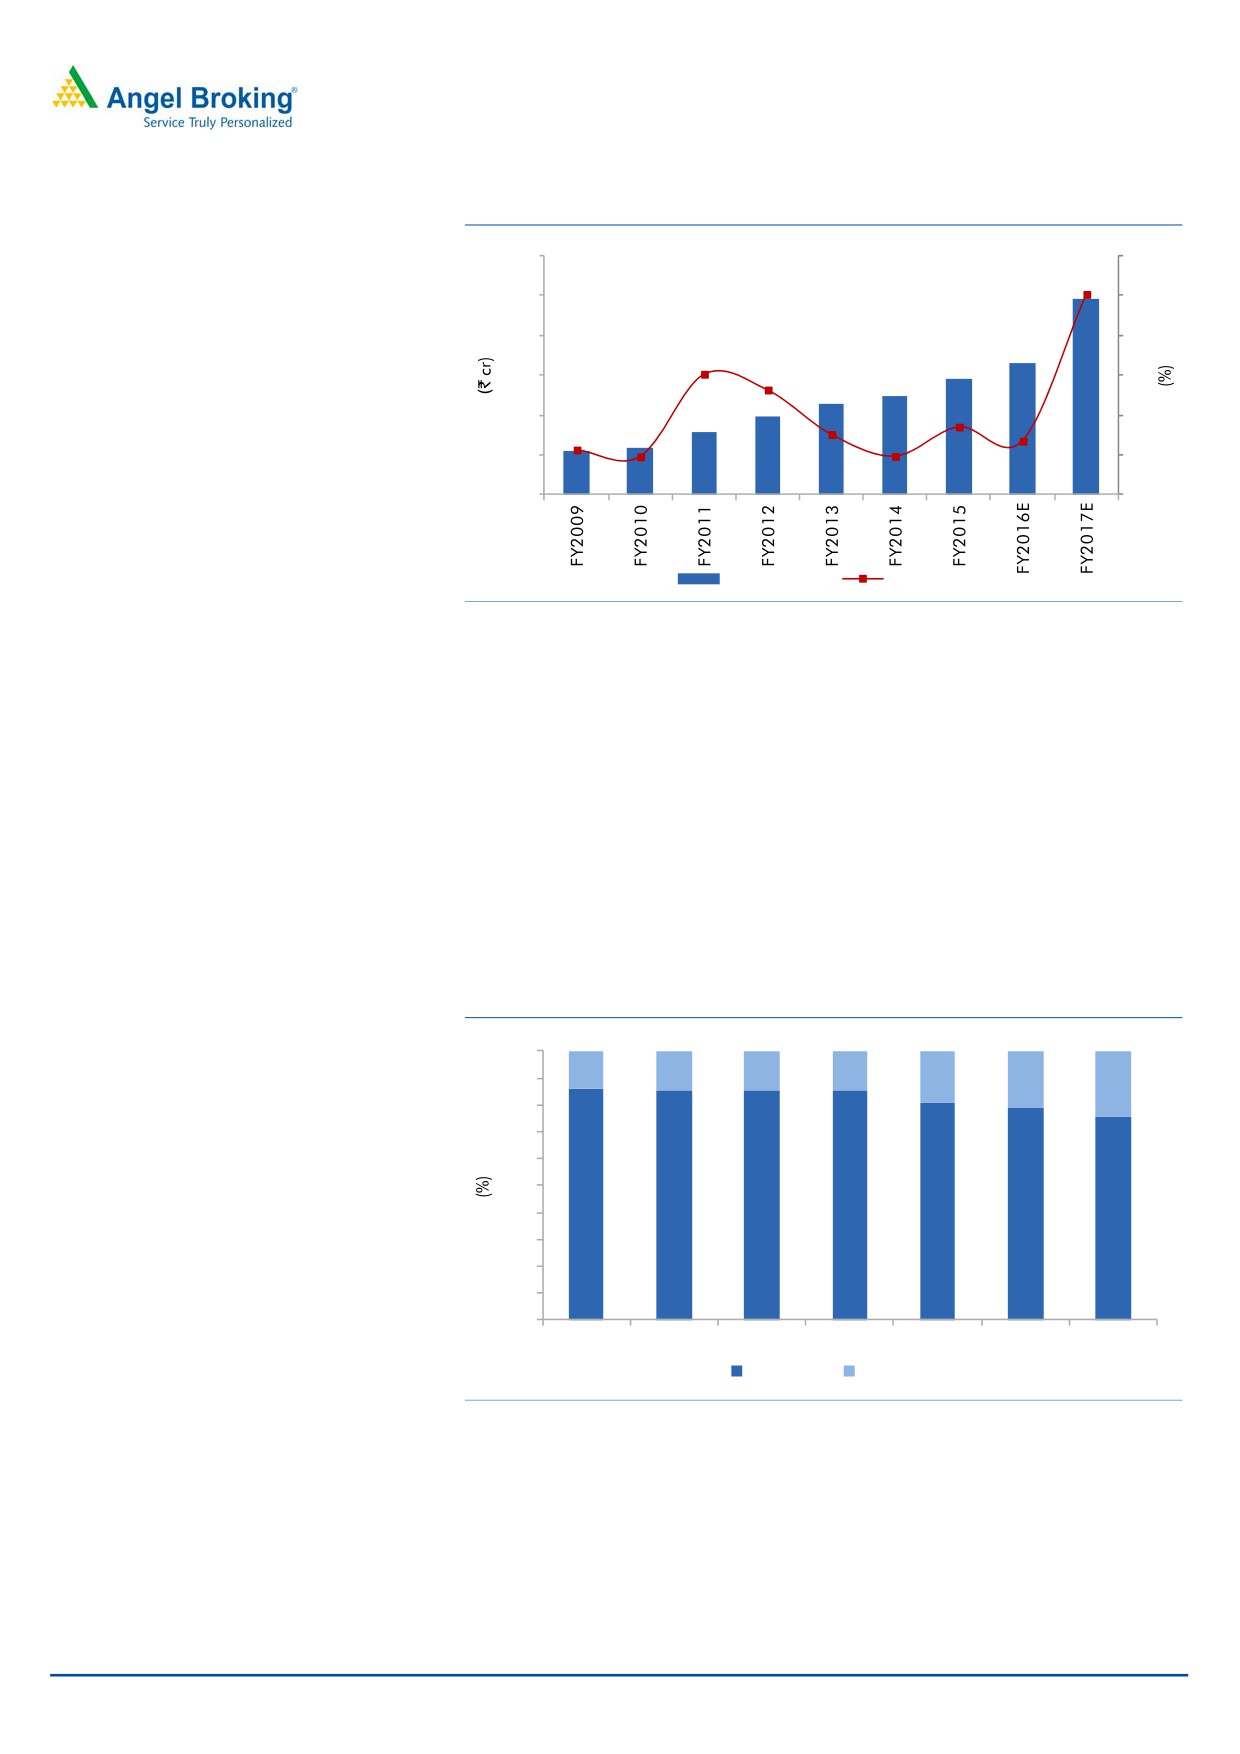
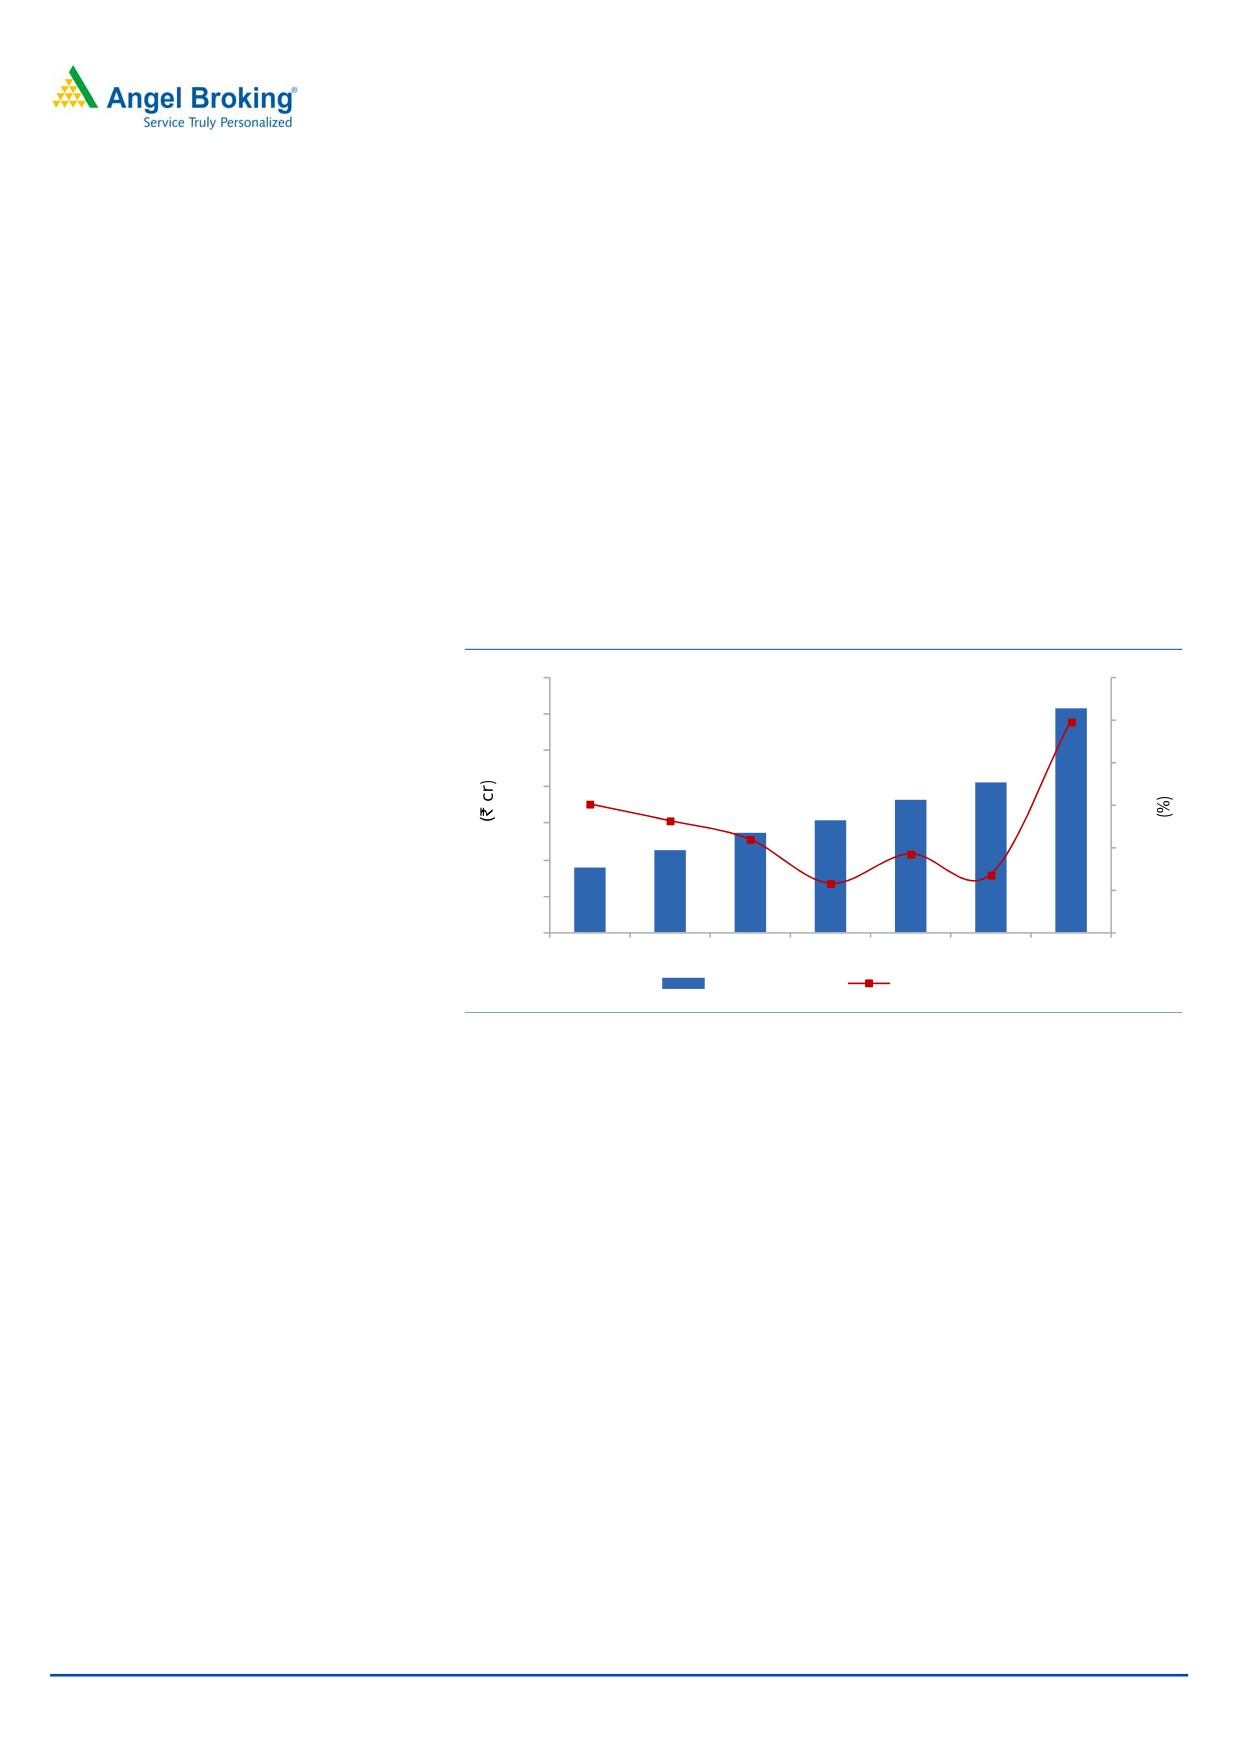
Exhibit 5: Net Revenue from Amusement park segment
300
60
247
250
50
50.3
200
40
164
30.2
145
26.3
150
124
30
113
98
17.0
100
78
13.4
20
54
60
9.6
50
15.1
10
11.2
9.5
0
0
Net Revenue
yoy growth (%)
Source: Company, Angel Research
We expect the company to report a
Thus, considering the above factors, we expect the company to report strong top-
30.6% CAGR over FY2015-17E to
line growth in its core business (amusement parks). We expect the company to
~`247cr.
report a CAGR of 30.6% in its top-line to ~`247cr, over FY2015-17E.
Surge in F&B revenue to contribute to overall growth
Apart from ticket sales, the company also generates income from other segments
like F&B operations as well as direct merchandising operations at amusement
Since FY2009, the company’s revenue
parks on a revenue sharing basis. Since FY2009, the company’s revenue contribution
contribution from ticket sales has
from ticket sales has reduced from 86% to 75% due to increase in revenue from other
reduced from 86% to 75%.
segments and also due to introduction of the new Wonderla Resort.
Exhibit 6: Revenue contribution from other segments on the rise
100
14
15
15
14
90
19
21
25
80
70
60
50
86
85
85
86
40
81
79
75
30
20
10
0
FY2009
FY2010
FY2011
FY2012
FY2013
FY2014
FY2015
Ticket Sales
Others
Source: Company, Angel Research
The company is generating lower revenue from other segments (non-ticket sales)
compared to other global amusement parks. As per a report by CARE Ratings,
entry fees constitute only 31% to 35% of total revenues of global amusement
parks. Resorts and other rentals contribute
35% to
37%, and F&B and
merchandising typically contribute 32% to 35% to the total revenue of global
amusement parks.
August 31, 2015
3
Wonderla Holidays | Initiating Coverage
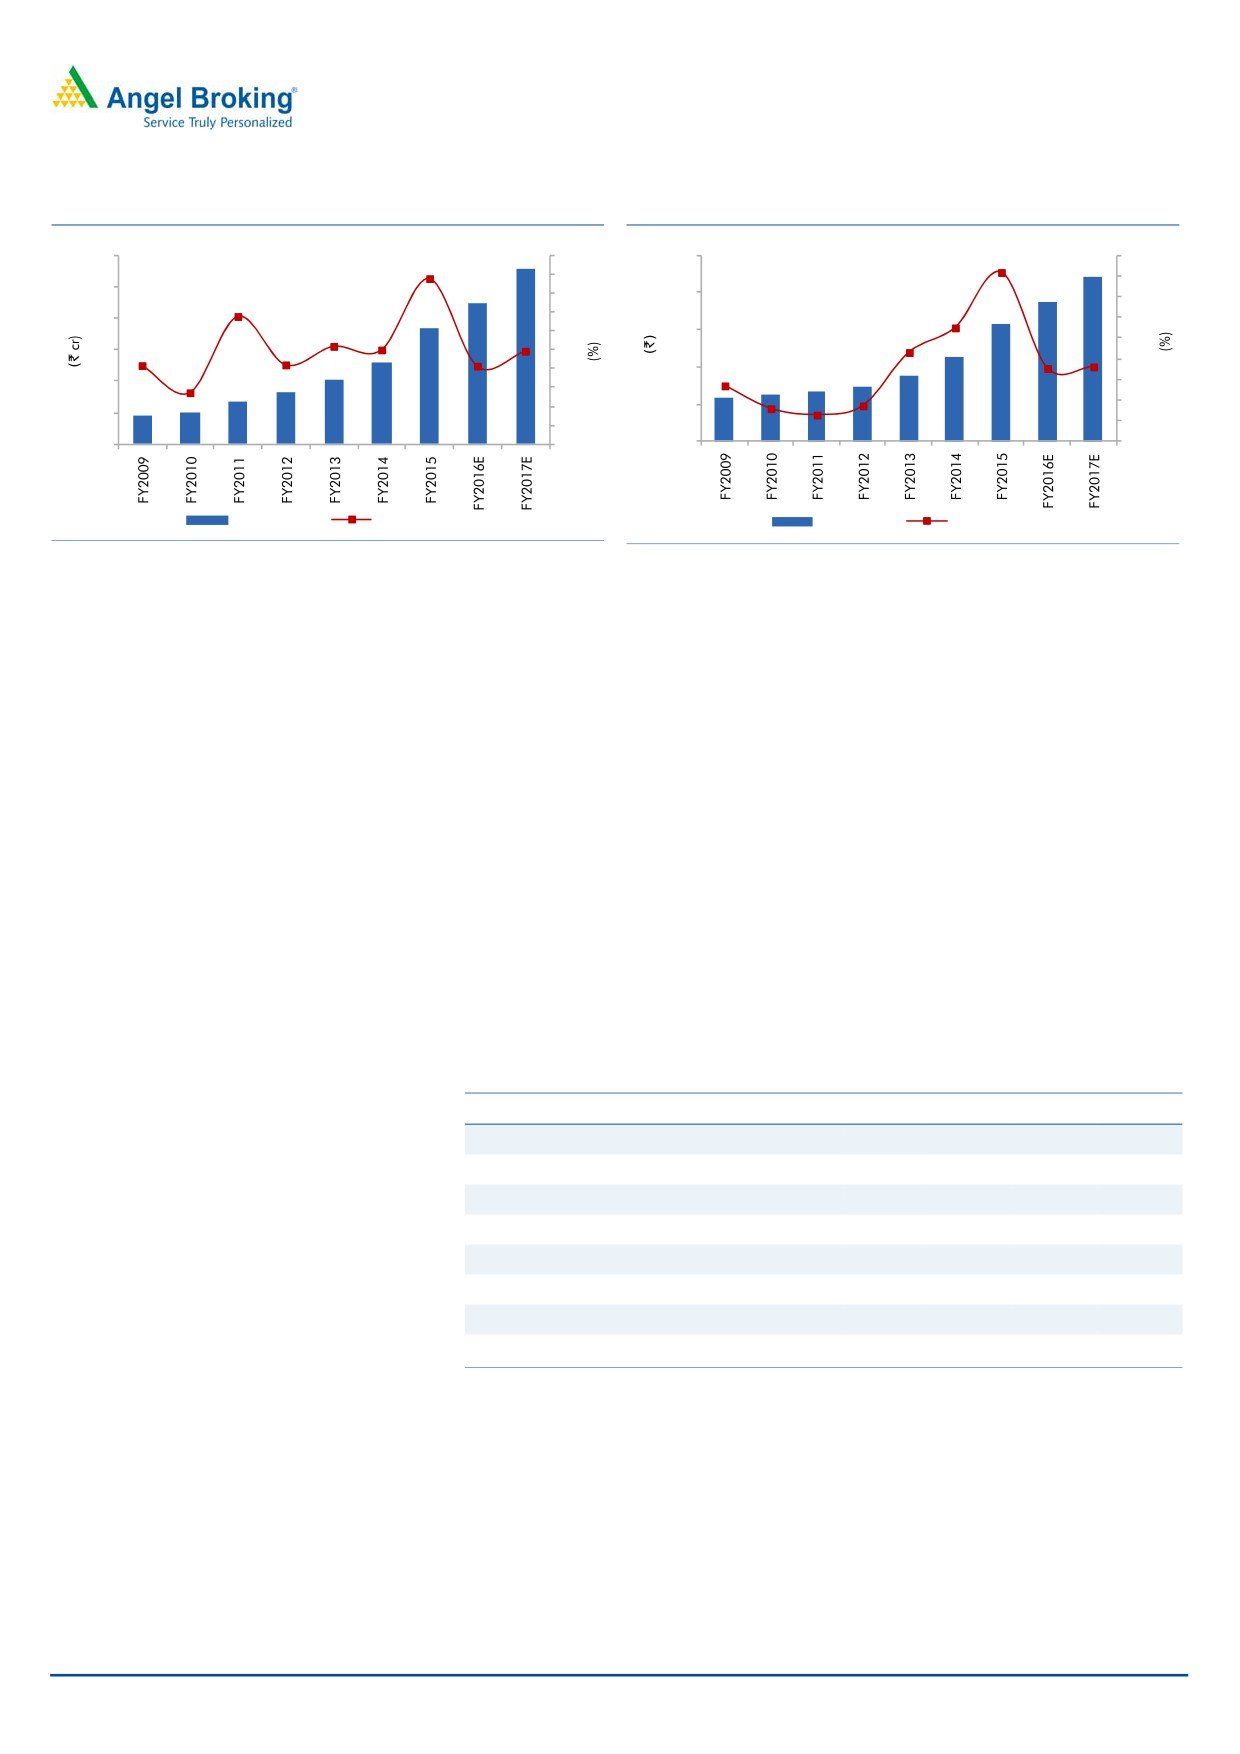
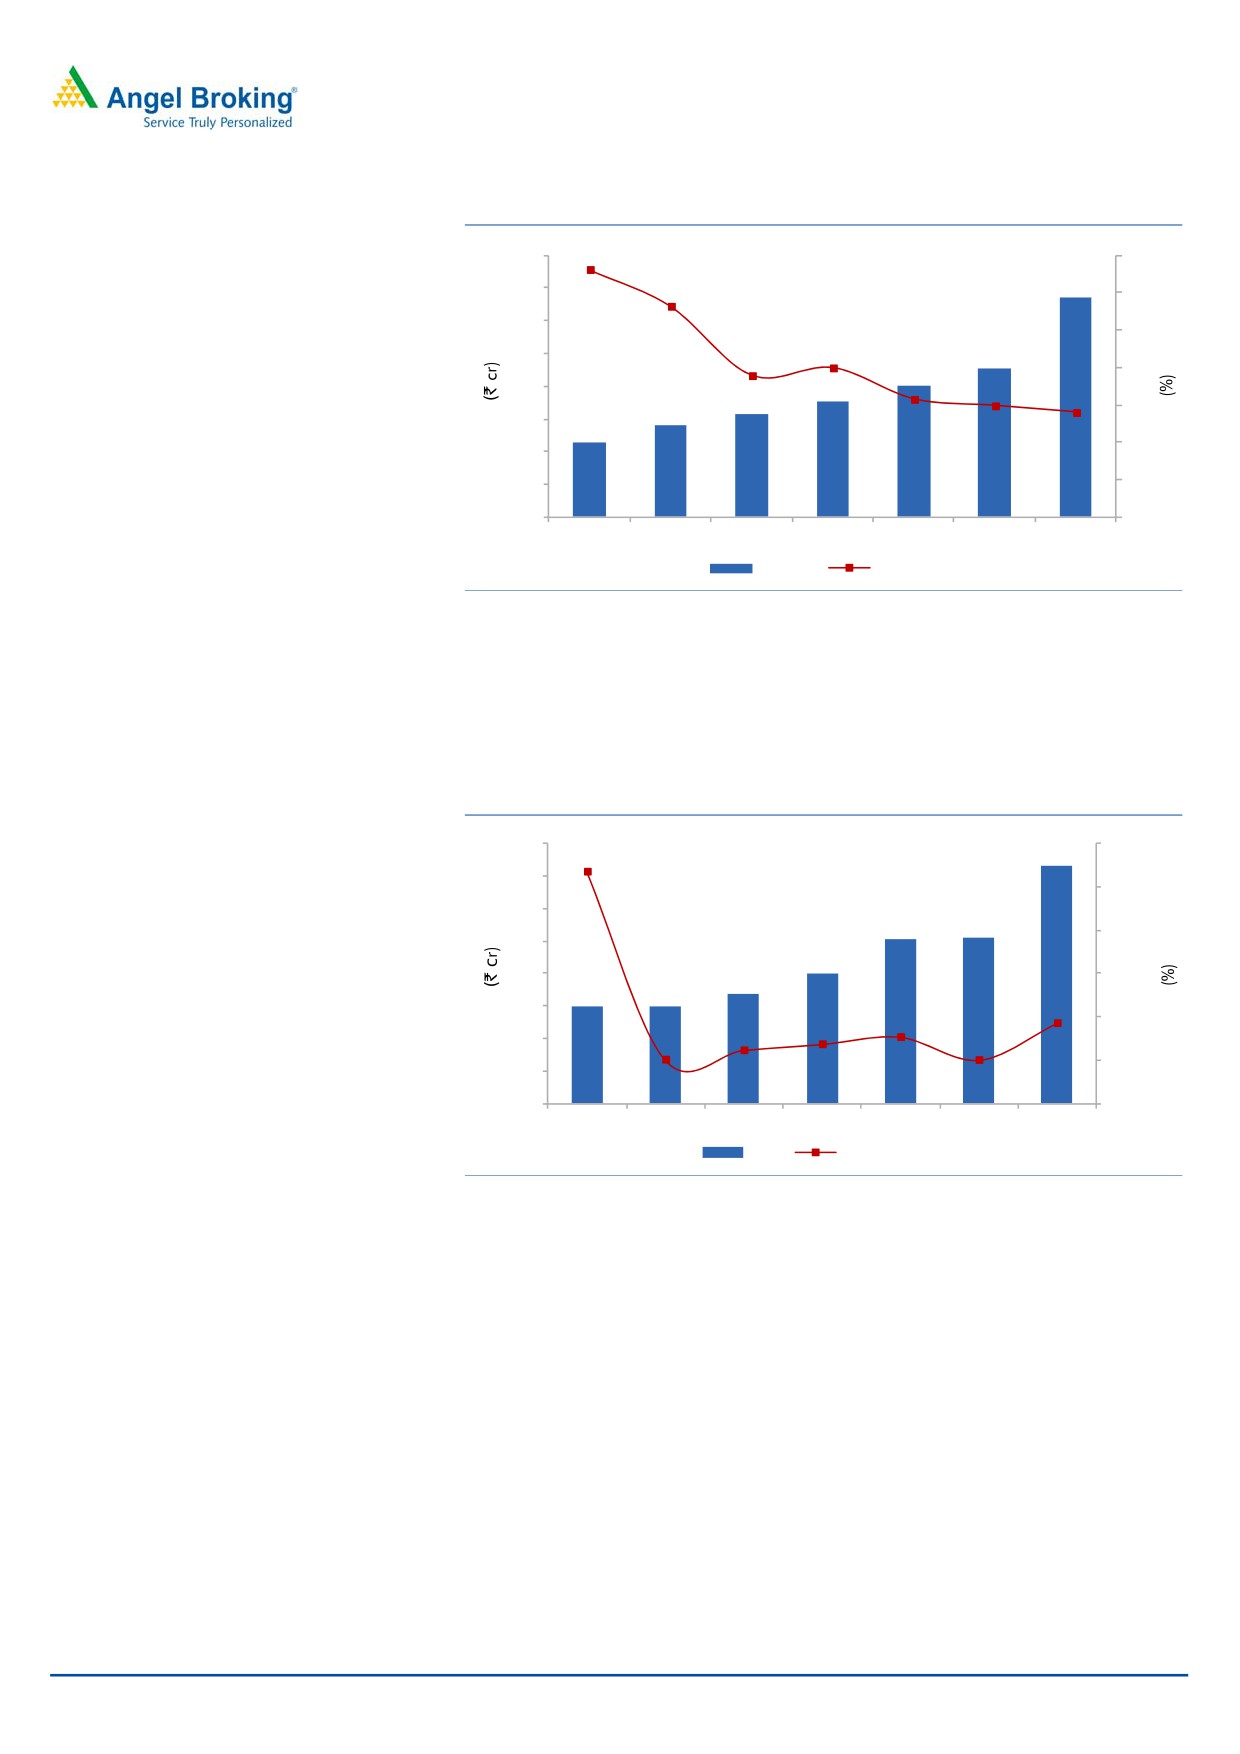
Exhibit 7: Net Revenue growth from F&B and
Exhibit 8:
other segments and average price trend
60
43.9
50
250
40.9
45
45
40
50
33.8
40
200
35
27.5
40
35
30
25.9
25.0
30
150
21.6
25
20.8
21.0
20.7
18.1
30
25
17.7
24.6
20
20
100
13.5
13.6
8.6
20
6.4
15
15
7.9
10
50
10
10
9
10
14
16
21
26
37
45
56
5
58
63
67
73
88
112
158
186
220
5
0
0
0
0
Net revenue
yoy growth (%)
Realisation
yoy growth (%)
Source: Company, Angel Research
Source: Company, Angel Research
Thus, we see strong opportunity for the company to capture additional revenue
from other segments, in line with global amusement parks. The company is
making efforts to increase such income by expanding F&B as well as
merchandising operations at amusement parks. Going forward, we expect the
company to report strong revenue CAGR of 22.6% over FY2015-17E to `56cr.
Turnaround in Wonderla Resort will aid overall margins
The company, in March 2012, launched a 3-Star leisure resort attached to the
amusement park in Bengaluru. The objective of Wonderla Resort is to enable
The resort has 84 luxury rooms and 4
visitors to stay longer at the park, which would lead to increased spends on their
banquet halls
/ conference rooms,
part. Moreover, it would also enhance visitor experience. The resort has 84 luxury
totalling 8,900 sq ft with a capacity to
rooms, 4 banquet halls / conference rooms, totaling 8,900 sq ft with a capacity to
hold 800 guests; plus, the resort has a
hold 800 guests and has a well equipped board room. The resort is also suitable
well equipped board room
for hosting wedding receptions, parties and other corporate events and meetings.
Exhibit 9: Financial overview Wonderla Resort
FY2012
FY2013
FY2014
FY2015
Total No. of Room Nights Available
30,660
30,660
30,660
No. of Rooms Available for Guests Paid Guests
28,596
29,889
29,121
No. of Rooms Occupied
9,730
8,849
13,186
Occupancy Ratio %
34
30
45
Revenue (` cr)
0.0
6.0
6.6
10.4
EBITDA (` cr)
(0.9)
(2.2)
0.1
2.1
Margin (%)
-
-
1.2
20.3
PAT (` cr)
(1.5)
(5.2)
(2.7)
(0.6)
Source: Company, Angel Research
The company reported a revenue CAGR of 32.3% to `10cr over FY2013-15 and
increased occupancy rate from 34% in FY2013 to 45% in FY2015. Since the last
four years, the company’s resort is making losses at both the EBITDA and PAT
levels due to lower occupancy rate and high fixed cost. In FY2015, the company
has reported a profit of `2cr at the EBITDA level due to increase in occupancy rate.
Going forward, we believe that Wonderla Resort would be able to increase its
occupancy rate which will result in profitability for the Bengaluru amusement park
August 31, 2015
4
Wonderla Holidays | Initiating Coverage
as well, on the back of healthy footfall growth. Thus, this would provide margin
benefit to the company and also help to increase profitability.
In-house ride manufacturing facility leads to cost efficiency
To reduce maintenance cost and capex requirement, the company has developed
in-house manufacturing facility in Kochi to manufacture amusement rides and
attractions and also modify the rides (as per visitors’ feedback). The company has
constructed 42 rides for its amusement parks till date. Going forward, we believe
The company has constructed 42 rides
that the company will benefit from its in-house manufacturing capacity which
for its amusement parks till date
would reduce its capex (the cost of a ride manufactured in-house is one-third of
the cost of buying it externally) and maintenance costs.
Exhibit 10: Number of rides imported for park
Number of rides
Imported
Kochi
55
10
Bangalore
55
18
Source: Company, Angel Research
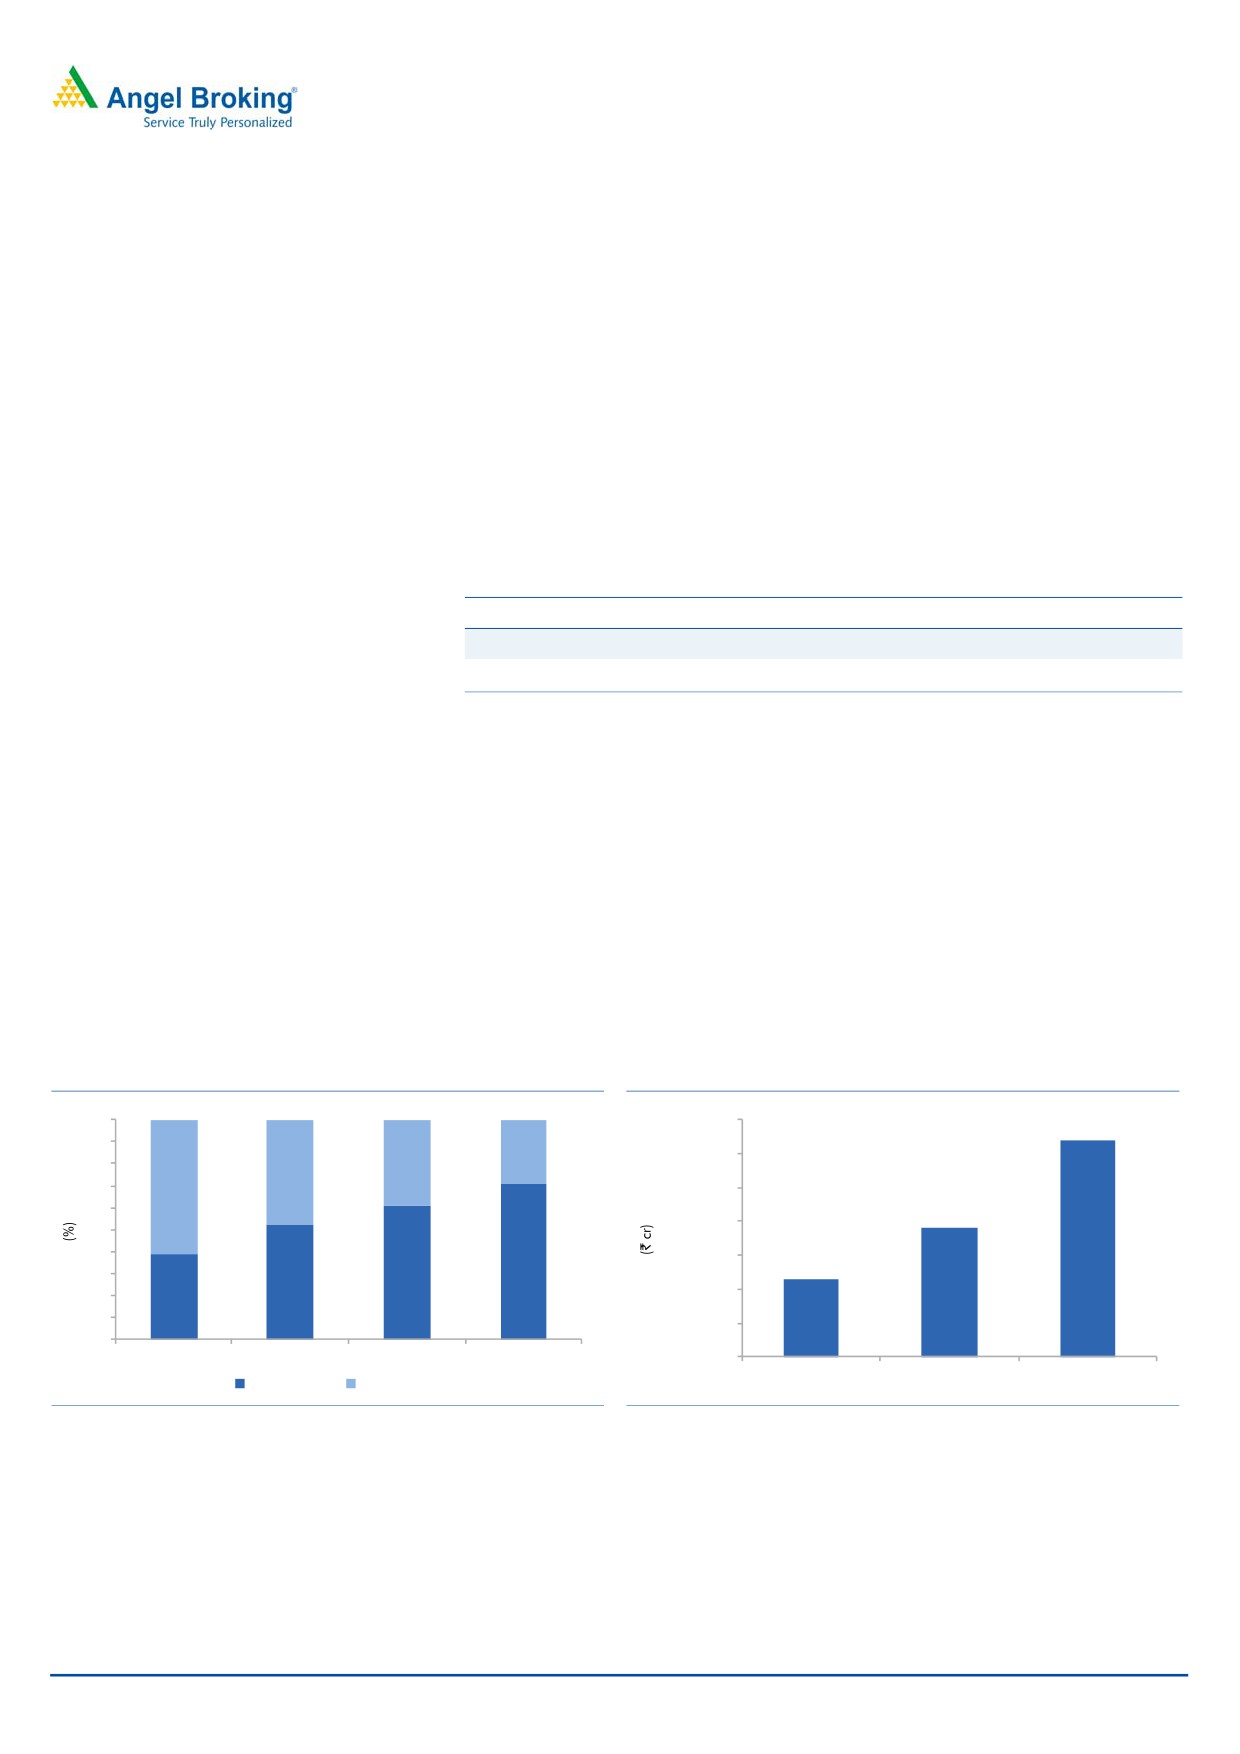
Strong demand drivers for amusement park industry
Despite the recent economic slowdown, there has been a continuous and sustained
Rising disposable incomes, increasing
shift in consumer demand pattern from basic necessities to lifestyle products and
discretionary spending, urbanization,
services. According to McKinsey Global Institute (MGI), discretionary spending will
and demographic advantage are likely
account for 71% of the total consumer spending by the year 2025. Further,
to drive growth for the amusement park
average disposable income is expected to surge from `1.9 lakh in CY2015E to
industry
`3.2 lakh in CY2030E, which would direct higher spending on entertainment
activities such as vacations, visits to multiplexes, restaurants, amusement parks etc.
Exhibit 11: Shifting consumer preferences
Exhibit 12: Rising disposable incomes
100
3,50,000
3,19,518
90
29
3,00,000
80
39
48
70
61
2,50,000
60
1,90,639
2,00,000
50
40
1,50,000
71
1,13,744
30
61
52
1,00,000
20
39
10
50,000
0
CY1995
CY2005
CY2015E
CY2025E
-
CY2005
CY2015E
CY2025E
Discretionary
Necessities
Source: McKinsey Global Institute (MGI)
Source: McKinsey Global Institute (MGI)
August 31, 2015
5
Wonderla Holidays | Initiating Coverage
Exhibit 13: India has demographic advantages
Exhibit 14: Demand driven by increasing urbanization
700
50
45.4
45
590
600
40
37.1
35.9
500
35
30
26.5
400
340
25
290
300
20
15
200
10
100
5
0
0
2001
2008
2030
India
USA
Japan
China
Source: CIA World Factbook
Source: McKinsey Global Institute (MGI)
Hence, given India’s young demographic profile and urban population expected to
grow from 340mn in 2008 to 590mn in 2030E (as per MGI), amusement parks
are likely to draw higher footfalls, supported by increase in discretionary spending.
In our opinion, Wonderla Holidays is well-placed to take advantage of this
unfolding opportunity.
Outlook and Valuation
Going ahead, we expect Wonderla Holidays to report a top-line CAGR of ~30%
over FY2015-17E to ~`308cr owing to healthy growth in footfalls, which are likely
to grow at a CAGR of ~18% over the same period owing to addition of new
amusement park in Hyderabad. Going forward, we believe that the company will
be able to increase its net revenue owing to increase in innovative rides at the
existing amusement parks and on plans to expand in other cities. Further,
Wonderla Resort will also contribute revenue for the company.
On the bottom-line front, we expect the company to report an ~20% CAGR over
FY2015-17E on account of strong revenue growth and also on account of benefits
accruing from Wonderla Resort which has turned profit making at the operating
level in FY2015. Wonderla Resort is expected to report profit at the bottom-line
level due to increase in occupancy. Moreover, the company has negative working
capital (payment received upfront), negligible debt, and is able to post a healthy
return ratio, which make the balance sheet all the more attractive.
At the current market price, the stock trades at a P/E of 21.3x its FY2017E EPS. We
initiate coverage on the stock with a Buy recommendation and target price of `322
(25x FY2017E EPS), indicating an upside of ~17% in the stock price from the
present levels.
August 31, 2015
6
Wonderla Holidays | Initiating Coverage
The downside risks to our estimates include
1) The company’s revenue comes from the discretionary category, which is
completely dependent upon an individual’s disposable income and healthy
growth of the economy. Slowdown in the Indian economy could adversely
affect the business.
2) Entry of new players in this segment will create competition for the company.
Other than this, the existing entertainment parks in Hyderabad, namely
Ramoji Film City and Ocean Park, may also pose a challenge even though
they are different in terms of their attractions.
3) The company’s current revenue comes from operations of its two amusement
parks, but any accident at any one of them may result in temporary closure of
the park, thereby generating adverse publicity and in turn affecting revenues
of the company.
4) The company is currently involved in two cases of litigation pertaining to 14.7
acres of land acquired in Hyderabad to set up the park. The Management
has indicated that initially the park will be set up across 27 acres, which
excludes the land under litigation. Hence, no delay is expected in setting up
the park. However, any adverse result of litigation may result in limited
expansion of the park in future, thus resulting in lower-than-expected
revenue.
August 31, 2015
7
Wonderla Holidays | Initiating Coverage
Company Background
Wonderla Holidays Ltd (Wonderla), founded in 2002, is one of the largest
amusement park operators in India. The company currently owns and operates
two amusement parks under the brand name ‘Wonderla’. The company also owns
and operates a resort besides an amusement park in Bengaluru under the brand
name ‘Wonderla Resort’, which has been operational since March
2012.
Wonderla is promoted by Mr Kochouseph Chittilappilly (promoter of V-Guard
Industries) and Mr Arun Kochouseph Chittilappilly.
The promoters of the company launched the first amusement park in Kochi in
2000 with the name ‘Veegaland’ and the second amusement park in Bengaluru in
2005 with the name Wonderla. Veega Holidays and Parks Pvt Ltd, which owned
and operated Veegaland, was merged with Wonderla Holidays Ltd with effect from
April 1, 2008. Consequently, both amusement parks are being operated under the
name Wonderla. Wonderla has a proven track record of managing amusement
parks with established brand equity. The company has been able to maintain high
standards of safety and hygiene, which has been able to attract organized visits
from schools, colleges and corporate segment.
Exhibit 15: Details about Wonderla Holidays Parks
Wonderla Bengaluru Wonderla Kochi
Total Area (in acres)
81.75
93.17
Total Area utilised(in acres)
39.2
28.75
Rides (Land + Water)
59
62
Capacity (footfalls per day)
12,000
12,000
Average price ticket price (`)
673
555
Footfalls (in Lakhs) in FY2015
12.49
10.91
Revenues (` cr) for FY2015
106.4
75.3
EBITDA (` cr) for FY2015
57.4
31.3
EBITDA margins (%)
53.9
41.6
Proportion of non ticketing revenues (%)
21.0
19.5
Source: Company, Angel Research
Exhibit 16: Wonderla Bengaluru amusement park
Exhibit 17: Wonderla Kochi amusement park
Source: Company, Angel Research
Source: Company, Angel Research
August 31, 2015
8
Wonderla Holidays | Initiating Coverage
Exhibit 18: Details about Wonderla Hyderbad Parks
Wonderla Hyderbad
Total Area (in acres)
49.5
Total Area utilized (in acres)
27
Rides (Land + Water)
43
Capacity (footfalls per day)
10,000
Capex (`)
250
Source: Company, Angel Research
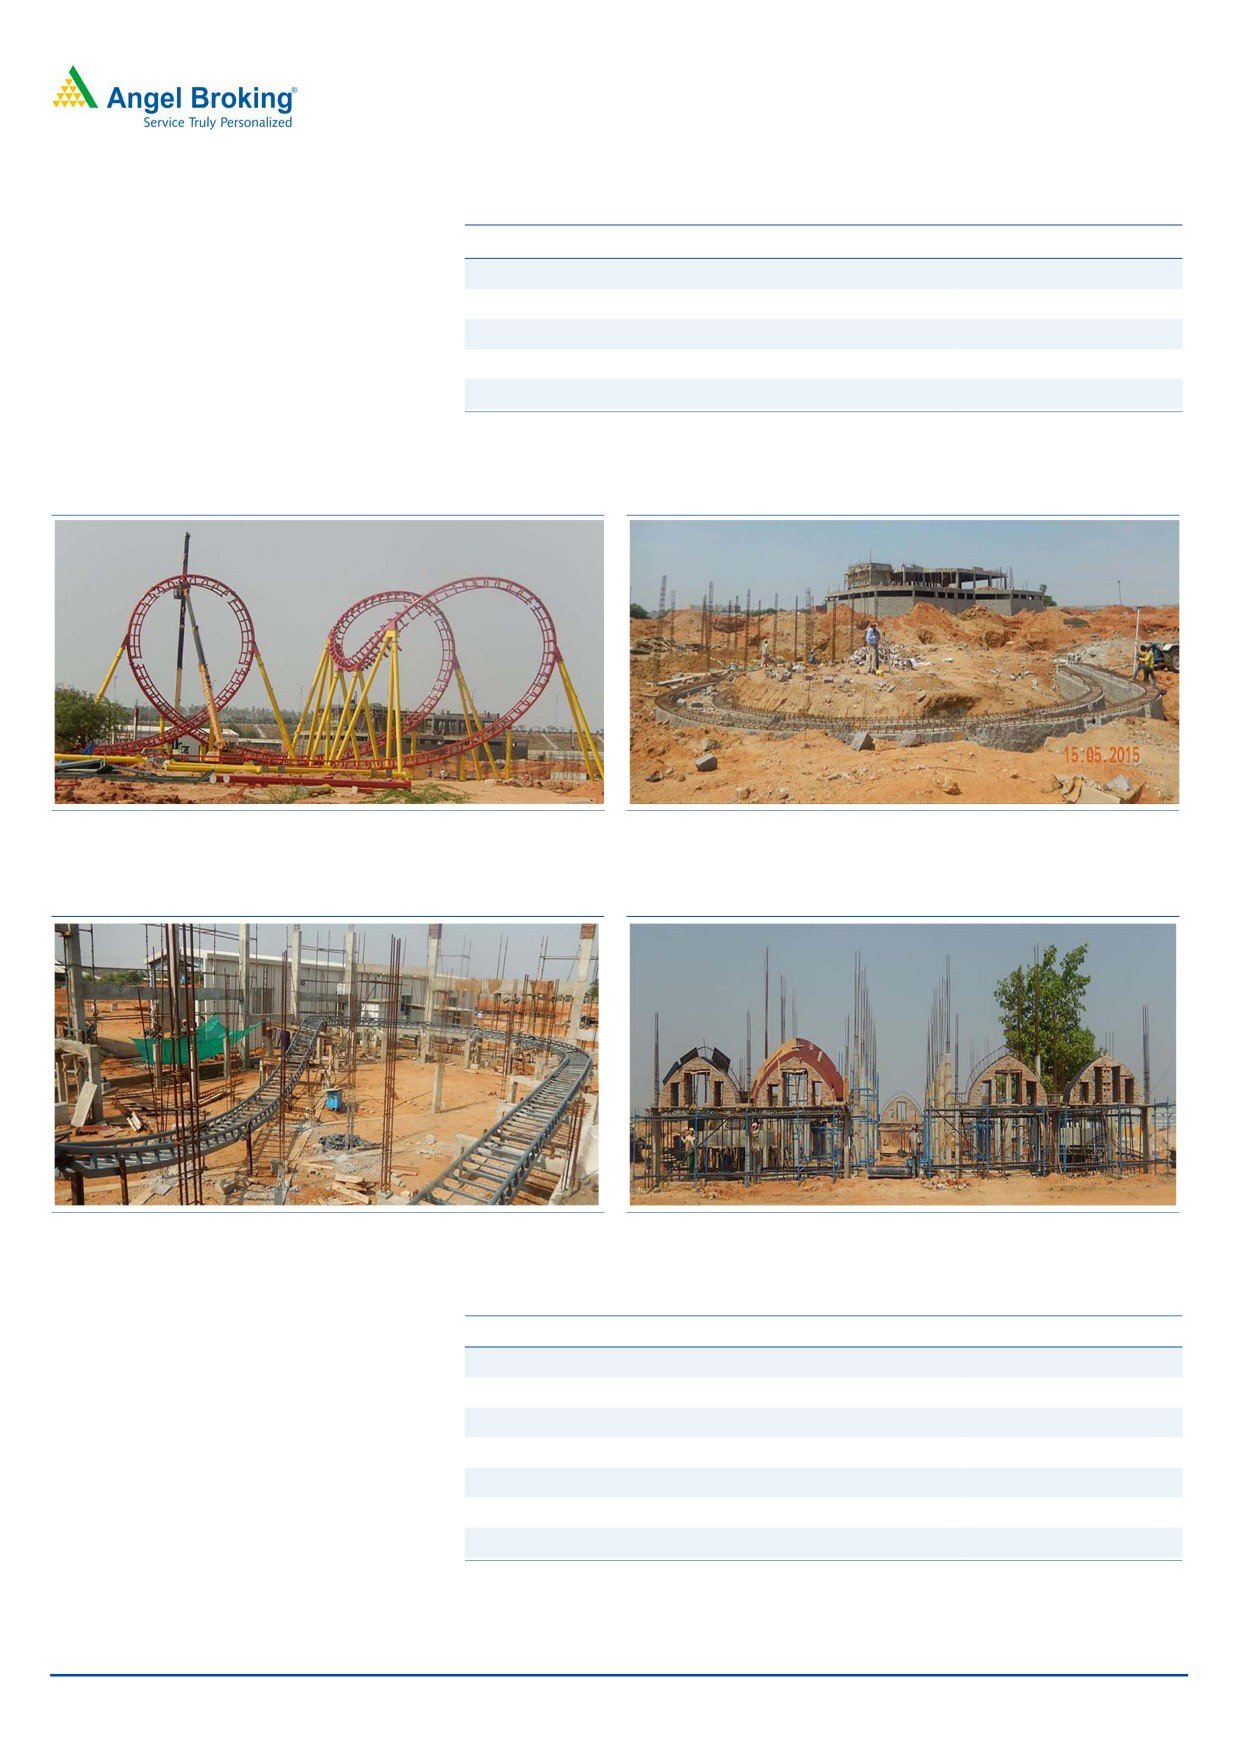
Exhibit 19: Construction of roller coaster
Exhibit 20: Construction of wonder splash
Source: Company, Angel Research
Source: Company, Angel Research
Exhibit 21: Construction of termite coaster track
Exhibit 22: Construction of waves restaurant
Source: Company, Angel Research
Source: Company, Angel Research
Exhibit 23: Details about Wonderla Resort at Bengaluru
Wonderla Resort
Number of rooms
84
Banquet halls / conference rooms (8,900 sq. ft)
4
Banquet halls / conference rooms (Capacity for guests)
800
Occupancy rate in FY2015
45%
Revenues (` cr) for FY2015
10.4
EBITDA (` cr) for FY2015
2.1
EBITDA margins (%)
20.3
Source: Company, Angel Research
August 31, 2015
9
Wonderla Holidays | Initiating Coverage
Exhibit 24: Wonderla Resort
Source: Company, Angel Research
August 31, 2015
10
Wonderla Holidays | Initiating Coverage
Financial outlook
Top-line likely to clock a CAGR of ~30% over FY2015-17E
Wonderla Holidays has reported net revenue CAGR of ~17% over FY2012-15 on
Going forward, we expect Wonderla
the back of growth in footfall and significant hike in average ticket price. Going
Holidays to register healthy top-line
forward, we expect Wonderla Holidays to register healthy net revenue CAGR of
CAGR of ~30% over FY2015-17E
~30% over FY2015-17E supported by healthy growth in footfalls and price hike at
existing amusement parks. Further, the company’s new amusement park in
Hyderabad is likely to generate additional footfalls (we have factored 7 lakh
footfalls from this park in our model) in FY2017E. Apart from this core segment,
we expect the company to also witness growth in other segments like F&B, product
sales and Wonderla Resort. Hence, we expect Wonderla Holidays’ net revenue to
grow by ~13.4% yoy and ~49.5% yoy in FY2016 and FY2017, respectively.
Exhibit 25: Projected Net Revenue growth trend
350
60
49.5
300
50
250
40
200
30.2
26.2
30
150
21.9
18.4
20
13.4
100
11.4
10
50
90
113
138
154
182
206
308
0
0
FY2011
FY2012
FY2013
FY2014
FY2015
FY2016E FY2017E
Top-line growth
yoy growth (%)
Source: Company, Angel Research
EBITDA to witness a CAGR of ~29% over FY2015-17E
Going forward, we expect the
Going forward, we expect the company’s operating margin to be under pressure
company’s EBITDA margin to be in the
due to increase in operating costs as the new amusement park in Hyderabad. Thus
range of 43-44%
operating margin is likely to be lower owing to lower utilization with it being the
first year of operation. We expect operating margin to be at 44% in FY2016E and
43.6% in FY2017E.
August 31, 2015
11
Wonderla Holidays | Initiating Coverage
Exhibit 26: Projected EBIDTA and margin trend
51.2
160
52
140
49.3
50
120
48
46.0
100
45.6
46
44.3
80
44.0
43.6
44
60
42
40
40
20
46
56
63
71
81
91
134
0
38
FY2011
FY2012
FY2013
FY2014
FY2015
FY2016E FY2017E
EBITDA
Margin (%)
Source: Company, Angel Research
Company to report healthy growth
We expect ~20% CAGR in Net Profit
We expect the company to post ~20% CAGR in net profit over FY2015-17E,
over FY2014-17E
mainly led by strong revenue growth.
Exhibit 27: Projected Net Profit growth trend
80
250
217.4
73
70
200
60
51
51
150
50
40
40
34
100
30
30
30
43.0
27.0
50
18.8
11.8
20
0.9
0.6
-
10
0
(50)
FY2011
FY2012
FY2013
FY2014
FY2015 FY2016E FY2017E
PAT
yoy growth (%)
Source: Company, Angel Research
Return ratios expected to bounce back
We expect the company to report improvement in its ROE and ROCE on the back
of healthy profitability with strong revenue growth (on back of strong footfalls
growth and increase in average price). In our view, the company is likely to report
a ROE of 13.7% to 17.8% and ROCE of 18.9% to 24.5% in FY2016 and FY2017,
respectively.
August 31, 2015
12
Wonderla Holidays | Initiating Coverage
Exhibit 28: Improving ROE & ROCE
45
40
35
30
25
20
15
10
FY2011
FY2012
FY2013
FY2014
FY2015
FY2016E FY2017E
ROE
ROCE
Source: Company, Angel Research
August 31, 2015
13
Wonderla Holidays | Initiating Coverage
Profit & Loss Statement
Y/E March (` cr)
FY2012
FY2013
FY2014
FY2015
FY2016E FY2017E
Total operating income
113
138
154
182
206
308
% chg
26.2
21.9
11.4
18.4
13.4
49.5
Total Expenditure
57
75
83
101
116
174
Personnel Expenses
21
22
24
27
31
47
Others Expenses
37
53
59
74
84
126
EBITDA
56
63
71
81
91
134
% chg
21.4
12.7
12.5
14.0
12.5
48.3
(% of Net Sales)
49.3
45.6
46.0
44.3
44.0
43.6
Depreciation& Amortisation
12
12
13
16
17
30
EBIT
44
51
57
64
73
104
% chg
29.6
15.4
12.7
12.1
13.9
42.0
(% of Net Sales)
39.1
37.0
37.4
35.4
35.5
33.8
Interest & other Charges
1
2
2
2
2
2
Other Income
1
2
2
10
2
3
(% of PBT)
3.1
3.0
4.1
14.0
2.7
2.8
Share in profit of Associates
-
-
-
-
-
-
Recurring PBT
44
50
58
73
74
106
% chg
4.4
12.6
15.7
26.0
1.2
43.0
Prior Period & Extra. Exp./(Inc.)
PBT (reported)
44
50
58
73
74
106
Tax
14
16
18
22
23
33
(% of PBT)
32.4
32.9
31.1
30.6
31.0
31.0
PAT (reported)
30
34
40
51
51
73
Add: Share of earnings of asso.
Less: Minority interest (MI)
-
-
-
-
-
-
PAT after MI (reported)
30.0
33.6
39.9
50.7
50.9
72.9
ADJ. PAT
30.0
33.6
39.9
50.7
50.9
72.9
% chg
0.9
11.8
18.8
27.0
0.6
43.0
(% of Net Sales)
26.6
24.4
26.0
27.8
24.7
23.6
Basic EPS (`)
5.3
5.9
7.1
9.0
9.0
12.9
Fully Diluted EPS (`)
5.3
5.9
7.1
9.0
9.0
12.9
% chg
0.9
11.8
18.8
27.0
0.6
43.0
August 31, 2015
14
Wonderla Holidays | Initiating Coverage
Balance Sheet
Y/E March (` cr)
FY2012
FY2013
FY2014
FY2015
FY2016E FY2017E
SOURCES OF FUNDS
Equity Share Capital
42
42
42
57
57
57
Reserves& Surplus
52
78
108
300
316
354
Shareholders Funds
94
120
150
356
372
410
Total Loans
22
21
24
15
15
15
Deferred Tax Liability
3
5
4
-
-
-
Total Liabilities
120
145
178
372
387
426
APPLICATION OF FUNDS
Gross Block
208
242
255
270
290
490
Less: Acc. Depreciation
87
98
110
130
147
178
Net Block
121
144
145
139
142
312
Capital Work-in-Progress
4
6
20
40
180
-
Investments
-
-
-
194
14
14
Current Assets
14
16
35
23
64
119
Inventories
2
3
3
4
7
11
Sundry Debtors
0
0
0
1
1
1
Cash
2
2
19
8
22
33
Loans & Advances
1
3
4
10
17
37
Other Assets
8
8
7
0
19
37
Current liabilities
20
21
23
26
14
20
Net Current Assets
(6)
(5)
12
(3)
50
99
Deferred Tax Asset
-
1
1
1
1
1
Total Assets
120
145
178
372
387
426
August 31, 2015
15
Wonderla Holidays | Initiating Coverage
Cashflow Statement
Y/E March (` cr)
FY2012
FY2013
FY2014
FY2015 FY2016E FY2017E
Profit before tax
44
50
58
73
74
106
Depreciation
12
12
13
16
17
30
Change in Working Capital
2
(0)
(2)
(2)
(39)
(37)
Interest / Dividend (Net)
1
2
1
(6)
2
2
Direct taxes paid
(14)
(15)
(20)
(25)
(23)
(33)
Others
-
0
0
1
-
-
Cash Flow from Operations
45
49
50
56
31
67
(Inc.)/ Dec. in Fixed Assets
(39)
(37)
(26)
(29)
(185)
(40)
(Inc.)/ Dec. in Investments
-
-
-
(194)
180
-
Cash Flow from Investing
(39)
(37)
(26)
(223)
(5)
(40)
Issue of Equity
-
-
-
170
-
-
Inc./(Dec.) in loans
5
(2)
3
(3)
-
-
Dividend Paid (Incl. Tax)
(7)
(7)
(7)
(10)
(10)
(15)
Interest / Dividend (Net)
(1)
(2)
(3)
(2)
(2)
(2)
Cash Flow from Financing
(4)
(11)
(7)
156
(12)
(16)
Inc./(Dec.) in Cash
2
0
17
(12)
14
11
Opening Cash balances
(0)
2
2
19
8
22
Closing Cash balances
2
2
19
8
22
33
August 31, 2015
16
Wonderla Holidays | Initiating Coverage
Key Ratios
Y/E March
FY2012
FY2013
FY2014
FY2015
FY2016E FY2017E
Valuation Ratio (x)
P/E (on FDEPS)
51.7
46.3
39.0
30.7
30.5
21.3
P/CEPS
37.3
34.2
29.3
23.2
22.8
15.1
P/BV
16.6
13.0
10.4
4.4
4.2
3.8
Dividend yield (%)
2.3
2.3
3.1
3.1
3.7
5.3
EV/Sales
13.9
11.4
10.1
7.5
7.4
4.9
EV/EBITDA
28.2
25.0
22.0
17.0
16.9
11.3
EV / Total Assets
11.3
9.4
7.7
3.4
3.8
3.4
Per Share Data (`)
EPS (Basic)
5.3
5.9
7.1
9.0
9.0
12.9
EPS (fully diluted)
5.3
5.9
7.1
9.0
9.0
12.9
Cash EPS
7.4
8.0
9.4
11.8
12.1
18.3
DPS
6.3
6.3
8.5
8.5
10.2
14.6
Book Value
16.6
21.2
26.5
63.1
65.9
72.7
Returns (%)
ROCE
38.0
36.2
33.1
17.3
18.9
24.5
Angel ROIC (Pre-tax)
38.8
36.9
37.4
38.1
20.9
27.5
ROE
32.0
28.0
26.6
14.2
13.7
17.8
Turnover ratios (x)
Asset Turnover (Gross Block)
0.5
0.6
0.6
0.7
0.7
0.6
Inventory / Sales (days)
6
7
8
8
12
13
Receivables (days)
1
1
1
1
1
1
Payables (days)
12
13
10
7
8
7
WC cycle (ex-cash) (days)
(5)
(4)
(1)
2
5
7
August 31, 2015
17
Wonderla Holidays | Initiating Coverage
Research Team Tel: 022 - 39357800
DISCLAIMER
Angel Broking Private Limited (hereinafter referred to as “Angel”) is a registered Member of National Stock Exchange of India Limited,
Bombay Stock Exchange Limited and MCX Stock Exchange Limited. It is also registered as a Depository Participant with CDSL and
Portfolio Manager with SEBI. It also has registration with AMFI as a Mutual Fund Distributor. Angel Broking Private Limited is a
registered entity with SEBI for Research Analyst in terms of SEBI (Research Analyst) Regulations, 2014 vide registration number
INH000000164. Angel or its associates has not been debarred/ suspended by SEBI or any other regulatory authority for accessing
/dealing in securities Market. Angel or its associates including its relatives/analyst do not hold any financial interest/beneficial
ownership of more than 1% in the company covered by Analyst. Angel or its associates/analyst has not received any compensation /
managed or co-managed public offering of securities of the company covered by Analyst during the past twelve months. Angel/analyst
has not served as an officer, director or employee of company covered by Analyst and has not been engaged in market making activity
of the company covered by Analyst.
This document is solely for the personal information of the recipient, and must not be singularly used as the basis of any investment
decision. Nothing in this document should be construed as investment or financial advice. Each recipient of this document should
make such investigations as they deem necessary to arrive at an independent evaluation of an investment in the securities of the
companies referred to in this document (including the merits and risks involved), and should consult their own advisors to determine
the merits and risks of such an investment.
Reports based on technical and derivative analysis center on studying charts of a stock's price movement, outstanding positions and
trading volume, as opposed to focusing on a company's fundamentals and, as such, may not match with a report on a company's
fundamentals.
The information in this document has been printed on the basis of publicly available information, internal data and other reliable
sources believed to be true, but we do not represent that it is accurate or complete and it should not be relied on as such, as this
document is for general guidance only. Angel Broking Pvt. Limited or any of its affiliates/ group companies shall not be in any way
responsible for any loss or damage that may arise to any person from any inadvertent error in the information contained in this report.
Angel Broking Pvt. Limited has not independently verified all the information contained within this document. Accordingly, we cannot
testify, nor make any representation or warranty, express or implied, to the accuracy, contents or data contained within this document.
While Angel Broking Pvt. Limited endeavors to update on a reasonable basis the information discussed in this material, there may be
regulatory, compliance, or other reasons that prevent us from doing so.
This document is being supplied to you solely for your information, and its contents, information or data may not be reproduced,
redistributed or passed on, directly or indirectly.
Neither Angel Broking Pvt. Limited, nor its directors, employees or affiliates shall be liable for any loss or damage that may arise from
or in connection with the use of this information.
Note: Please refer to the important ‘Stock Holding Disclosure' report on the Angel website (Research Section). Also, please refer to the
latest update on respective stocks for the disclosure status in respect of those stocks. Angel Broking Pvt. Limited and its affiliates may
have investment positions in the stocks recommended in this report.
Disclosure of Interest Statement
Wonderla Holidays
1. Analyst ownership of the stock
No
2. Angel and its Group companies ownership of the stock
No
3. Angel and its Group companies' Directors ownership of the stock
No
4. Broking relationship with company covered
No
Note: We have not considered any Exposure below ` 1 lakh for Angel, its Group companies and Directors
Ratings (Based on expected returns
Buy (> 15%)
Accumulate (5% to 15%)
Neutral (-5 to 5%)
over 12 months investment period):
Reduce (-5% to -15%)
Sell (< -15)
August 31, 2015
18