Voltas | Construction & Eng.
December 21, 2015
Voltas
BUY
CMP
`304
UCP segment to drive the future earnings
Target Price
`353
Voltas is a market leader in the domestic air conditioning space. The Unitary
Investment Period
12 Months
Cooling Products (UCP) division dealing in air conditioning products contributes
dominantly to the company’s overall revenues. The other two divisions are the Electro-
Mechanical Projects (EMP) division and the Engineering Products Solutions division.
Stock Info
Sector
Construction & Eng.
Growth in Unitary Cooling Products segment to continue: Voltas has maintained
20%+ market share in the domestic air-conditioning (AC) market, despite stiff
Market Cap (` cr)
10,054
competition from MNC players. Its ‘numero uno’ position is owing to its (1) wide
Net debt (` cr)
(325)
distribution network (over 10,000 touch-points), (2) wide portfolio of 50+ models
Beta
1.3
(new launches scheduled in 4QFY2016), (3) strong post-sale support (inc. 5-year
52 Week High / Low
360/227
warranty on compressor), and (4) strong advertising focus (Top 5 Media spender
amongst AC players). With economic indicators turning favorable and summers
Avg. Daily Volume
1,683,183
ahead, the company’s competitive positioning should help UCP segment to report
Face Value (`)
1
12.2% top-line and 10.0% EBIT CAGR, respectively, during FY2015-18E.
BSE Sensex
25,519
Gradual recovery in the EMP business: Voltas’ EMP business is adversely affected
Nifty
7,762
due to the prevalent weak awarding environment, slow execution and cost
Reuters Code
VOLT.BO
over-runs. In run-up to Qatar World Cup 2022 and Dubai Expo 2020, we expect
international awarding activity to gradually catch-up from FY2017E onwards.
Bloomberg Code
VOLT@IB
Surge in order book should translate to uptick in execution (we expect 7.3%
top-line CAGR during FY2015-18E). With legacy projects nearing completion and
contribution of high margin projects kicking-in, we expect segment margins to
Shareholding Pattern (%)
expand from 1.0% in FY2015 to 5.0% in FY2018E.
Promoters
30.3
Balance Sheet strength: Voltas pursues an asset light business model, and in the
MF / Banks / Indian Fls
26.8
due course of business, it resorts to outsourcing and strategic tie-ups, thereby
FII / NRIs / OCBs
21.1
enables it to control its operating costs and generate high profitability. As a result,
Indian Public / Others
21.8
we expect Voltas to revert to it its earlier trend of higher RoEs. Given the asset light
business model, the company has been generating strong cash flows (it generated
`618cr of cash flows from business during FY2013-15). As of 2QFY2016-end,
Voltas is a debt free company (on net basis), with cash balance of `247cr.
Abs. (%)
3m 1yr 3yr
Attractive Valuations: At the current market price of `304, Voltas is trading at
Sensex
(2.6)
(7.9)
31.2
FY2017E and FY2018E P/E multiple of 22.1x and 18.1x, respectively. With
Voltas
17.1
21.5
179.7
economic cues turning favorable, and given Voltas’ strong market positioning
within the AC space, coupled with an expected gradual recovery in its EMP
segment, we expect the company to report 9.5% top-line and 13.1% bottom-line
3-Year Daily price chart
CAGR during FY2015-18E. Considering high contribution of UCP segment (72%
400
of FY2015 EBIT) to overall profitability, and limited left-over legacy orders in the
350
EMP segment, we have compared Voltas to Hitachi (which is trading at FY2018
300
P/E multiple of ~36.0x). We assign Voltas a 21.0x P/E multiple to our FY2018E
250
EPS estimate of `16.8 to arrive at a price target of `353. Given the upside, we
200
initiate coverage on Voltas with a Buy rating.
150
Key Financials
100
Y/E March (` cr)
FY13
FY14
FY15
FY16E
FY17E
FY18E
50
Net Sales
5,531
5,266
5,183
5,363
5,963
6,808
0
% chg
6.7
(4.8)
(1.6)
3.5
11.2
14.2
Net Profit
208
245
384
364
455
556
% chg
28.2
18.1
56.6
(5.4)
25.2
22.1
Source: Company, Angel Research
EBITDA (%)
4.4
5.0
7.9
8.0
9.1
9.8
EPS (`)
6.3
7.4
11.6
11.0
13.8
16.8
P/E (x)
48.3
40.9
26.1
27.6
22.1
18.1
P/BV (x)
6.2
5.5
4.8
4.2
3.7
3.2
RoE (%)
12.8
14.2
19.6
16.2
17.9
19.1
RoCE (%)
19.3
22.4
36.4
35.9
37.3
38.3
Yellapu Santosh
EV/Sales (x)
1.8
1.9
1.9
1.8
1.6
1.4
022 - 3935 7800 Ext: 6811
EV/EBITDA (x)
40.8
37.7
24.2
22.7
17.7
13.9
Source: Company, Angel Research; Note: CMP as of December 18, 2015
Please refer to important disclosures at the end of this report
1
Initiating coverage | Voltas
Investment Rationale
AC business growth story intact
AC sales in India have been in the range of 3.5-3.75mn units annually for the last
2-3 years, lower than the commensurate sale in China of 55mn units. Currently,
AC penetration in India stands at ~4% vs ~25% in China and ~50% in Korea.
Various industry participants indicate that AC sales should see a strong 10-15%
growth for the next 3-5 years, given the current low penetration levels.
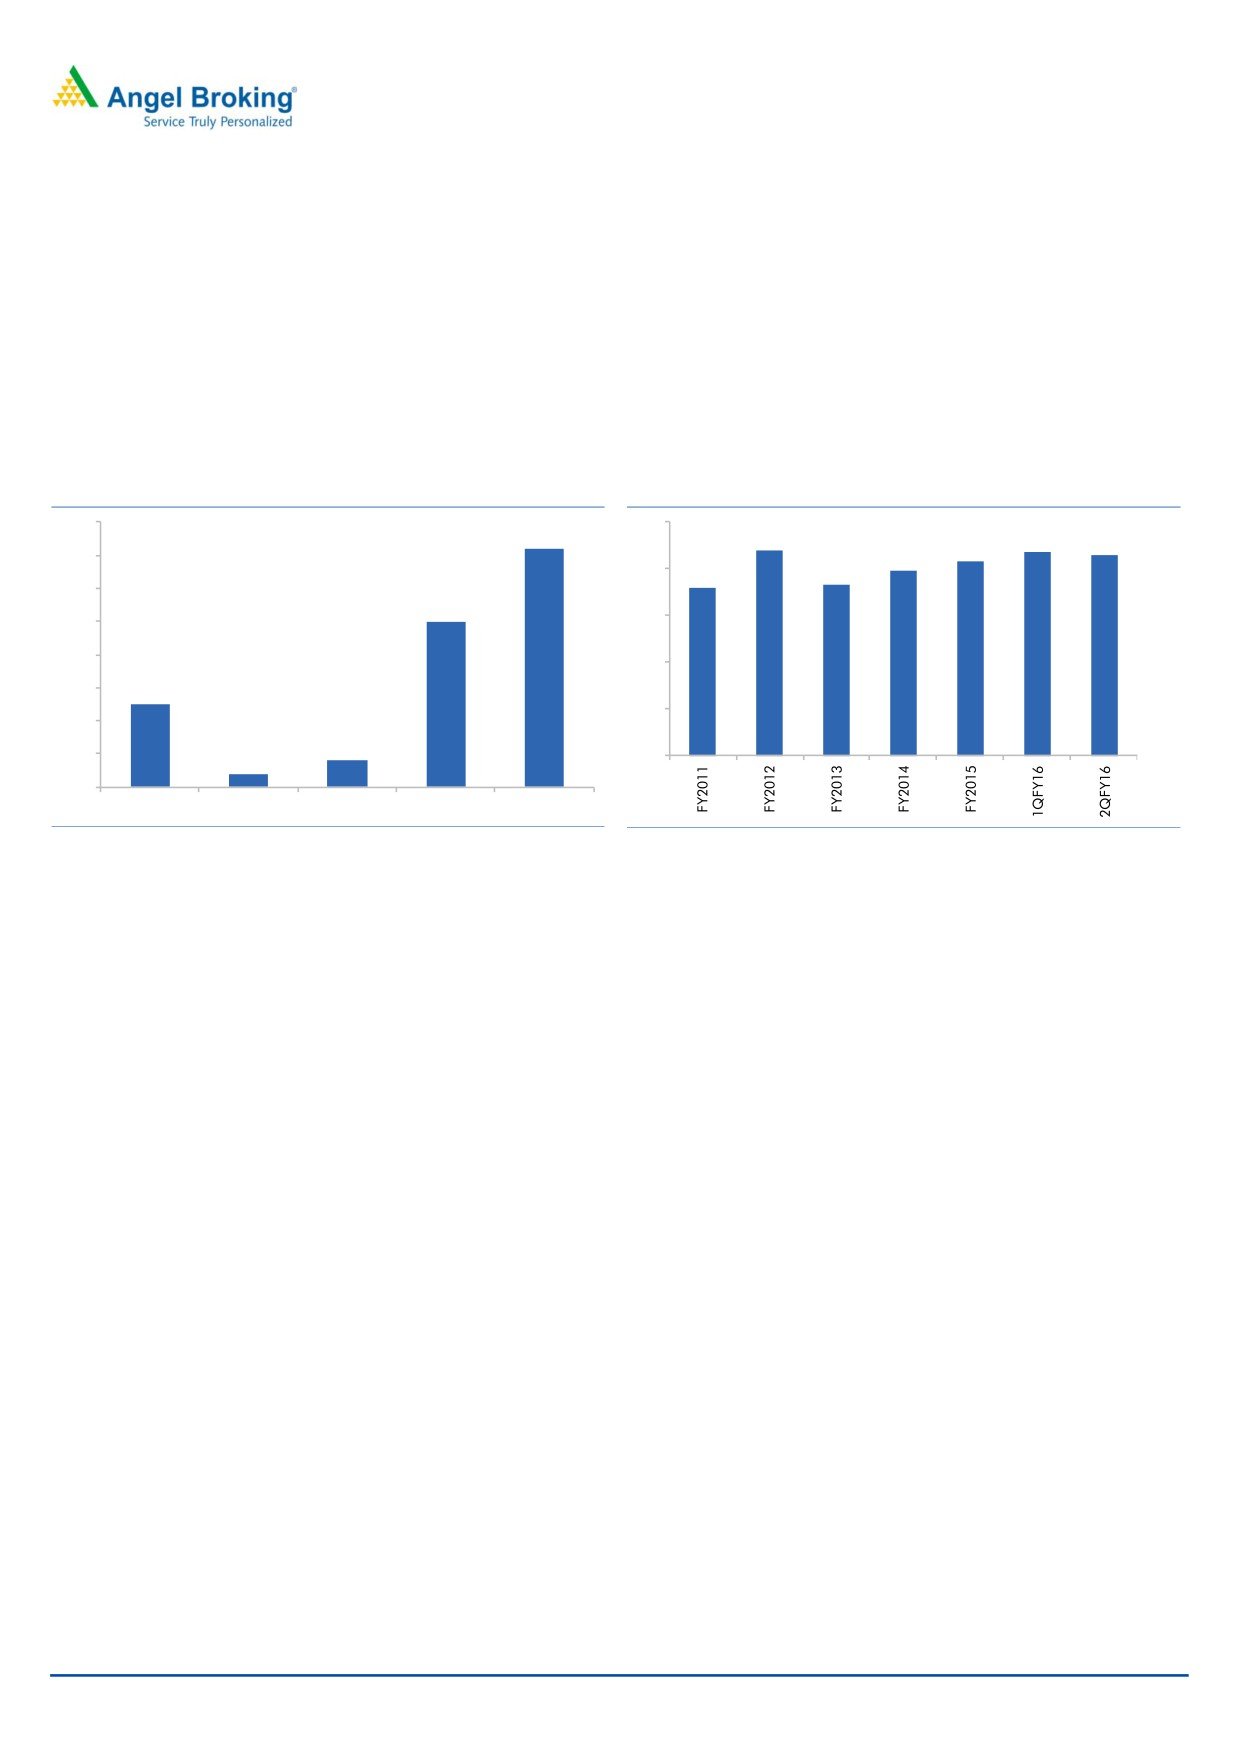
Exhibit 1: AC Sales Penetration (%)
Exhibit 2: Voltas’ Market share
80
72
25
22
22
21
21
70
20
20
18
18
60
50
15
50
40
10
30
25
5
20
8
10
4
0
0
China
India
Indonesia
Korea
Singapore
Source: Company, Angel Research
Source: Company, Angel Research
The UCP segment reported
16.9% top-line CAGR during FY2013-15 to
`2,510cr. Voltas’ market share grew from ~18% in FY2013 to 21% levels as of
2QFY2016-end. The market share gain, as per our sense, came on the back of
the following reasons, (1) growth in dealership/touch points network from 5,300 in
FY2012 to over 10,000 as of 2QFY2016-end, (2) strong penetration into multi-
brand dealers’ network (where it enjoys high market share), (3) strong sales
network in Tier II and III cities (account for almost half of the total AC sales),
(4) successful poaching of top talent from its peers, (5) focus on post sale support
(which includes 5-year warranty on compressors), (6) initiating strong advertising
campaigns to create a distinct brand (Voltas is among the top-5 spenders on
television and print media advertising among the AC players), (7) focus on product
innovation, and (8) tie-ups with more financing firms.
December 21, 2015
2
Initiating coverage | Voltas
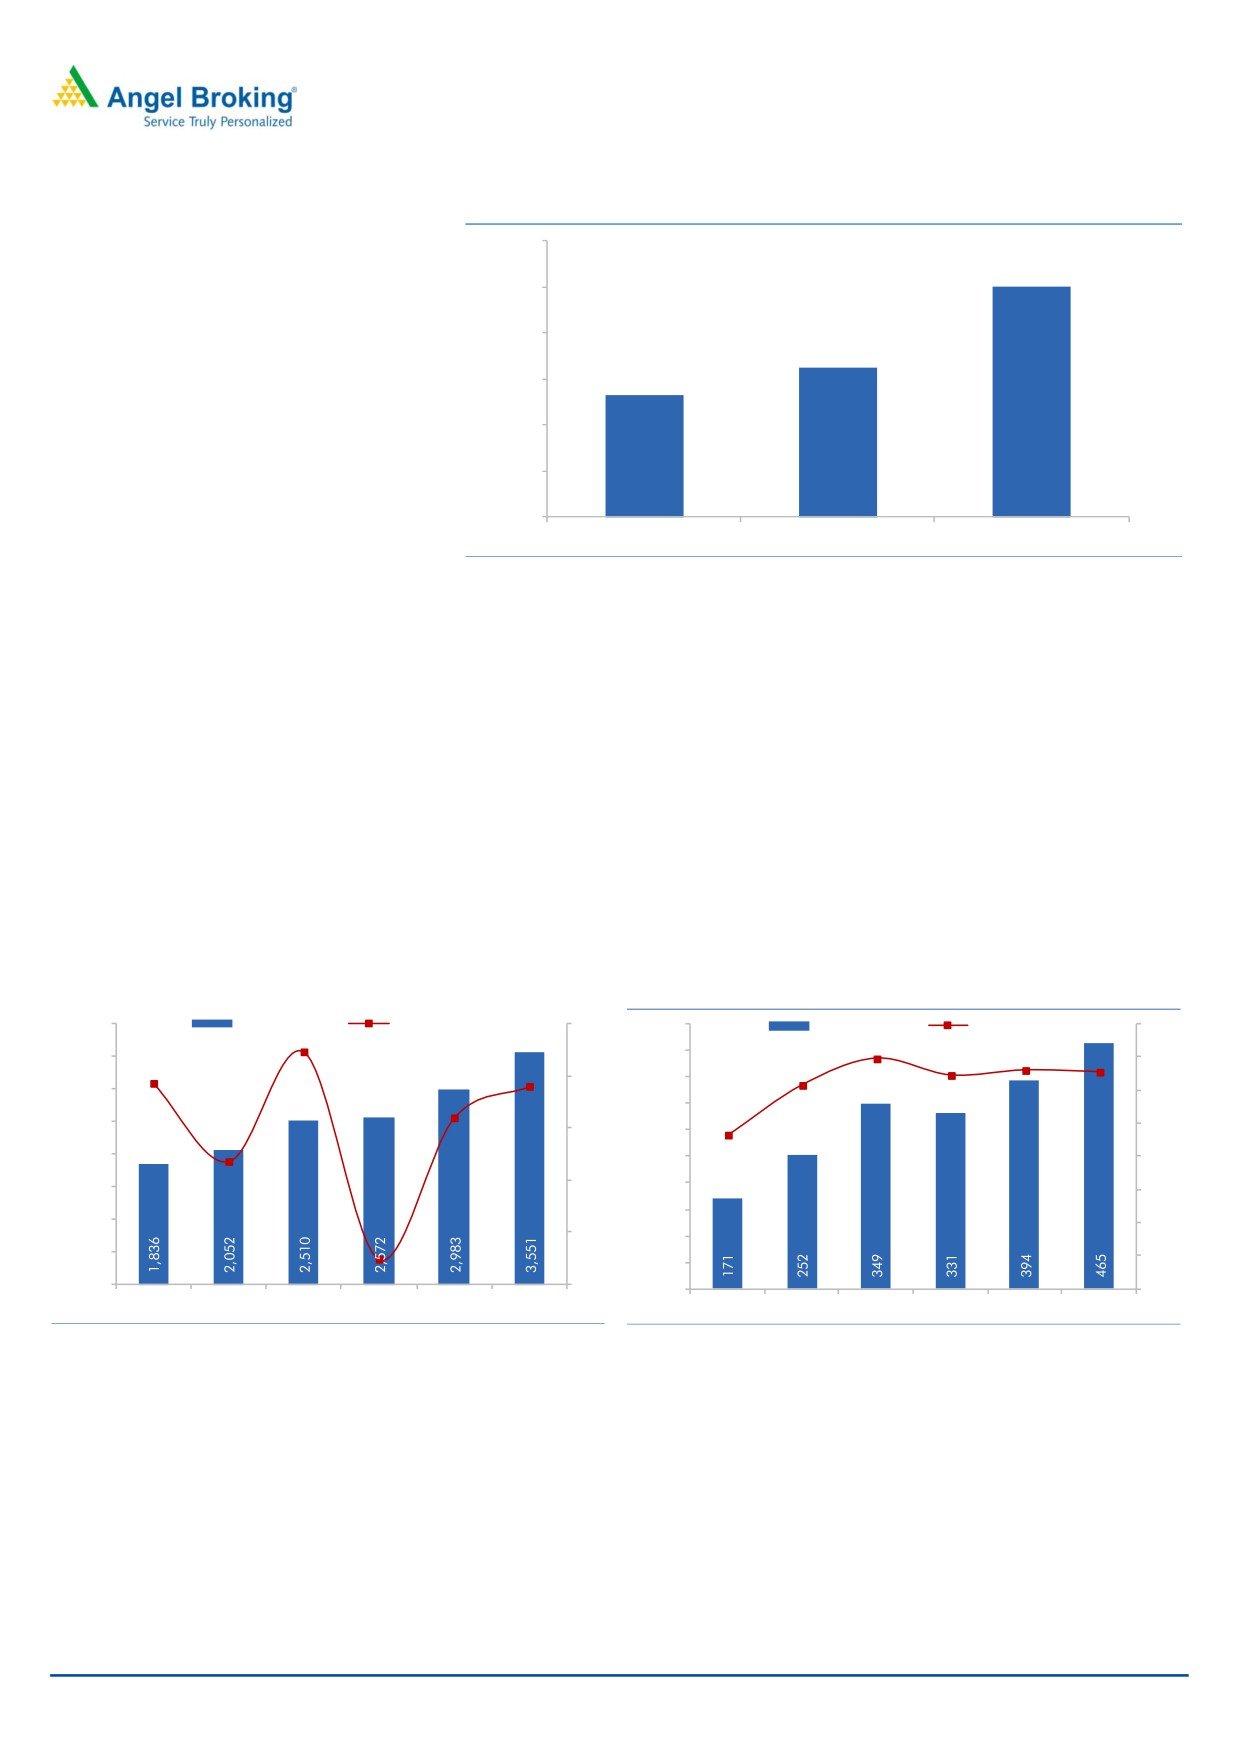
Exhibit 3: Voltas- Number of sale touch-points
12,000
10,000
10,000
8,000
6,500
6,000
5 ,300
4,000
2,000
0
FY2012
FY2014
2QFY2016
Source: Company, Angel Research
Unfavorable climate for the AC business in North India (accounts for 50% of
Voltas’ AC sales) led to ~10% yoy de-growth in the company’s sales across North
India in 1HFY2016. Despite weak North India sales, in a cut throat competitive
scenario with some players resorting to price cutting, Voltas maintained 21% of the
market share as of 2QFY2016.
Given the low AC penetration in India, gradual uptick in the economy and rising
urbanization, we expect AC sales to report strong 10-15% yoy growth for the next
3-5 years. Considering Voltas’ strong market positioning and its entry into the
Air-Coolers segment, we expect its sales to grow at par with the industry. This
should lead to Voltas sustaining its over-20% market share. On the whole, we
expect the UCP segment to report 12.2% top-line CAGR during FY2015-18E.
Exhibit 4: To maintain leadership position in AC business
Exhibit 5: EBIT % to stabilise at ~13% levels in UCP segment
4,000
Revenue (` in cr)
yoy growth (%)
25
500
Unadj. EBIT (` cr)
Margins (%)
16
450
3,500
14
19.3
19.0
22.3
20
400
13.9
3,000
13.2
12
16.0
12.9
13.1
350
12.3
2,500
10
15
300
11.8
2,000
250
9.3
8
10
200
1,500
6
150
1,000
2.4
4
5
100
500
2
50
0
0
0
0
FY2013
FY2014
FY2015
FY2016E FY2017E FY2018E
FY2013
FY2014
FY2015
FY2016E FY2017E FY2018E
Source: Company, Angel Research
Source: Company, Angel Research
In the last few years, consumer buying preferences have shifted towards Split ACs
in comparison to Window ACs, which were more in demand earlier. Over the
years, this has resulted in a shift in the segment product mix, with increased
contribution of Split ACs vs Window ACs. The company in delivering products of
superior quality. There have been provision write-backs, thereby contributing to
segment margin expansion (from 10.1% in FY2010 to 13.9% in FY2015). Despite,
correction in raw material prices, we expect Voltas to feel the heat of competition
from MNCs. Accordingly we expect Voltas to report segment margins of ~13.0%
levels during FY2016-18E.
December 21, 2015
3
Initiating coverage | Voltas
EMP business to recover gradually
Weak awarding activity, payment delays, client specific issues at some large ticket
projects (these projects were won on fixed cost basis, and they experienced cost
escalations on account of client side design changes and other business reasons),
led Voltas to report a negative 16.9% top-line CAGR during FY2013-15 to
`2,209cr. Similarly, segment margins during the same period were under pressure
owing to (1) zero level margins being booked from SIDRA project, (2) higher
provisions for some of the projects in order to comply with AS-7, (3) execution of
fixed cost projects in international markets, which were won at cut throat
competition, and (4) execution delays (owing to design changes from the client
side).
The Management highlighted that currently the domestic market is characterised
by limited awarding activity, high competition from the local players and stretched
working capital cycles. Realising the emerging business dynamics, Voltas is
following selective business strategy, with emphasis on cash flow profile and
project level profitability. Management expects recovery in capex and gradual
uptick in the domestic EMP segment awarding scenario from FY2017E onwards.
In the Middle East markets, correction in oil prices has raised concerns of a
slowdown in the capex cycle in the region. 2 mega events are slated in the Middle
East, going forward, ie the Dubai Expo 2020 and the Qatar Football World Cup
2022. In the run-up to preparation for these 2 events, we expect awarding to pick-
up in Qatar and UAE from FY2017E onwards. We do not expect awarding activity
to be affected due to the corrective trend in oil prices as both of these countries are
gas dependent and are borrowing economies.
Voltas restructured its business approach as well as its operations. The company
(1) has made leadership changes and strengthened its operations team by
defining the business boundaries, (2) defined new parameters, which would
indicate whether or not to bid for a project, and (3) is now resolving to a selective
approach while bidding for new projects with a focus on accruing reasonable
margins rather than following a turnover based growth approach.
Given the company’s resolve to follow a selective bidding strategy, we expect it to
report 5.2% order inflow CAGR during FY2015-17E. With uptick in awarding
activity in the Middle East, we expect Voltas to report a 27.0% yoy increase in its
FY2018E order inflows to `3,500cr.
December 21, 2015
4
Initiating coverage | Voltas
Exhibit 6: Order Inflows to gradually catch-up...
Exhibit 7: OB/LTM sales ratio to improve to 1.9x...
4,000
Order Inflows (` in cr)
yoy growth (%)
30
6,000
Order Book (` in cr)
OB/LTM ratio (x)
2.0
3,500
1.9
1.8
3,500
25
27.0
5,000
1.8
1.6
1.7
1.7
3,000
2,755
20
2,627
2,585
2,490
2,500
1.3
1.4
4,000
1.2
2,500
15
1.2
2,000
10
3,000
1.0
10.2
0.8
1,500
5
2,000
(1.6)
0.6
1,000
0
0.4
0.4
1,000
500
(5)
0.2
(3.7)
0
(10)
0
0.0
FY2013
FY2014
FY2015
FY2016E FY2017E FY2018E
FY2013
FY2014
FY2015
FY2016E FY2017E FY2018E
Source: Company, Angel Research
Source: Company, Angel Research
The EMP segment’s order book as of 2QFY2016-end stands at
`3,599cr,
reflecting order book to Last Twelve Month (LTM) sales ratio of 1.6x. Domestic
orders constituted ~52%, whereas the remaining orders are from the international
markets (mainly from Middle East countries like Qatar, UAE and Oman). Despite
weak near-term awarding trends, we expect gradual recovery in the domestic and
international business from FY2017E onwards. Recovery in order wins should be
followed by uptick in execution. Accordingly, we expect a 9.2% order book CAGR
during FY2015-18E to `5,074cr.
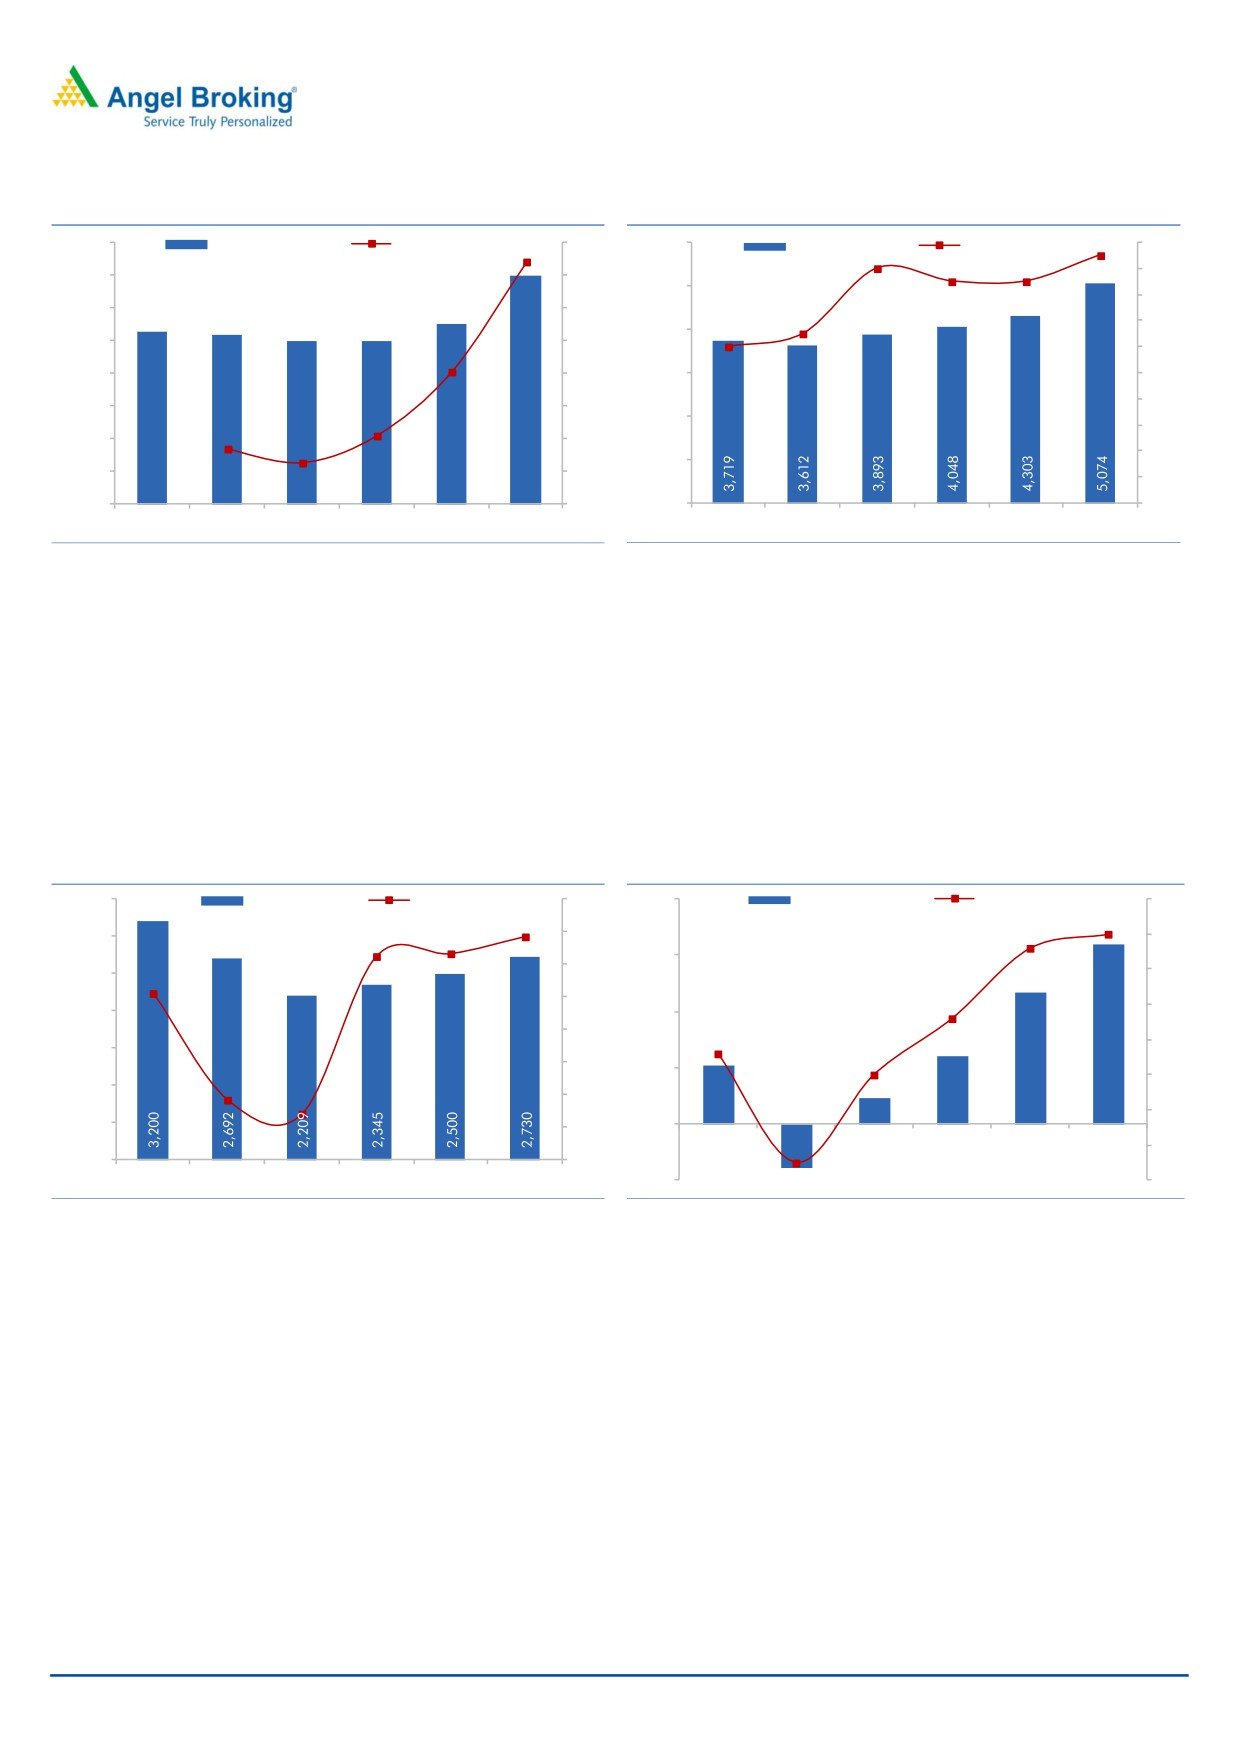
Exhibit 8: Execution momentum to catch-up...
Exhibit 9: EBIT % set to expand from here-on...
3,500
Revenues (` in cr)
yoy growth (%)
15
200
Unadj. EBIT (` in cr)
Margins (%)
6
160
10
5.0
5
3,000
9.2
4.6
6.2
6.6
150
5
116
2,500
4
0.5
0
3
2,000
100
2.6
(5)
60
2
1,500
51
1.6
(10)
50
1
1,000
23 1.0
(15)
(15.8)
(18.0)
0
500
(20)
0
FY2013
FY2014
FY2015
FY2016E FY2017E FY2018E
(1)
0
(25)
(1.5)
FY2013
FY2014
FY2015
FY2016E FY2017E FY2018E
(50)
(39)
(2)
Source: Company, Angel Research
Source: Company, Angel Research
At the back-drop of uptick in new order wins, we expect execution to catch-up,
resulting in
7.3% top-line CAGR during FY2015-18E to
`2,730cr. Voltas’
Management has highlighted that all the legacy projects in the order book would
get completed in FY2016E. Post completion of these projects, the Management
would be executing the recently won good margin orders (4-5% EBIT margins),
which in their view have come at reasonable commercial terms. Accordingly, we
expect the EMP segment to report 91.4% EBIT CAGR during FY2015-18E (EBIT
margins to expand from 1.0% in FY2015 to 5.0% in FY2018E).
Earnings growth to be driven by UCP segment…
Growth across Voltas during FY2013-15 has been driven by the UCP segment,
which reported 16.9% top-line and 42.7% EBIT CAGR, respectively. Negative
33.3% EBIT CAGR from the EMP segment, during the same period, was offset by a
favorable performance from the UCP segment. In other words, the EMP segment’s
December 21, 2015
5
Initiating coverage | Voltas
contribution to EBIT mix in the last few years has declined from 16.7% in FY2013
to 4.7% in FY2015. We expect the EMP segment to report 6.2% revenue CAGR
during FY2015-17E and from there-on, on the back of new order wins, the
segment is expected to report a revenue growth of 9.2% yoy in FY2018E.
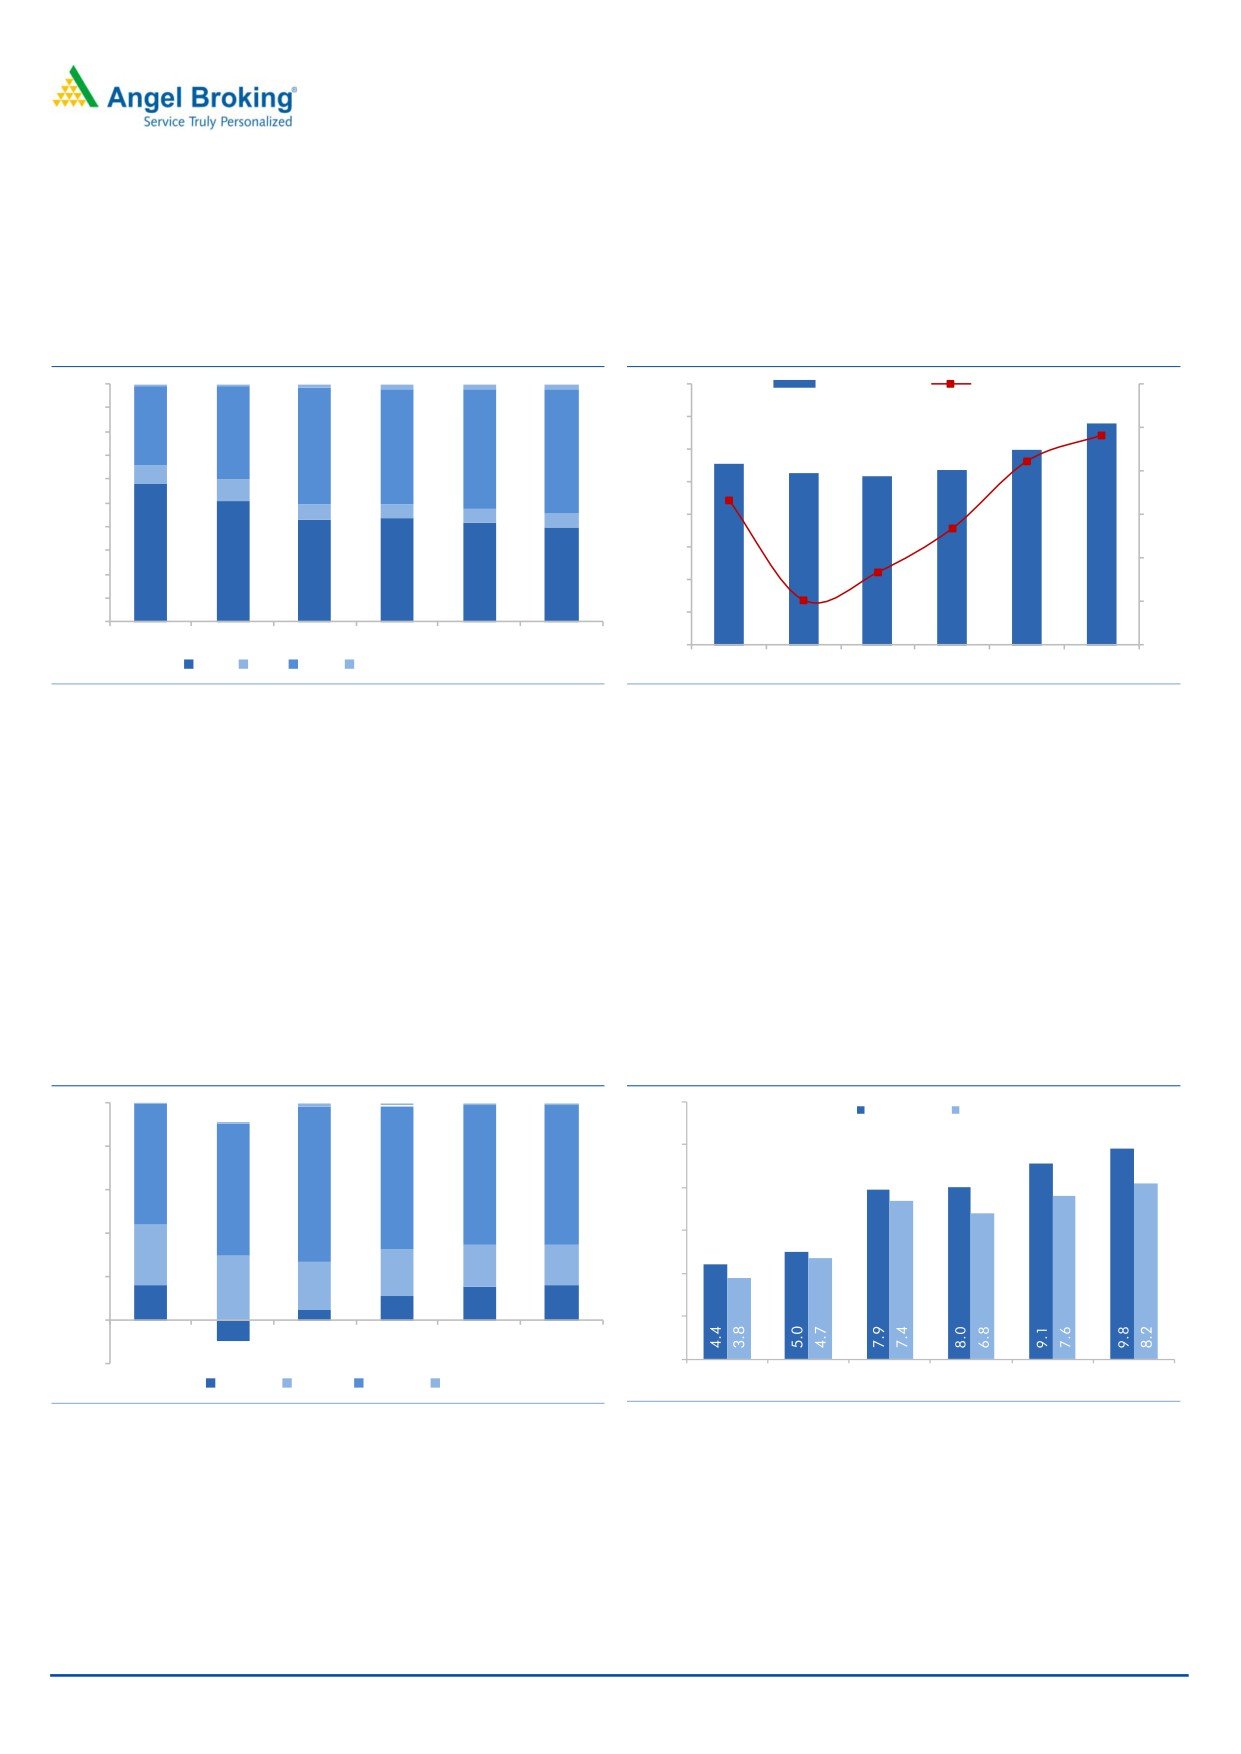
Exhibit 10: Segment-wise Revenue mix movement
Exhibit 11: Consol. Revenue & yoy growth
100%
8,000
Revenue (` in cr)
yoy growth (%)
20
1
1
1
2
2
2
6,808
90%
7,000
80%
33
39
5,963
15
49
48
50
5,531
14.2
70%
52
6,000
5,363
5,266
5,183
11.2
8
10
60%
5,000
9
50%
6.7
7
6
6
4,000
5
6
40%
3.5
30%
3,000
58
0
51
20%
43
44
42
40
(1.6)
2,000
10%
(4.8)
(5)
1,000
0%
FY2013
FY2014
FY2015
FY2016E
FY2017E
FY2018E
0
(10)
EMP EPS UCP Others & Inter-seg. Rev.
FY2013
FY2014
FY2015
FY2016E FY2017E FY2018E
Source: Company, Angel Research
Source: Company, Angel Research
On considering (1) expected structural uptick in domestic AC industry for next
3-5 years, (2) strong market positioning of Voltas within the domestic AC industry,
(3) wide pan-India distribution network (with over 10,000 touch points), and
(4) strong brand perception enjoyed by Voltas, we are optimistic that the UCP
segment’s contribution to overall business would remain so. We expect the UCP
segment to report a
12.2% top-line and
10.0% bottom-line CAGR during
FY2015-18E, respectively. With legacy projects nearing completion (by FY2016E)
and possible increase in contribution of newly won projects at 4-5% EBIT margins,
we are optimistic that the EMP segment would make a meaningful
17%
contribution to the consol. EBIT in FY2018E.
Exhibit 12: Segment-wise EBIT mix movement
Exhibit 13: Consol. EBITDA & PAT Margins
100%
12.0
0
1
1
1
1
EBITDA (%) PAT (%)
0
80%
10.0
56
66
64
64
60%
75
72
8.0
40%
6.0
27
19
19
20%
21
4.0
37
22
17
12
16
17
0%
5
2.0
(12)
FY2013
FY2014
FY2015
FY2016E
FY2017E
FY2018E
0.0
-20%
FY2013
FY2014
FY2015
FY2016E FY2017E FY2018E
EMP
EPS
UCP
Others
Source: Company, Angel Research
Source: Company, Angel Research
In a highly competitive AC sales environment, characterized by competitors
resorting to price cuts, we expect Voltas to be less affected. Our view stems on
account of the following, (1) Voltas’ ACs are competitively priced vis-a-vis its peers
(which until now have focused on maintaining higher realizations), (2) sharp fall in
commodity prices, especially copper, (3) emphasis on advertising (Voltas has been
among the top-5 ad spenders in the AC industry), and (4) one of the few players
December 21, 2015
6
Initiating coverage | Voltas
with strong post-sale support (offers 5-year warranty for compressors). We expect
the UCP segment to maintain its EBIT margins ~13.0% levels during FY2016-18E.
On a whole, UCP segment should help Voltas report a 9.5% top-line and 13.1%
bottom-line CAGR during FY2015-18E.
Strong Balance Sheet & Return ratios…
Voltas pursues an asset light business model, and in the due course of business, it
does outsourcing and strategic tie-ups, thereby helping it in controlling operating
costs and generating high profitability ratios (vs other infrastructure & EMP
players). As a result, the company has been able to maintain higher RoEs. Given
the asset-light nature of Voltas’ business, the company has generated `618cr of
cash flow from operations during FY2013-15. At 2QFY2016-end, Voltas is a debt
free company (on net basis), sitting on a cash balance of `247cr. Its strong
balance sheet position gets reflected in its RoEs, which expanded from 12.8% in
FY2013 to 19.6% in FY2015. Considering that the cash flow generating potential
of the company would be maintained going forward, we expect Voltas to report
16-19% RoEs for FY2016-18E.
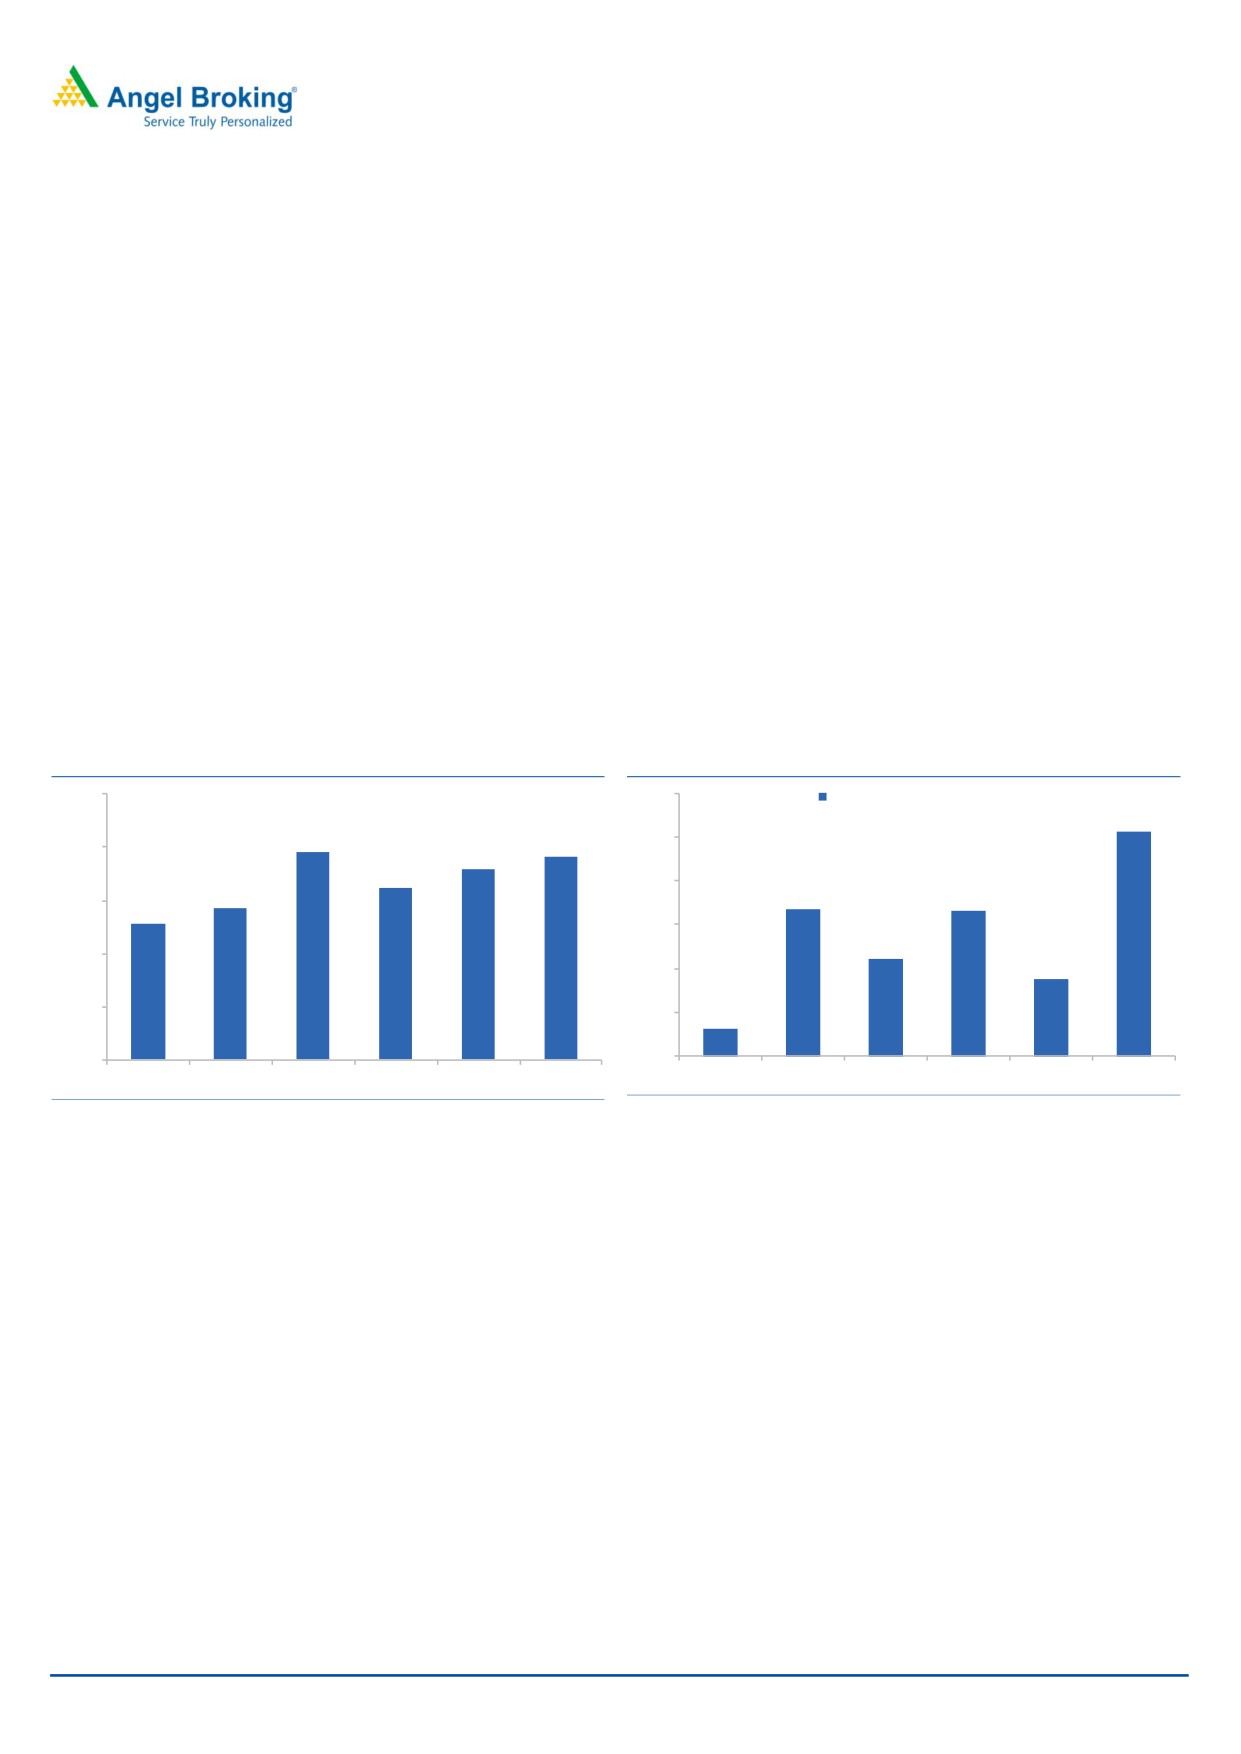
Exhibit 14: Return on Equity (%)
Exhibit 15: Cash flow from Operations
25.0
600
Cash flow from Operations (` in cr)
511
19.1
19.6
17.9
500
20.0
16.2
400
14.2
334
331
15.0
12.8
300
221
10.0
175
200
5.0
100
64
0.0
0
FY2013
FY2014
FY2015
FY2016E
FY2017E
FY2018E
FY2013
FY2014
FY2015
FY2016E
FY2017E
FY2018E
Source: Company, Angel Research
Source: Company, Angel Research
December 21, 2015
7
Initiating coverage | Voltas
Understanding the Business Model
Voltas conducts its entire business under 3 key heads, namely Unitary Cooling
Products (UCP), Electro Mechanical Projects & Services (EMP) and Engineering
Products & Services (EPS). Amongst the 3 business segments, UCP is the largest
one, with it having contributed ~49% and ~72% of FY2015 consolidated revenues
and EBIT, respectively.
Exhibit 16: FY2015- Consol. Revenue Mix
Exhibit 17: FY2015- Consol. unadj. EBIT Mix
Others, 1%
Others, 1%
EMP Segment,
5%
EPS Segment,
EMP Segment,
22%
43%
UCP Segment,
49%
UCP Segment,
72%
EPS Segment,
7%
Source: Company, Angel Research
Source: Company, Angel Research
(A) Electro Mechanical Projects & Services (EMP) segment
Voltas, in the last two decades, has transformed itself from being a HVAC
(Heating, Ventilation and Air-Conditioning) player to EMP (Electro Mechanical
Projects & Services) player. With larger ticket size projects being awarded, the trend
of awarding the entire MEP project to a single vendor has gained prominence. The
current scope of work under the EMP segment includes Heating, Ventilation, Air
Conditioning, Power Management, Control Systems, Lightning Systems, Fire
Detection & Alarm, Water Treatment Systems, Rain Gutter Systems, Sewerage
Removal System and Fire Fighting System. For a given Building/ Hospital Building/
Education Building, the scope of MEP works account for ~35% of the project cost
in India. Whereas in the developed world, the share of MEP works in a complex
project can increase up to 40-45% of the total project cost.
If we look at the geographical split within the segment, then the international
business contributed 60%+ of segment revenues, with the remaining contribution
coming in from domestic markets. Again, within international markets, a
substantial chunk of revenues would flow-in from the Middle East markets
(especially Qatar, UAE and Oman).
The EMP business is a key business for Voltas, as this segment contributed ~49%
of average consol. revenues over FY2013-15. Despite strong top-line contribution,
large cost overruns across international business led to segmental EBIT level losses
in FY2012 and FY2014.
December 21, 2015
8
Initiating coverage | Voltas
OB/ LTM sales ratio at 1.6x gives revenue visibility…
The EMP segment’s order book as of 2QFY2016-end stands at
`3,599cr,
reflecting order book to Last Twelve Months (LTM) sales ratio of 1.6x. Domestic
orders constitute ~52%, whereas remaining orders are from international markets
(mainly from Middle East countries like Qatar, UAE and Oman). Despite weak
near-term awarding trends, we expect recovery going forward led by international
business from FY2017E onwards. Our assumption on recovery from international
markets is on factoring an expected catch-up in awarding in run-up to FIFA 2022
and Dubai Expo 2020 events.
During FY2012-15, the segment’s performance (mainly the international business)
was impacted due to ongoing disputes with clients (as projects were won on fixed
cost basis, and were experiencing cost escalations, on account of client side design
changes and other business reasons). On the whole, cut-throat competition in a
weak awarding environment led to weak execution and payment delays. As a
result, Voltas’ Management went ahead and restructured its operations as well as
its business.
Voltas’ Management has (1) made leadership changes and strengthened its
operations team by defining business boundaries, (2) defined new parameters,
which would indicate whether or not to bid for a project, (3) resolved to a selective
bidding strategy (focusing on new projects with reasonable margins instead of
following a turnover growth approach). These initiatives coupled with declining
proportion of low margin legacy projects indicate that margins are likely to
expand. Accordingly, we expect the segment’s EBIT margins to expand from 1.0%
in FY2015 to 5.0% in FY2018E.
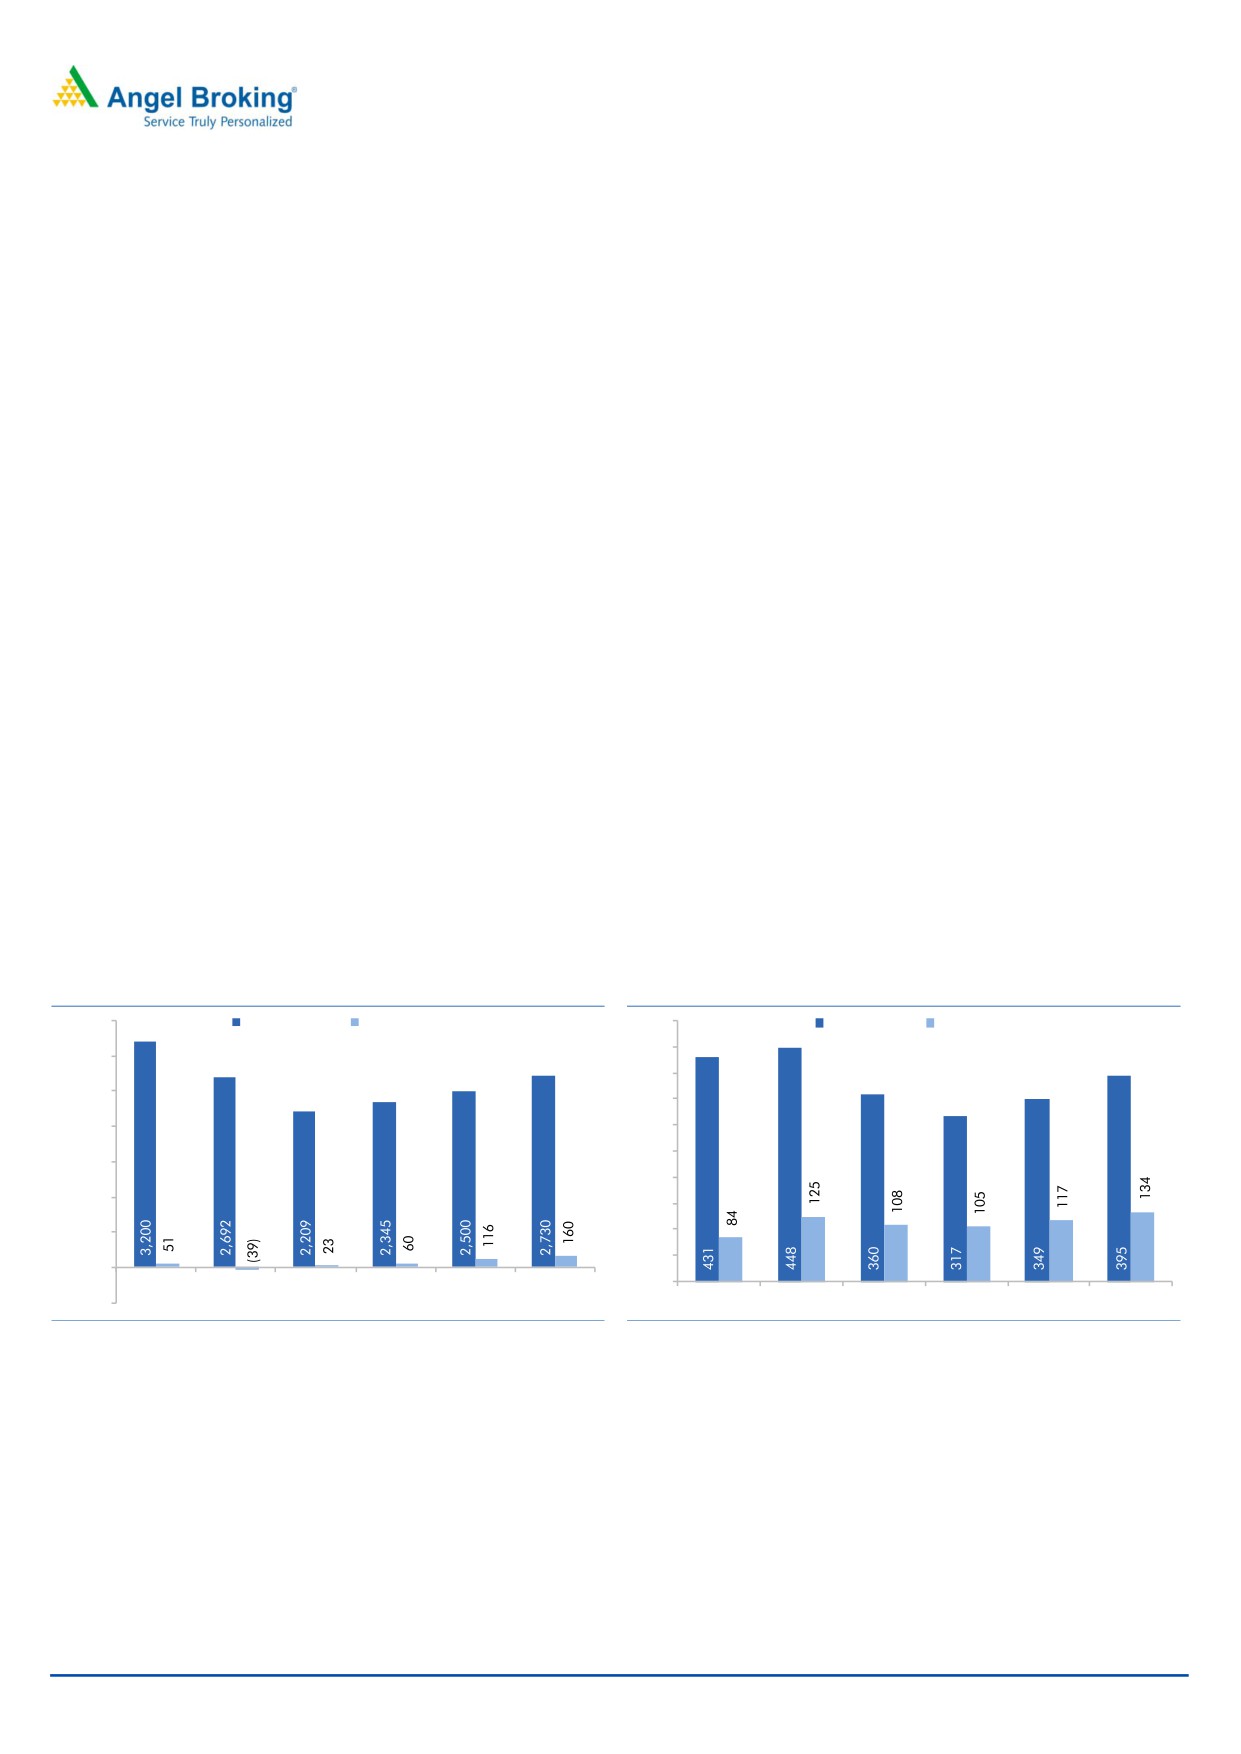
Exhibit 18: EMP Segment Financials
Exhibit 19: EPS Segment Financials
3,500
Revenue (` cr)
EBIT (` cr)
500
Revenue (` cr) EBIT (` cr)
450
3,000
400
2,500
350
2,000
300
250
1,500
200
1,000
150
500
100
50
0
FY2013
FY2014
FY2015
FY2016E FY2017E FY2018E
0
(500)
FY2013
FY2014
FY2015
FY2016E
FY2017E
FY2018E
Source: Company, Angel Research
Source: Company, Angel Research
(B) Engineering Products & Services (EPS) segment
The Engineering Products and Services (EPS) segment sells machinery and
equipment across 2 sub-verticals, namely, (1) Textile Machinery, and (2) Mining &
Construction Equipment. Voltas generates revenues from this segment in the form
of commission and non-commission revenues. Commission income comes from
the distribution of textiles as well as mining & construction equipment, as the
company does not manufacture these equipments. Non-commission income
mainly includes income from maintenance contract services drawn from
equipments sold.
December 21, 2015
9
Initiating coverage | Voltas
This segment showed flattish yoy revenue growth trend during FY2013-14, except
in FY2015-1QFY2016, when the company reported yoy de-growth. This de-growth
was owing to slowdown seen across the domestic mining industry, impact of
regulatory clam-downs on the mining sector and loss of clients (such as
Caterpillar) owing to global consolidation.
Exhibit 20: Sub-Segment Revenue mix (as of FY2015)
Exhibit 21: Business-wise Revenue mix (as of FY2015)
Mining &
O&M and
Construction
Spare Parts,
Equip., 40%
35%
Textile
Machinery,
Equipment
60%
Sales, 65%
Source: Company, Angel Research
Source: Company, Angel Research
Voltas acts as an agent for sale of machinery (Indian as well as foreign) across the
entire value chain of the textile industry, namely spinning, weaving, knitting,
processing and finishing applications. The company’s key principals include-
Lakshmi Machine Works (LMW; which has a major chunk of market share in the
domestic textile equipment industry) from India, and Terrot and Thies GmbH from
the international market.
The textile industry in India is currently undergoing tough times given the exports
decline in China, excess capacity in the domestic markets, muted yarn prices and
technological advancements happening within the sector (especially weaving,
knitting & processing and finishing divisions). Lack of clarity on the government
plan to extend support towards Technology Up gradation Fund Scheme (TUFS) is
leading to subdued demand. Despite these adversaries, spurt in demand from
some states held the sub-segment revenue growth in 2QFY2016.
After a few quarters of muted performance, the Mining & Construction Equipment
sub-segment has reported some signs of growth in 2QFY2016. The mining
equipment sector has been impacted due to re-tendering activity and delays in
uptick in the capex cycle.
Within the Mining & Construction Equipment sub-segment, low contribution from
the domestic business was offset up to a certain extent by high revenue
contribution from the African markets (especially from the Mozambique business).
In-line with the Management’s commentary, we expect FY2016 to be a weak year
for the company. Thereafter, we expect gradual uptick in the segment’s business.
The Management has highlighted that strategic focus on the spare parts and
servicing business, maintaining strong customer relations, uptick in construction
activity, as well as diversification into the post spinning space (within the Textiles
Machinery space) should help the segment report growth, going forward. On the
whole, we expect this segment to report a 3.1% top-line CAGR during FY2015-18E
to `395cr.
December 21, 2015
10
Initiating coverage | Voltas
Despite a weak 1HFY2016 in terms of revenues, the reported EBIT margin stood
impressive at ~35% levels, owing to strong service business contribution from the
Mozambique markets. We expect the segment’s EBIT margin to be at ~33% levels
going forward during FY2016-18E (vs 30.0% in FY2015).
(C) Unitary Cooling Products (UCP) segment
Voltas has built a strong brand name and has emerged as one of the largest air
conditioner players with in the domestic AC markets. At 2QFY2016-end, as per a
report by AC Neilson, Voltas enjoys 21% market share of the Indian AC market,
with the second nearest competitor having a market share lower by ~400bp.
Apart from being present in the domestic AC market, Voltas has gone ahead and
deployed cooling solutions expertise towards Cold Chain Storage, Retail and Food
Processing industries. The Commercial Refrigeration sub-segment’s offerings
include Package and Ductable Air conditioners, VRF Technology, and Chillers. The
current product range includes Voltas’ in-house manufactured product range: ie
Package and Ductable Air conditioners: 5.5-22 TR (Ton of refrigeration); Chillers
range include- Screw Chiller Packages: 80-500 TR; Scroll Chillers: 12-100 TR and
Vapour Absorption Machines: 40-1,450 TR.
Home AC penetration in India currently stands at ~4%, well below 50-70% levels
across developed nations and 25-40% levels across some of developing nations
(includes countries like Thailand and Malaysia). On account of growing disposable
incomes, upcoming summer season, declining maintenance costs, attractive
consumer financing options and increased availability of power, we expect
penetration levels in the Indian AC market to reach 10% over the next 5 years.
Expected surge in the penetration levels translates to ~10-15% increase in the
market size over the next 3-5 years.
The UCP segment contributed ~49% of the FY2015 consol. revenues and ~72%
of the FY2015 consol. EBIT. Of the FY2015 UCP segment sales, the AC business
contributed ~75.0% of segment sales (total of ~0.4cr ACs were sold vs assembly
line capacity of ~0.7cr ACs) and remaining ~25.0% were from the Commercial
Refrigeration business.
UCP segment has reported impressive 16.9% revenue CAGR during FY2013-15,
reflecting (1) market leadership position in domestic AC market, (2) wide pan-India
distribution network (with over 10,000 touch points), and (3) strong brand
perception being enjoyed by Voltas. The AC market in India reported de-growth in
1HFY2016, owing to ~10% de-growth seen across one of the largest AC markets
in India, ie North India. Strong market positioning in a growing AC market,
coupled with new product launches (scheduled in 4QFY2016), wide distribution
reach, entry into Air-Coolers space (expect to sell 1 lakh units p.a. by third year),
and strong post-sales support should help the UCP segment report 12.2% revenue
CAGR (on a high base) during FY2015-18E. Our assumptions capture a muted
2.4% yoy segment growth for FY2016, reflecting 1H numbers and strong sales
witnessed in the festive season. Seasonality aspect to AC sales has been declining
as urban India is looking upon ACs as a necessity. Accordingly, we expect 16.0%
and 19.0% yoy revenue growth in FY2017-18E.
Owing to shift in the product mix and higher sales of better quality product mix,
the company has reversed its provisions, resulting in improvement in the EBIT
margins. EBIT margins of the segment improved from 9.3% in FY2013 to 13.9% in
December 21, 2015
11
Initiating coverage | Voltas
FY2015. Despite stiff competition, correction in raw material prices should support
EBIT margins at 13%+ levels.
Valuation
At the current market price of `304, based on our estimates, the stock is trading at
FY2017E and FY2018E P/E of 22.1x and 18.1x, respectively.
With inflation under control, rate cuts announced, when coupled with Voltas’
strong positioning in the lowly penetrated AC market, comforts us that AC sales
should continue to report strong growth, going forward. In FY2015, the UCP
segment contributed ~72% of the consol. EBIT.
Also, completion of low margin EMP projects and increased contribution of high
margin projects indicate that the EBIT margins of the EMP segment would improve
from 1.0% in FY2015 to 5.0% in FY2018E.
On the whole, we expect Voltas to report a top-line and bottom-line CAGR growth
of 9.5% and 13.1% during FY2015-18E, respectively. Our growth assumption
captures (a) pick-up in international award activity, which should lead top-line
growth as well as EMP segment EBIT margin expansion, (b) continued growth in
domestic AC sales, with Voltas being able to retain its ‘Numero Uno’ status.
Noticeably in the last few years, the EBIT mix of Voltas has shifted from being
heavily dependent on the EMP segment to a now dominant share of the UCP
segment. The contribution of the UCP segment in the consol. EBIT has increased
from 32% in FY2011 to 72% in FY2015. We expect the same to be over 64% levels
during FY2016-18E. Considering the shift in the consol. EBIT mix, positive cues,
and case for improvement in the business segments’ performances, we expect
scope for improved profitability and better investment return ratios, going forward.
Considering the higher dependency on the UCP segment, we have compared
Voltas to Hitachi (which is trading at a FY2018 P/E multiple of ~36.0x). We assign
Voltas a 21.0x PE multiple to our FY2018E EPS estimate of `16.8/share and arrive
at a price target of `353. This reflects 16% upside potential from the current levels.
We initiate coverage on Voltas with a BUY rating from a 12-month perspective and
price target of `353.
Exhibit 22: 1-year forward P/E band (x)
Exhibit 23: 1-year forward Avg. P/E band (x)
400
40
350
35
300
30
250
25
200
20
150
15
100
10
50
5
0
0
Price (`)
7x
14x
21x
28x
Price (`)
Avg. P/E band (x)
Source: Angel Research
Source: Angel Research
December 21, 2015
12
Initiating coverage | Voltas
Risks to our Estimates
AC sales contributed ~36% of FY2015 consolidated revenues. Given that
Voltas is present only in the AC business across the entire Consumer Durables
space, loss of major market share could act as a risk to our estimates. Any
such development could lead to lower than expected EBIT contribution to the
consol. profits and our estimates.
Revenues from EPS segment are based on agreement for supplying Textile,
Mining & Construction equipment. Any termination of such agreements shall
impact our forecasted revenues for the segment.
Most of the long term international projects are fixed price contracts and in the
due course of its business, Voltas also imports. Any, adverse currency
fluctuations may impact the raw material pricing as well as margins.
Cancellation of Qatar World Cup 2022 or Expo 2020 could affect our EMP
segment assumptions.
December 21, 2015
13
Initiating coverage | Voltas
Profit and Loss Statement
Y/E March (` cr)
FY13
FY14
FY15
FY16E
FY17E
FY18E
Net Sales
5,531
5,266
5,183
5,363
5,963
6,808
% Chg
6.7
(4.8)
(1.6)
3.5
11.2
14.2
Total Expenditure
5,287
5,000
4,773
4,935
5,419
6,141
Cost of Raw Mat. Consumed
4,167
3,854
3,597
3,728
4,094
4,665
Employee benefits Expense
633
595
590
612
671
763
Other Expenses
487
551
586
594
654
713
EBITDA
244
266
410
428
544
667
% Chg
(27.5)
8.9
54.4
4.4
27.1
22.6
EBIDTA %
4.4
5.0
7.9
8.0
9.1
9.8
Depreciation
28
25
28
27
30
32
EBIT
216
241
382
401
513
635
% Chg
(28.6)
11.4
58.7
4.9
28.1
23.6
Interest and Financial Charges
38
23
23
17
13
8
Other Income
90
100
109
111
131
142
PBT
268
318
467
495
631
768
Exceptional Items
12
22
46
11
0
0
Prior Period Adjustments
0
0
0
0
0
0
Tax
73
94
128
142
177
215
% of PBT
27.2
29.6
27.3
28.6
28.0
28.0
PAT from ordinary activities
207
246
386
364
454
553
Share of Profit / (loss of Ass.)
1
(0)
(2)
(1)
1
3
& Minority Int. in (profit)/ loss
PAT
208
245
384
364
455
556
% Chg
28.2
18.1
56.6
(5.4)
25.2
22.1
PAT %
3.8
4.7
7.4
6.8
7.6
8.2
Diluted EPS
6.3
7.4
11.6
11.0
13.8
16.8
% Chg
28.2
18.1
56.6
(5.4)
25.2
22.1
December 21, 2015
14
Initiating coverage | Voltas
Balance Sheet
Y/E March (` cr)
FY13
FY14
FY15
FY16E FY17E FY18E
Sources of Funds
Equity Capital
33
33
33
33
33
33
Reserves & Surplus Total
1,593
1,786
2,069
2,340
2,674
3,075
Networth
1,626
1,819
2,102
2,373
2,707
3,108
Total Debt
261
263
122
185
85
70
Minority Interest
12
14
16
18
18
18
Long-term Liabilities & Prov.
120
122
130
150
153
156
Total Liabilities
2,019
2,218
2,370
2,725
2,963
3,351
Application of Funds
Gross Block
406
459
455
496
521
548
Accumulated Depreciation
195
251
266
293
324
355
Net Block
211
209
189
203
198
192
Capital WIP
0
2
4
8
6
7
Goodwill
89
80
80
80
80
80
Investments
407
732
1,094
1,068
1,078
1,083
Deferred Tax Assets
24
26
37
46
46
46
Inventories
978
901
867
923
1,042
1,190
Sundry Debtors
1,362
1,335
1,339
1,304
1,465
1,673
Cash and Bank Balance
350
282
252
510
484
851
Loans & Advances &
1,041
1,027
922
1,057
1,151
1,317
Oth. Current Assets
Current Liabilities
2,548
2,527
2,519
2,609
2,732
3,226
Net Current Assets
1,183
1,018
861
1,186
1,410
1,806
Other Assets
104
152
105
135
145
136
Total Assets
2,019
2,218
2,370
2,725
2,963
3,351
December 21, 2015
15
Initiating coverage | Voltas
Cash Flow Statement
Y/E March (` cr)
FY13
FY14
FY15
FY16E FY17E FY18E
Profit before tax
243
257
434
495
631
768
Depreciation
22
19
22
27
30
32
Other Adjustments
(147)
(40)
(248)
14
(61)
(61)
Change in Working Capital
21
164
83
(76)
(257)
(17)
Interest & Financial Charges (net)
17
8
10
12
8
4
Direct taxes paid
(92)
(74)
(80)
(142)
(177)
(215)
Cash Flow from Operations
64
334
221
331
175
511
(Inc)/ Dec in Fixed Assets
8
(20)
210
(44)
(23)
(27)
(Inc)/ Dec in Invest. & Int. received
36
(273)
(269)
26
56
62
Cash Flow from Investing
44
(292)
(59)
(19)
33
34
Inc./ (Dec.) in Borrowings
34
(19)
(140)
63
(100)
(15)
Issue/ (Buy Back) of Equity
0
0
0
0
0
0
Dividend Paid (Incl. Tax)
(61)
(57)
(64)
(93)
(121)
(155)
Finance Cost
(26)
(17)
(16)
(17)
(13)
(8)
Cash Flow from Financing
(53)
(93)
(221)
(46)
(234)
(178)
Inc./(Dec.) in Cash
54
(51)
(59)
266
(27)
367
Opening Cash balances
200
255
203
144
410
384
Closing Cash balances
255
203
144
410
384
751
December 21, 2015
16
Initiating coverage | Voltas
Key Ratios
Y/E March
FY13
FY14
FY15
FY16E FY17E FY18E
Valuation Ratio (x)
P/E (on FDEPS)
48.3
40.9
26.1
27.6
22.1
18.1
P/CEPS
42.6
37.2
24.4
25.7
20.7
17.1
Dividend yield (%)
0.6
0.6
0.7
0.8
1.0
1.3
EV/Sales
1.8
1.9
1.9
1.8
1.6
1.4
EV/EBITDA
40.8
37.7
24.2
22.7
17.7
13.9
EV / Total Assets
4.9
4.5
4.2
3.6
3.3
2.8
Per Share Data (`)
EPS (Diluted)
6.3
7.4
11.6
11.0
13.8
16.8
Cash EPS
7.1
8.2
12.5
11.8
14.7
17.8
DPS
1.9
1.9
2.3
2.4
3.2
4.0
Book Value
49.1
55.0
63.5
71.7
81.8
93.9
Returns (%)
RoCE (Pre-tax)
19.3
22.4
36.4
35.9
37.3
38.3
Angel RoIC (Pre-tax)
16.2
16.4
22.1
20.0
23.1
24.4
RoE
12.8
14.2
19.6
16.2
17.9
19.1
Turnover ratios (x)
Asset Turnover (Gross Block) (x)
13.6
12.2
11.3
11.3
11.7
12.7
Inventory / Sales (days)
65
65
62
61
60
60
Receivables (days)
90
93
94
90
85
84
Payables (days)
113
116
112
108
101
98
NWC days
41
43
45
43
44
46
Leverage Ratios (x)
Net D/E ratio (x)
(0.1)
(0.0)
(0.1)
(0.1)
(0.1)
(0.3)
December 21, 2015
17
Initiating coverage | Voltas
Research Team Tel: 022 - 39357800
DISCLAIMER
Angel Broking Private Limited (hereinafter referred to as “Angel”) is a registered Member of National Stock Exchange of India Limited,
Bombay Stock Exchange Limited and Metropolitan Stock Exchange of India Limited. It is also registered as a Depository Participant with
CDSL and Portfolio Manager with SEBI. It also has registration with AMFI as a Mutual Fund Distributor. Angel Broking Private Limited is
a registered entity with SEBI for Research Analyst in terms of SEBI (Research Analyst) Regulations, 2014 vide registration number
INH000000164. Angel or its associates has not been debarred/ suspended by SEBI or any other regulatory authority for accessing
/dealing in securities Market. Angel or its associates including its relatives/analyst do not hold any financial interest/beneficial
ownership of more than 1% in the company covered by Analyst. Angel or its associates/analyst has not received any compensation /
managed or co-managed public offering of securities of the company covered by Analyst during the past twelve months. Angel/analyst
has not served as an officer, director or employee of company covered by Analyst and has not been engaged in market making activity
of the company covered by Analyst.
This document is solely for the personal information of the recipient, and must not be singularly used as the basis of any investment
decision. Nothing in this document should be construed as investment or financial advice. Each recipient of this document should
make such investigations as they deem necessary to arrive at an independent evaluation of an investment in the securities of the
companies referred to in this document (including the merits and risks involved), and should consult their own advisors to determine
the merits and risks of such an investment.
Reports based on technical and derivative analysis center on studying charts of a stock's price movement, outstanding positions and
trading volume, as opposed to focusing on a company's fundamentals and, as such, may not match with a report on a company's
fundamentals.
The information in this document has been printed on the basis of publicly available information, internal data and other reliable
sources believed to be true, but we do not represent that it is accurate or complete and it should not be relied on as such, as this
document is for general guidance only. Angel Broking Pvt. Limited or any of its affiliates/ group companies shall not be in any way
responsible for any loss or damage that may arise to any person from any inadvertent error in the information contained in this report.
Angel Broking Pvt. Limited has not independently verified all the information contained within this document. Accordingly, we cannot
testify, nor make any representation or warranty, express or implied, to the accuracy, contents or data contained within this document.
While Angel Broking Pvt. Limited endeavors to update on a reasonable basis the information discussed in this material, there may be
regulatory, compliance, or other reasons that prevent us from doing so.
This document is being supplied to you solely for your information, and its contents, information or data may not be reproduced,
redistributed or passed on, directly or indirectly.
Neither Angel Broking Pvt. Limited, nor its directors, employees or affiliates shall be liable for any loss or damage that may arise from
or in connection with the use of this information.
Note: Please refer to the important ‘Stock Holding Disclosure' report on the Angel website (Research Section). Also, please refer to the
latest update on respective stocks for the disclosure status in respect of those stocks. Angel Broking Pvt. Limited and its affiliates may
have investment positions in the stocks recommended in this report.
Disclosure of Interest Statement
Voltas
1. Analyst ownership of the stock
No
2. Angel and its Group companies ownership of the stock
No
3. Angel and its Group companies' Directors ownership of the stock
No
4. Broking relationship with company covered
No
Note: We have not considered any Exposure below ` 1 lakh for Angel, its Group companies and Directors
Ratings (Based on expected returns
Buy (> 15%)
Accumulate (5% to 15%)
Neutral (-5 to 5%)
over 12 months investment period):
Reduce (-5% to -15%)
Sell (< -15)
December 21, 2015
18