4QFY2016 Result Update | Construction & Eng.
May 24, 2016
Voltas
BUY
CMP
`327
Performance Highlights
Target Price
`407
Quarterly highlights - Consolidated
Investment Period
12 Months
Y/E March (` cr)
4QFY16 4QFY15 3QFY16
% chg (yoy)
% chg (qoq)
Net sales
1,876
1,484
1,301
26.4
44.2
Stock Info
EBITDA
172
137
52
25.6
233.0
Sector
Construction & Eng.
PAT
176
118
54
49.5
225.6
Market Cap (` cr)
10,807
Source: Company, Angel Research;
Net debt (` cr)
63
Voltas reported a strong set of numbers for 4QFY2016. The top-line at `1,876cr
Beta
1.4
is up 26.4% yoy and is higher than our expectation, mainly driven by strong
52 Week High / Low
360/211
execution across the EMP segment. The EMP segment impressed us with a 36.5%
Avg. Daily Volume
2,160,720
yoy increase in revenue to `819cr (accounting for 44% of the company’s overall
Face Value (`)
1
4QFY2016 revenues), whereas the UCP segment’s revenue at `859cr is almost
BSE Sensex
25,305
in-line with our estimate. The EBITDA margin for the quarter was flat yoy at 9.2%.
Nifty
7,749
Notably, with most of the legacy projects nearing completion, the EMP segment
Reuters Code
VOLT.BO
reported a strong EBIT margin of 3.4%, as against a loss in 3QFY2016 and 0.7%
Bloomberg Code
VOLT@IB
margin in the corresponding quarter of the previous year. Better than expected
execution coupled with higher other income helped the company report a PAT of
`176cr, which is up 49.5% on a yoy basis. On adjusting for exceptional items, the PAT
Shareholding Pattern (%)
stood at `149cr, reporting a sharp increase of 27.1% yoy. The Adj. PAT margin for the
Promoters
30.3
quarter stood at 7.9%, which is the same as in the corresponding quarter a year ago.
MF / Banks / Indian Fls
29.0
Another positive is the company announcing order inflow of `959cr for the
FII / NRIs / OCBs
19.5
quarter. The order book for the EMP segment as of 4QFY2016-end stands at
Indian Public / Others
21.2
`3,914cr (order book [OB] to LTM ratio of 1.4x). Recent report by GFK Nielsen
states that Voltas has retained its top slot in the domestic AC sales market in
FY2016, with ~21% market share.
Abs. (%)
3m 1yr 3yr
Sensex
11.1
(7.7)
27.4
Valuation: We expect Voltas to report a strong 13.3% top-line and
18.1%
Voltas
36.0
(6.1)
260.7
bottom-line CAGR during FY2016-18E, respectively. On considering the case for
improvement in all of its business segments’ performances, we expect improved
profitability and better investment return ratios for the company, going forward.
3-Year Daily Price Chart
We now assign Voltas 25.0x PE multiple to our FY2018E EPS estimate of
400
`16.3/share and arrive at price target of `407. This reflects 25% upside potential
350
from the stock’s current market price. Accordingly, we continue to maintain our
300
BUY rating on the stock.
250
200
Key Financials (Consolidated)
150
Y/E March (` cr)
FY13
FY14
FY15
FY16
FY17E
FY18E
100
Net Sales
5,531
5,266
5,183
5,857
6,511
7,514
50
0
% chg
6.7
(4.8)
(1.6)
13.0
11.2
15.4
Net Profit
208
245
384
386
427
538
% chg
28.2
18.1
56.6
0.3
10.8
26.0
EBITDA (%)
4.4
5.0
7.9
7.5
7.9
8.7
Source: Company, Angel Research
EPS (`)
6.3
7.4
11.6
11.7
12.9
16.3
P/E (x)
52.3
44.3
28.3
28.2
25.4
20.2
P/BV (x)
6.7
6.0
5.2
4.5
4.0
3.5
Adj. RoE (%)
12.8
14.2
19.6
17.1
16.7
18.5
RoCE (%)
19.3
22.4
36.4
42.2
46.4
52.7
Yellapu Santosh
EV/Sales (x)
1.9
2.1
2.1
1.9
1.7
1.4
022 - 3935 7800 Ext: 6811
EV/EBITDA (x)
44.2
40.8
26.2
25.0
21.0
16.5
Source: Company, Angel Research; Note: CMP as of May 24, 2016
Please refer to important disclosures at the end of this report
1
Voltas | 4QFY2016 Result Update
Exhibit 1: Quarterly Performance (Consolidated)
Particulars (` cr)
4QFY16 3QFY16
% chg (qoq) 4QFY15
% chg (yoy)
FY2016
FY2015
% chg
Net Sales
1,876
1,301
44.2
1,484
26.4
5,832
5,144
13.4
Total Expenditure
1,704
1,249
36.3
1,347
26.5
5,421
4,773
13.6
Cost of materials consumed
1,060
796
33.1
801
32.4
3,453
2,905
18.9
Purchase of stock-in-trade
292
131
122.4
231
26.1
673
692
(2.8)
Employee benefits Expense
183
170
7.5
152
20.5
670
590
13.5
Other Expenses
169
152
11.4
163
3.5
625
586
6.7
EBITDA
172
52
233.0
137
25.6
411
371
10.8
EBIDTA %
9.2
4.0
9.2
7.1
7.2
Depreciation
8
7
17.1
8
(1.1)
28
28
(0.8)
EBIT
164
45
265.9
129
27.3
384
343
11.7
Interest and Financial Charges
6
3
78.1
6
1.9
15
23
(34.1)
Other Income
61
25
143.8
36
68.3
143
148
(2.9)
PBT before Exceptional Items
219
67
229.5
159
37.5
511
467
9.4
Exceptional Items
28
2
1
41
46
PBT
247
69
259.7
161
53.8
552
514
7.5
Tax
66
13
427.0
41
160
128
% of PBT
26.9
18.3
25.7
29.0
24.8
PAT bef. Min. Int.
181
56
222.2
119
51.4
392
386
1.6
Share of profit/ (loss) of associate
1
1
(13.6)
(0)
nmf
2
2
39.9
Minority interest in (profit)/ loss
(5)
(2)
(1.2)
(9)
(3)
PAT after Min. Int.
176
54
225.6
118
49.5
386
384
0.3
Adj. PAT
149
52
185.5
117
27.1
345
338
2.0
Adj. PAT %
7.9
4.0
7.9
6.7
7.5
Dil. EPS
5.33
1.64
225.0
3.57
49.3
11.65
11.62
0.3
Source: Company, Angel Research; Note: nmf- Not meaningful
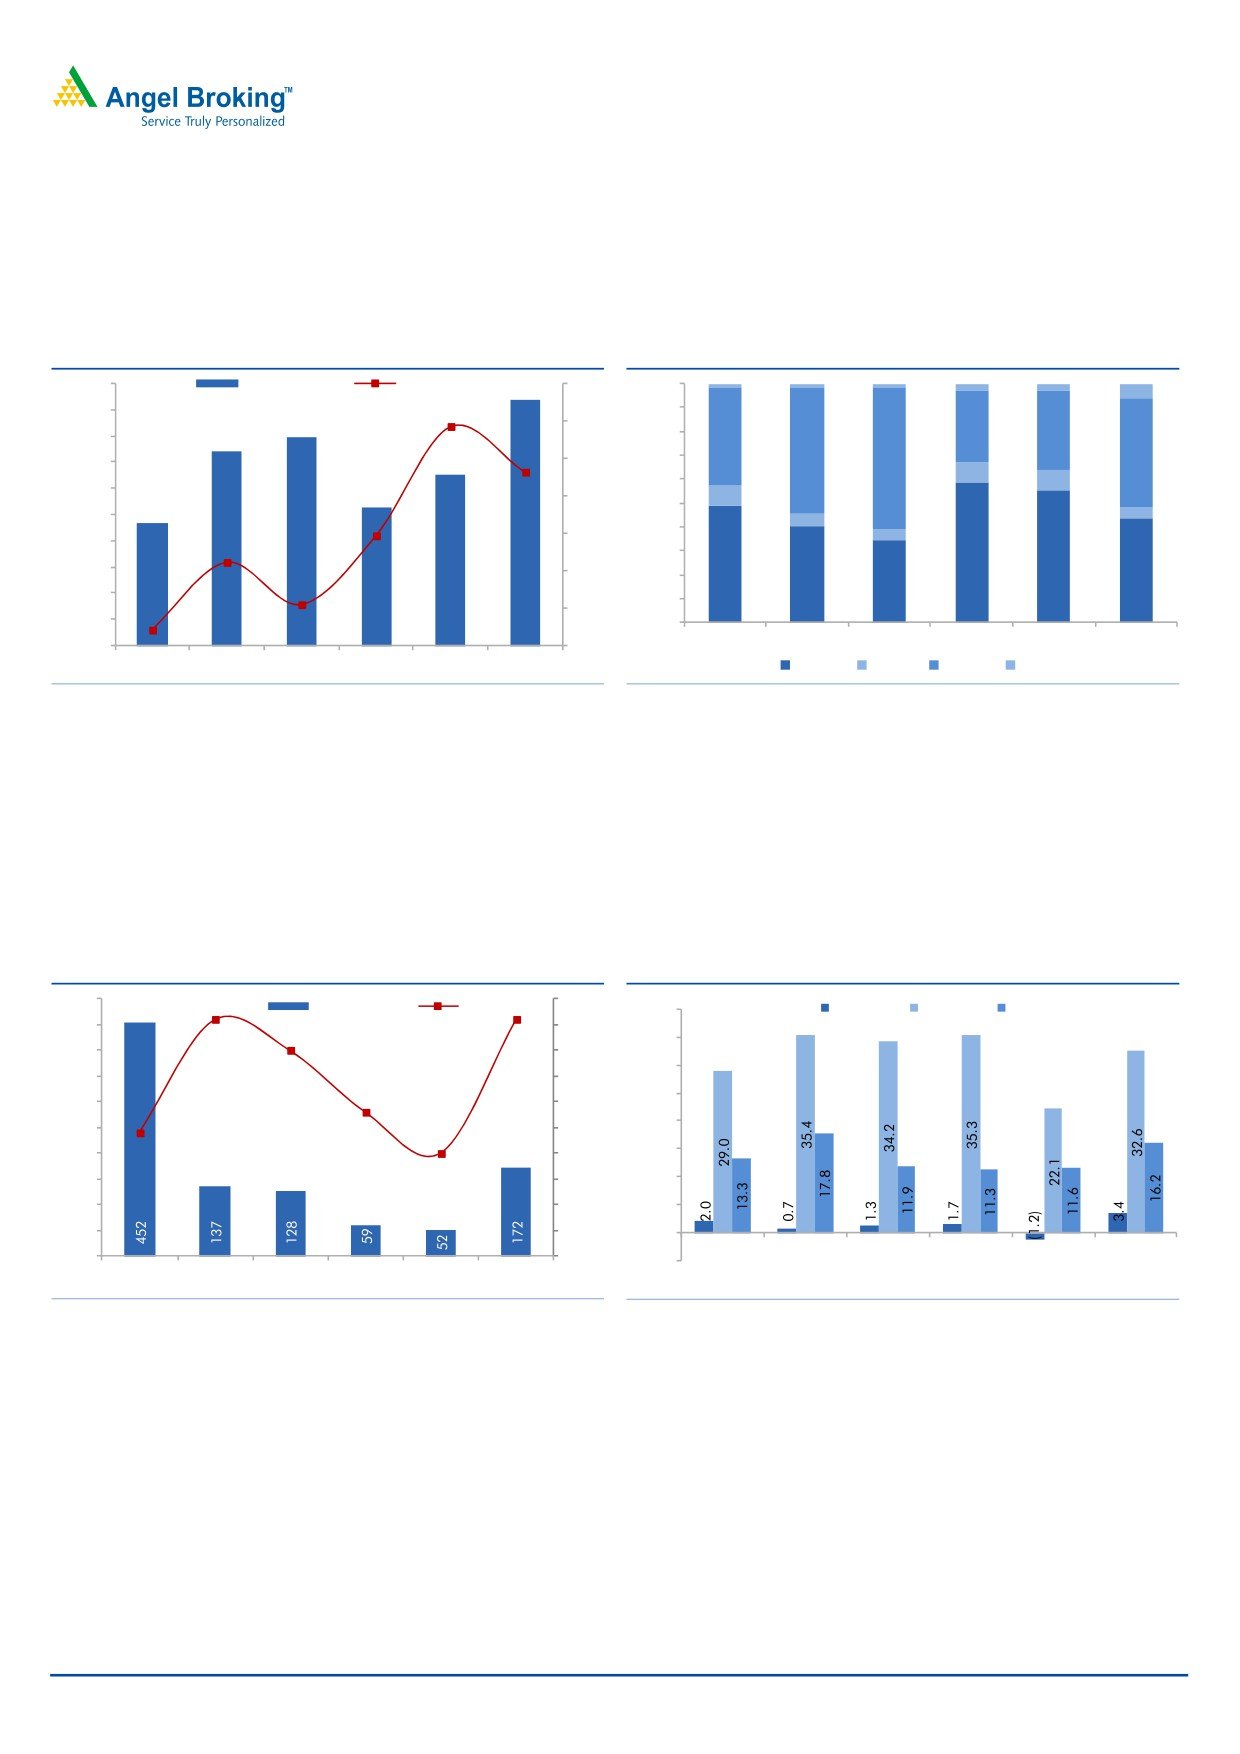
Strong EMP segment execution leads to strong 4Q sales
Voltas reported better than expected top-line numbers for the quarter, mainly
driven by strong execution across the EMP segment. The top-line grew 26.4% yoy
to `1,876cr as the EMP segment impressed with a 36.5% yoy increase in revenue
to `819cr (accounting for 44% of 4QFY2016 revenues), whereas the revenue of
the UCP segment came in in-line with our estimate at `859cr. The performance of
the EMP segment was supported by strong execution across both, domestic
(~`203.6cr) as well as the international business (~`615.0cr). Also, revenue
booking during the quarter benefitted from `106cr of irrigation projects executed
across the Omanese subsidiary (reported under Others segment; Others segment
had reported `22.9cr in revenues in 4QFY2015).
For FY2016, Voltas reported a 13.4% yoy increase in sales to `5,832cr, on the
back of 23% yoy increase in the EMP segment’s sales and 1.8% growth across the
UCP segment. EMP segment revenues in FY2016 also benefitted on account of
`108.1cr of contribution coming in from 4 overseas subsidiary (Lalbuksh Voltas
Engineering Services & Trading LLC, Weathermaker Ltd., Saudi Ensas, Voltas
Oman LLC) and 1 JV (Universal Weathermaker Factory Ltd) as they changed their
accounting period to coincide with the company’s reporting period. The UCP
segment on the other hand, benefitted from strong traction seen across sale of Air
Coolers launched a few months back. The company sold ~70,000 units in
May 24, 2016
2
Voltas | 4QFY2016 Result Update
FY2016, translating to sales of ~`35cr. On adjusting for Air Cooler sales, the UCP
segment reported almost flattish sales in FY2016. On the positive side, Voltas has
been able to retain its numero-uno position commanding a ~21% share in the
domestic air conditioning market in FY2016.
Exhibit 2: Strong revenue growth in 4QFY2016
Exhibit 3: Revenue mix
2,000
Revenue (` in cr)
yoy growth (%)
50
100%
1,876
1
2
1
3
3
6
1,800
90%
1,595
40
38.6
80%
30
33
1,600
1,484
41
53
46
1,301
30
70%
60
1,400
9
26.4
60%
9
1,200
1,060
20
9
939
50%
1,000
5
6
40%
9.4
10
4
800
30%
59
2.3
49
56
600
0
44
20%
40
35
400
10%
(9.0)
(10)
200
0%
(15.8)
0
(20)
3QFY2015
4QFY2015
1QFY2016
2QFY2016
3QFY2016
4QFY2016
3QFY2015 4QFY2015 1QFY2016 2QFY2016 3QFY2016 4QFY2016
EMP
EPS
UCP
Others
Source: Company, Angel Research
Source: Company, Angel Research
EBITDA margin remains flattish at 9.2%
Voltas reported almost flat yoy EBITDA margin at 9.2% for 4QFY2016 which is
slightly lower than our expectation. One positive emerging on the operational front
is that with most of the legacy projects nearing completion the EMP segment for the
first time in the recent few quarters reported a strong segment level EBIT margin of
3.4%, against a loss in 3QFY2016 and 0.7% margin in 4QFY2015.
Exhibit 4: EBITDA margin remains flat yoy at 9.2%
Exhibit 5: EMP segment margins expand
500
10.0
EBITDA (` in cr)
EBITDA (%)
40.0
EMP (` cr)
EPS (` cr)
UCP (` cr)
450
9.2
9.2
9.0
35.0
400
8.0
8.0
30.0
350
7.0
25.0
300
6.0
5.6
20.0
250
5.0
4.8
200
4.0
4.0
15.0
150
3.0
10.0
100
2.0
5.0
50
1.0
0.0
0
0.0
3QFY2015
4QFY2015
1QFY2016
2QFY2016
3QFY2016
4QFY2016
(5.0)
3QFY2015 4QFY2015 1QFY2016 2QFY2016 3QFY2016 4QFY2016
Source: Company, Angel Research
Source: Company, Angel Research
Higher sales promotion activities led Voltas to report a decline in the UCP
segment’s EBIT margin to 16.2% in 4QFY2016 (from 17.8% in 4QFY2015).
For the full year FY2016, the EBITDA margin marginally declined to 7.1% from
7.2% in FY2015. Segment-wise, the EMP segment’s EBIT margin improved from
1.0% in FY2015 to 1.4% in FY2016, whereas, the UCP segment’s margin declined
from 13.9% in FY2015 to 13.2% in FY2016. If we adjust for shift in subsidiaries
and JVs’ accounting period then the EMP segment’s EBIT margin for FY2016 stood
at 1.2%.
May 24, 2016
3
Voltas | 4QFY2016 Result Update
Adj.PAT margin remains flat at 7.9%
Better than expected execution, coupled with higher other income helped the
company report a PAT of `176cr, which is up 49.5% yoy. Other income increased
68.3% yoy to `61cr (reflecting impact of 20% yoy increase in current investments
and cash balance, combined at `864cr).
Exhibit 6: Adj. PAT margin remains flat at 7.9%
Exhibit 7:
160
9.0
4QFY16 3QFY16 4QFY15 FY16 FY15
Adj. PAT (` in cr)
Adj. PAT (%)
140
7.9
7.9
8.0
Reported PAT
176
54
118
386
384
7.0
120
6.7
Adjustments:
6.3
6.0
100
Sidra Project Charges
0
0
0
0
(190)
5.0
80
4.2
4.0
4.0
Profit from sale of properties
31
2
1
33
236
60
3.0
Profit on sale of investments
1
0
0
12
0
40
2.0
Rev. of prov. for contingencies
4
0
0
4
0
20
1.0
Impair. of goodwill on consol.
(8)
0
0
(8)
0
0
0.0
3QFY2015 4QFY2015 1QFY2016 2QFY2016 3QFY2016 4QFY2016
Adj. PAT
149
52
117
345
338
Source: Company, Angel Research
Source: Company, Angel Research
On adjusting for exceptional items, the PAT stood at `149cr, still reporting a
sizable 27.1% yoy increase. The Adj. PAT margin for 4QFY2016 stood at 7.9%,
same as in the year ago quarter.
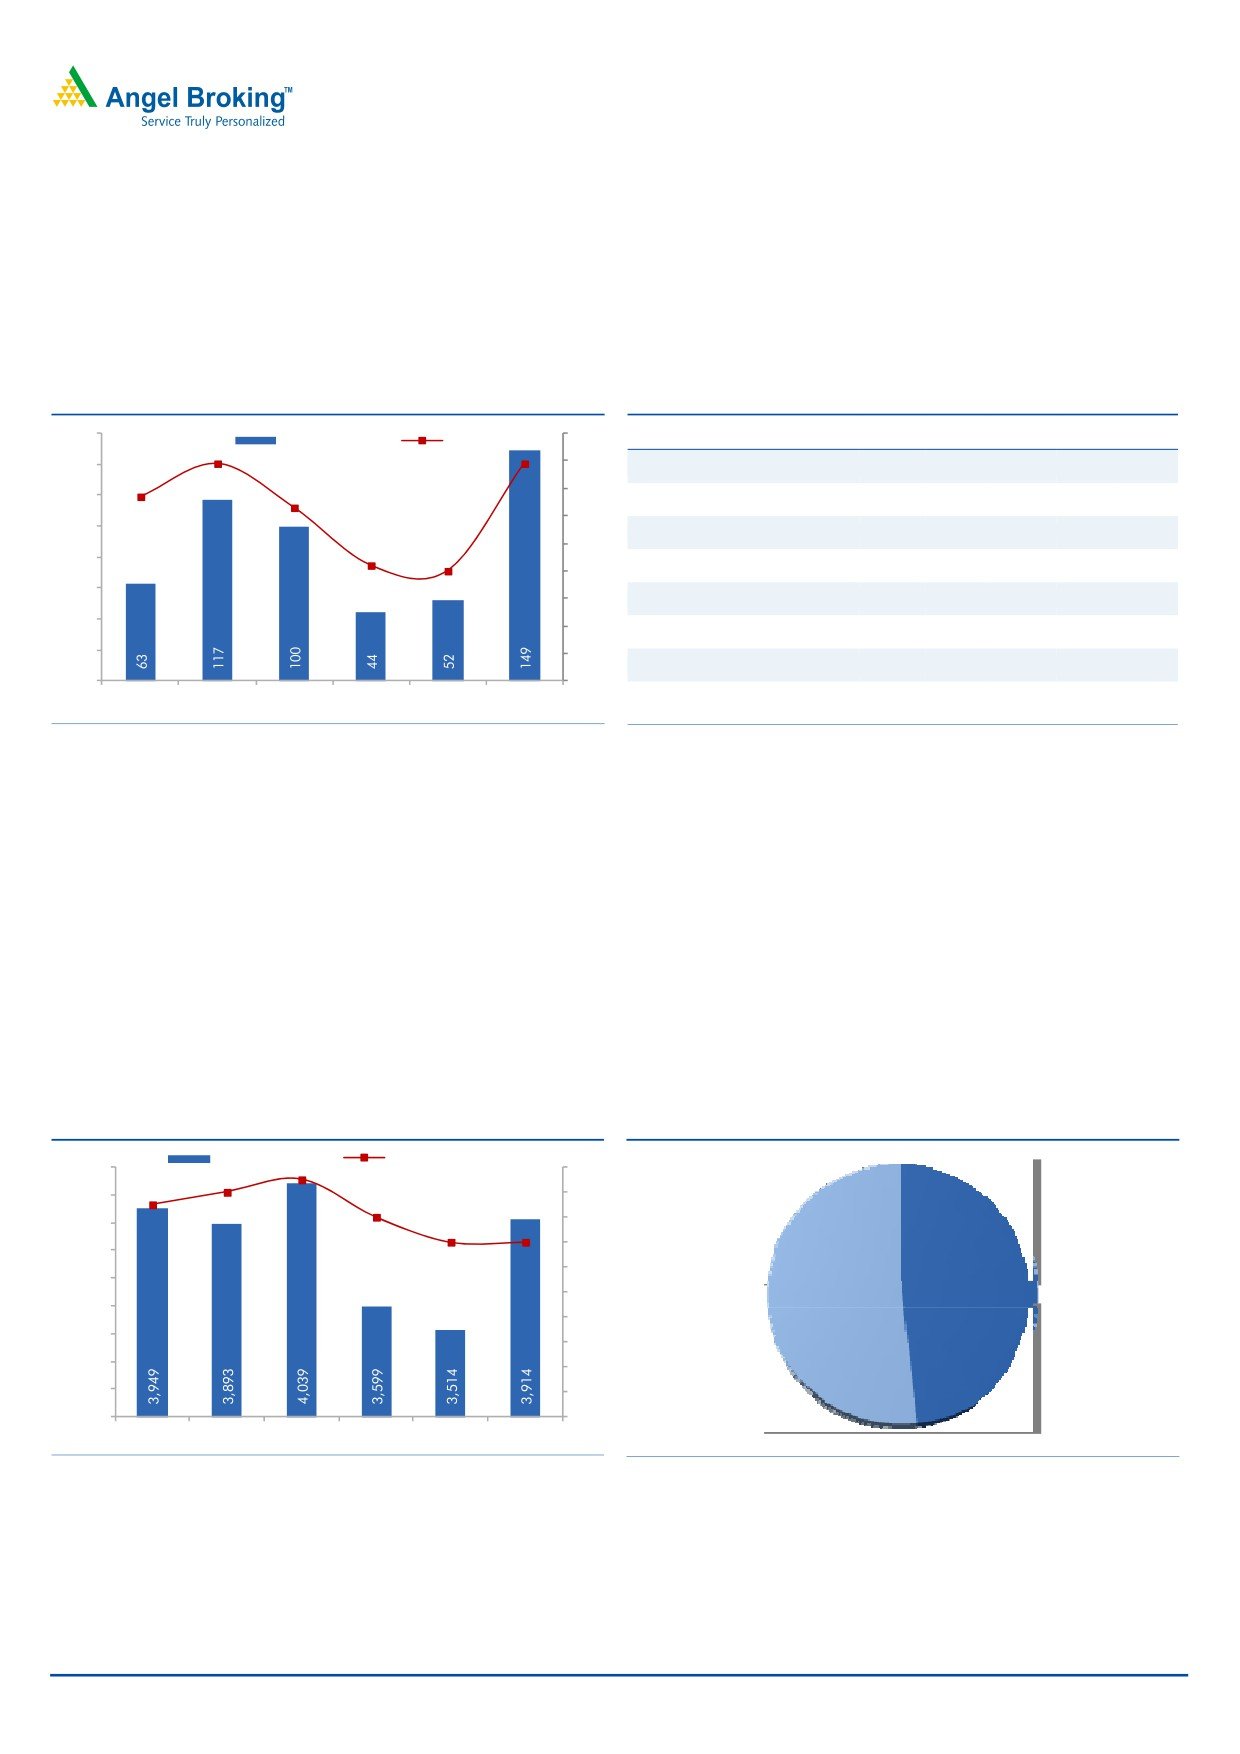
Order Book grows 11.4% qoq to `3,914cr
Voltas reported a 11.4% qoq increase in its Order book to `3,914cr (OB to LTM
ratio of 1.4x), reflecting `959cr of Order wins during 4QFY2016. Among the
projects won during the quarter, the two key ones are (1) `381cr order for MEP
works of commercial office building in Dubai, and (2) `100cr order for MEP works
of a Hotel in Oman.
Exhibit 8: OB/LTM sales ratio stands at 1.4x
Exhibit 9: 4QFY2016 Order Book Mix (%)
Order Book (` in cr)
OB/LTM ratio (x)
4,100
2.0
1.8
1.7
1.8
4,000
1.9
1.6
3,900
1.6
1.4
3,800
1.4
1.4
1.2
3,700
International,
1.0
Domestic,
48.3%
3,600
51.7%
0.8
3,500
0.6
3,400
0.4
3,300
0.2
3,200
0.0
3QFY2015 4QFY2015 1QFY2016 2QFY2016 3QFY2016 4QFY2016
Source: Company, Angel Research
Source: Company, Angel Research
May 24, 2016
4
Voltas | 4QFY2016 Result Update
Valuation
At the current market price of `327, the stock is trading at FY2017E and FY2018E
P/E of 25.3x and 20.1x, respectively. With inflation under control, rate cut cycle
expected to continue, coupled with Voltas’ strong positioning in the air
conditioning market, we believe that the company should continue to report strong
growth in air conditioner sales, going forward.
In FY2015, the UCP segment contributed ~72% of the consol. EBIT. Also,
completion of the low margin EMP projects and increased contribution of high
margin projects indicate that the EBIT margins of the EMP segment would improve
from 1.4% in FY2016 to 5.0% in FY2018E. On the whole, we expect Voltas to
report a top-line and bottom-line CAGR of 13.3% and 18.1% during FY2016-18E,
respectively. Our growth assumption captures (a) pick-up in international award
activity, which should lead to top-line growth as well as EMP segment EBIT margin
expansion, and (b) continued growth in domestic AC sales, with Voltas being able
to retain its ‘numero uno’ status. Noticeably in the last few years, the EBIT mix of
Voltas has shifted from being heavily dependent on the EMP segment to a now
dominant share of the UCP segment. The contribution of the UCP segment in the
consol. EBIT has increased from 32% in FY2011 to 72% in FY2015. We expect the
same to be over 61% levels during FY2016-18E. Considering the shift in the
consol. EBIT mix, positive cues, and case for improvement in the business
segments’ performances, we expect scope for improved profitability and better
investment return ratios, going forward. We now assign Voltas 25.0x PE multiple to
our FY2018E EPS estimate of `16.3/share and arrive at a price target of `407.
This reflects 25% upside potential from the current levels. Accordingly, we continue
to maintain our Buy rating on the stock.
May 24, 2016
5
Voltas | 4QFY2016 Result Update
Investment Arguments
Growth in UCP segment to continue: Voltas has maintained 20%+ market share in
the domestic air-conditioning market despite stiff competition from MNC players.
Its ‘numero uno’ position is owing to its (1) wide distribution network (10,000-
11,000 touch-points), (2) wide portfolio of 65+ models, (3) strong post-sale
support (including 5-year warranty on compressor), and (4) strong advertising
focus with the company being among the top 5 media spenders in the AC
segment. With economic indicators turning favorable, the company’s competitive
positioning should help the UCP segment report a 19.5% top-line and 16.6% EBIT
CAGR, respectively, during FY2016-18E.
Gradual recovery in the EMP business: Voltas’ EMP business was adversely affected
due to weak awarding environment, slow execution and cost over-runs. In the run-
up to the Qatar World Cup 2022 and Dubai Expo 2020, we expect international
awarding activity to gradually catch-up from FY2017E onwards. Surge in order
book should translate to uptick in execution (we expect 10.7% top-line CAGR
during FY2016-18E). With legacy projects almost completed and contribution of
high margin projects kicking-in, we expect the segment’s margins to expand from
1.4% in FY2016 to 5.0% in FY2018E.
Balance Sheet strength: Voltas pursues an asset light business model and in the
due course of business it resorts to outsourcing and strategic tie-ups, thereby
enabling it to control its operating costs and generate high profitability. As a result,
we expect Voltas to revert to it its earlier trend of higher RoEs. Given the asset light
business model, the company has been generating strong cash flows (it generated
`1,029cr of cash flows from business during FY2013-16). As of 4QFY2016-end,
Voltas is a debt free company (on net basis), with cash & liquid investment balance
of `863cr.
Risks & Concerns
AC sales contributed ~35% of FY2016 consolidated revenues. Given that
Voltas is present only in the AC business across the entire Consumer Durables
space, loss of major market share could act as a risk to our estimates. Any
such development could lead to lower than expected EBIT contribution to the
consol. profits and our estimates.
Revenues from the EPS segment are based on agreement for supplying Textile,
Mining & Construction equipment. Any termination of such agreements shall
impact our forecasted revenues for the segment.
Most of the long term international projects are fixed price contracts and in the
due course of its business, Voltas also imports. Any adverse currency
fluctuations may impact the raw material pricing as well as margins.
Cancellation of Qatar World Cup 2022 or Expo 2020 could affect our EMP
segment assumptions.
May 24, 2016
6
Voltas | 4QFY2016 Result Update
Profit & Loss Statement (Consolidated)
Y/E March (` cr)
FY13
FY14
FY15
FY16
FY17E
FY18E
Net Sales
5,531
5,266
5,183
5,857
6,511
7,514
% Chg
6.7
(4.8)
(1.6)
13.0
11.2
15.4
Total Expenditure
5,287
5,000
4,773
5,421
5,995
6,859
Cost of RM Consumed
4,167
3,854
3,597
4,126
4,568
5,242
Employee benefits Expense
633
595
590
670
746
845
Other Expenses
487
551
586
625
681
771
EBITDA
244
266
410
437
516
655
% Chg
(27.5)
8.9
54.4
6.6
18.1
26.9
EBIDTA %
4.4
5.0
7.9
7.5
7.9
8.7
Depreciation
28
25
28
28
31
33
EBIT
216
241
382
409
485
622
% Chg
(28.6)
11.4
58.7
7.1
18.5
28.3
Interest and Fin. Charges
38
23
23
15
15
9
Other Income
90
100
109
118
131
142
PBT
268
318
467
511
600
755
Exceptional Items
12
22
46
41
0
0
Prior Period Adjustments
0
0
0
0
0
0
Tax
73
94
128
160
174
219
% of PBT
27.2
29.6
27.3
31.3
29.0
29.0
PAT from ordinary activities
207
246
386
392
426
536
Share of Profit / (loss of
Associate) & Minority Interest
1
(0)
(2)
(7)
1
3
in (profit)/ loss
PAT
208
245
384
386
427
538
% Chg
28.2
18.1
56.6
0.3
10.8
26.0
PAT %
3.8
4.7
7.4
6.6
6.6
7.2
Diluted EPS
6.3
7.4
11.6
11.7
12.9
16.3
% Chg
28.2
18.1
56.6
0.3
10.8
26.0
May 24, 2016
7
Voltas | 4QFY2016 Result Update
Balance Sheet (Consolidated)
Y/E March (` cr)
FY13
FY14
FY15
FY16
FY17E FY18E
Sources of Funds
Equity Capital
33
33
33
33
33
33
Reserves & Surplus Total
1,593
1,786
2,069
2,362
2,675
3,064
Networth
1,626
1,819
2,102
2,395
2,708
3,097
Total Debt
261
263
122
260
155
100
Minority Interest
12
14
16
26
26
26
Long-term Liabilities & Provision
120
122
130
156
166
180
Total Liabilities
2,019
2,218
2,370
2,837
3,055
3,402
Application of Funds
Gross Block
406
459
455
508
534
560
Accumulated Depreciation
195
251
266
294
325
358
Net Block
211
209
189
215
209
202
Capital WIP
0
2
4
8
6
7
Goodwill
89
80
80
72
72
72
Investments
407
732
1,094
1,526
1,609
1,844
Deferred Tax Assets
24
26
37
53
53
53
Inventories
978
901
867
893
1,013
1,190
Sundry Debtors
1,362
1,335
1,339
1,307
1,538
1,765
Cash and Bank Balance
350
282
252
197
186
131
Loans & Advances & Oth.
1,041
1,027
922
1,167
1,174
1,338
Current Assets
Current Liabilities
2,548
2,527
2,519
2,762
2,969
3,375
Net Current Assets
1,183
1,018
861
802
942
1,048
Other Assets
104
152
105
162
165
176
Total Assets
2,019
2,218
2,370
2,837
3,055
3,402
May 24, 2016
8
Voltas | 4QFY2016 Result Update
Cash Flow Statement (Consolidated)
Y/E March (` cr)
FY13
FY14
FY15
FY16
FY17E FY18E
Profit before tax
243
257
434
511
600
755
Depreciation
22
19
22
28
31
33
Other Adjustments
(147)
(40)
(248)
47
(75)
(83)
Change in Working Capital
21
164
83
(26)
(144)
(159)
Interest & Fin. Charges (net)
17
8
10
11
10
5
Direct taxes paid
(92)
(74)
(80)
(160)
(174)
(219)
Cash Flow from Operations
64
334
221
411
249
332
(Inc)/ Dec in Fixed Assets
8
(20)
210
(57)
(23)
(27)
(Inc)/ Dec in Invest. & Int. recd.
36
(273)
(269)
(432)
(3)
(145)
Cash Flow from Investing
44
(292)
(59)
(489)
(26)
(173)
Inc./ (Dec.) in Borrowings
34
(19)
(140)
138
(105)
(55)
Issue/ (Buy Back) of Equity
0
0
0
0
0
0
Dividend Paid (Incl. Tax)
(61)
(57)
(64)
(92)
(114)
(150)
Finance Cost
(26)
(17)
(16)
(15)
(15)
(9)
Cash Flow from Financing
(53)
(93)
(221)
30
(234)
(214)
Inc./(Dec.) in Cash
54
(51)
(59)
(47)
(11)
(55)
Opening Cash balances
200
255
203
144
97
86
Closing Cash balances
255
203
144
97
86
31
May 24, 2016
9
Voltas | 4QFY2016 Result Update
Key Ratios
Y/E March
FY13
FY14
FY15
FY16
FY17E FY18E
Valuation Ratio (x)
P/E (on FDEPS)
52.0
44.0
28.1
28.0
25.3
20.1
P/CEPS
45.9
40.0
26.2
26.1
23.6
18.9
Dividend yield (%)
0.6%
0.6%
0.7%
0.7%
0.9%
1.2%
EV/Sales
1.9
2.0
2.1
1.9
1.7
1.4
EV/EBITDA
43.9
40.6
26.0
24.9
20.9
16.5
EV / Total Assets
5.3
4.9
4.5
3.8
3.5
3.2
Per Share Data (`)
EPS (Diluted)
6.3
7.4
11.6
11.7
12.9
16.3
Cash EPS
7.1
8.2
12.5
12.5
13.9
17.3
DPS
1.9
1.9
2.3
2.4
3.0
3.9
Book Value
49.1
55.0
63.5
72.4
81.9
93.6
Returns (%)
RoCE (Pre-tax)
19.3
22.4
36.4
42.2
46.4
52.7
Angel RoIC (Pre-tax)
16.2
16.4
22.1
19.8
21.5
23.9
RoE
12.8
14.2
19.6
17.1
16.7
18.5
Turnover ratios (x)
Asset Turnover (Gross Block) (x)
13.6
12.2
11.3
12.2
12.5
13.7
Inventory / Sales (days)
65
65
62
55
53
54
Receivables (days)
90
93
94
82
80
80
Payables (days)
113
116
112
102
100
95
NWC days
41
43
45
35
33
38
Leverage Ratios (x)
Net D/E ratio (x)
(0.1)
(0.0)
(0.1)
0.0
(0.0)
(0.0)
Interest Coverage Ratio (x)
8.0
15.1
21.1
34.4
41.0
81.1
May 24, 2016
10
Voltas | 4QFY2016 Result Update
Research Team Tel: 022 - 39357800
DISCLAIMER
Angel Broking Private Limited (hereinafter referred to as “Angel”) is a registered Member of National Stock Exchange of India Limited,
Bombay Stock Exchange Limited and Metropolitan Stock Exchange of India Limited. It is also registered as a Depository Participant with
CDSL and Portfolio Manager with SEBI. It also has registration with AMFI as a Mutual Fund Distributor. Angel Broking Private Limited is
a registered entity with SEBI for Research Analyst in terms of SEBI (Research Analyst) Regulations, 2014 vide registration number
INH000000164. Angel or its associates has not been debarred/ suspended by SEBI or any other regulatory authority for accessing
/dealing in securities Market. Angel or its associates including its relatives/analyst do not hold any financial interest/beneficial
ownership of more than 1% in the company covered by Analyst. Angel or its associates/analyst has not received any compensation /
managed or co-managed public offering of securities of the company covered by Analyst during the past twelve months. Angel/analyst
has not served as an officer, director or employee of company covered by Analyst and has not been engaged in market making activity
of the company covered by Analyst.
This document is solely for the personal information of the recipient, and must not be singularly used as the basis of any investment
decision. Nothing in this document should be construed as investment or financial advice. Each recipient of this document should
make such investigations as they deem necessary to arrive at an independent evaluation of an investment in the securities of the
companies referred to in this document (including the merits and risks involved), and should consult their own advisors to determine
the merits and risks of such an investment.
Reports based on technical and derivative analysis center on studying charts of a stock's price movement, outstanding positions and
trading volume, as opposed to focusing on a company's fundamentals and, as such, may not match with a report on a company's
fundamentals.
The information in this document has been printed on the basis of publicly available information, internal data and other reliable
sources believed to be true, but we do not represent that it is accurate or complete and it should not be relied on as such, as this
document is for general guidance only. Angel Broking Pvt. Limited or any of its affiliates/ group companies shall not be in any way
responsible for any loss or damage that may arise to any person from any inadvertent error in the information contained in this report.
Angel Broking Pvt. Limited has not independently verified all the information contained within this document. Accordingly, we cannot
testify, nor make any representation or warranty, express or implied, to the accuracy, contents or data contained within this document.
While Angel Broking Pvt. Limited endeavors to update on a reasonable basis the information discussed in this material, there may be
regulatory, compliance, or other reasons that prevent us from doing so.
This document is being supplied to you solely for your information, and its contents, information or data may not be reproduced,
redistributed or passed on, directly or indirectly.
Neither Angel Broking Pvt. Limited, nor its directors, employees or affiliates shall be liable for any loss or damage that may arise from
or in connection with the use of this information.
Note: Please refer to the important ‘Stock Holding Disclosure' report on the Angel website (Research Section). Also, please refer to the
latest update on respective stocks for the disclosure status in respect of those stocks. Angel Broking Pvt. Limited and its affiliates may
have investment positions in the stocks recommended in this report.
Disclosure of Interest Statement
Voltas
1. Analyst ownership of the stock
No
2. Angel and its Group companies ownership of the stock
No
3. Angel and its Group companies' Directors ownership of the stock
No
4. Broking relationship with company covered
No
Note: We have not considered any Exposure below ` 1 lakh for Angel, its Group companies and Directors
Ratings (Based on expected returns
Buy (> 15%)
Accumulate (5% to 15%)
Neutral (-5 to 5%)
over 12 months investment period):
Reduce (-5% to -15%)
Sell (< -15%)
May 24, 2016
11