IPO Note | Beverages
October 24, 2016
Varun Beverages Limited
NEUTRAL
sue Open: October 26, 2016
Is
Need more sugar
Issue Close: October 28, 2016
Varun Beverages (VBL) is PepsiCo India’s bottling franchisee, operating since last
25 years. It is engaged in the business of producing and distributing wide range
Issue Details
of PepsiCo’s beverages. It has total 21 manufacturing facilities in India and a few
Face Value: `10
other countries. Indian operations account for 82% of its total revenues while rest
Present Eq. Paid up Capital: `586cr (June 2016)
of the revenues comes from other countries.
Fresh Issue: 1.5 cr Shares
Positives: (1) VBL is the one of the largest bottling franchisee of PepsiCo and
Offer for Sale: 1.0 cr Shares
accounts 44% of PepsiCo India’s revenues (2) In 2015, VBL acquired PepsiCo
Post Eq. Paid up Capital: `182.0cr
India’s business in few states which in our opinion has better profitability (3) The
Issue size (amount): `1,110*-1,112cr**
company has been able to de-leverage its balance sheet partially and improve
Price Band: `440-445
profitability in CY2015.
Lot Size: 33 shares and in multiple thereafter
Investment concerns: (1) VBL’s financial performance has remained lackluster in
Post-issue implied mkt. cap: `8,005.9cr - 8,096.8cr
last four years with losses reported in CY2013 and CY2014. Overall profitability
Promoters holding Pre-Issue: 86.3%
has remained inconsistent which does not give a strong sense of VBL being a
Promoters holding Post-Issue: 73.7%
strongly profitable franchisee (2) The numbers reported by the company indicate
Note:*at Lower price band and **Upper price band
that in CY2015, the beverage volumes from existing territories declined by 7%
which indicates de-growth in existing business (3) Our sense is that VBL has
Book Building
limited strategic flexibility to improve its business further as key decisions such as
QIBs
50% of issue
advertising, product launches, etc will be determined by PepsiCo. (4) VBL
operates an asset heavy model which means it requires a huge capex for growth,
Non-Institutional
15% of issue
in absence of which its RoE will be impacted.
Retail
35% of issue
Valuation and outlook: On CY2015’s PAT of `87cr, the issue, at its upper band is
priced at the P/E ratio of 85.4x which looks expensive. The issue still looks
Post Issue Shareholding Pattern
expensive at P/E of 51.4x, calculated on estimated CY2016E PAT of `157cr. We
Promoters Group
73.7
note that a lot of MNC brands have presence in India through franchisees. Few of
DIIs/FIIs/Public & Others
26.3
these franchisees have been able to grow their business by taking strategic
decisions such product launches, advertising etc. which is not the case with VBL .
Considering its inconsistent financial performance, low RoE, asset heavy business
model and high valuation, we rate this IPO as ‘Neutral’.
Key Financials (Consolidated)
Y/E Dec. (` cr)
CY2012
CY2013
CY2014
CY2015
H12015
H12016
Net Sales
1,800
2,115
2,502
3,394
2,232
2,530
% chg
17.5
18.3
35.6
NA
13.3
Net Profit
25
(41)
(22)
84
166
207
% chg
(264.1)
(46.8)
(483.3)
NA
24.6
EBITDA (%)
13
14
15
19
21
24
EPS (`)
1.5
(2.4)
(1.2)
5.2
10.0
12.6
P/E (x)
295.9
NA
NA
85.4
NA
NA
P/BV (x)
43.3
42.4
21.7
11.1
NA
NA
RoE (%)
14.6
(23.5)
(6.4)
12.5
NA
NA
RoCE (%)
4.9
4.8
7.0
10.1
NA
NA
Shrikant Akolkar
EV/Sales (x)
5.5
4.7
3.9
2.9
NA
NA
+91 22 39357800 Ext: 6846
EV/EBITDA (x)
43.3
33.9
25.7
15.6
NA
NA
Source: Company, Angel Research
Please refer to important disclosures at the end of this report
1
Varun Beverages | IPO Note
Company background
Varun Beverages (an RJ Corp group company) is PepsiCo's largest bottling
franchisee of Carbonated Soft Drinks (CSD) and non-carbonated beverages
(NCBs) in the world outside USA. Varun Beverages (VBL) has been associated with
PepsiCo since 1990s and is engaged in producing and distributing PepsiCo
beverages. VBL, produces and distributes wide range of PepsiCo's CSD and NCBs
such as, Pepsi, Diet Pepsi, Seven-Up, Tropicana Slice, Aquafina, etc. PepsiCo has
granted Varun Beverages total 17 states and 2 Union Territories in India and
certain territories of Nepal, Sri Lanka, Morocco, Mozambique and Zambia in
international markets. VBL is also expecting PepsiCo’s franchisee rights in
Zimbabwe and is in process of setting up a Greenfield facility there. Its distribution
network included 57 depots and 1,389 delivery vehicles in India and six depots
and 342 delivery vehicles in International market by end of December 2015.
VBL has total 16 production facilities with an annual production capacity of
3,438.4 million liters in India and, 5 production facilities with annual production
capacity of 991.6 million liters in international licensed territories by March 2016.
Besides, producing and distributing the beverages, VBL also has backward
integration and produces preforms, crowns, corrugated boxes and pads, plastic
crates and shrink-wrap films in certain production facilities.
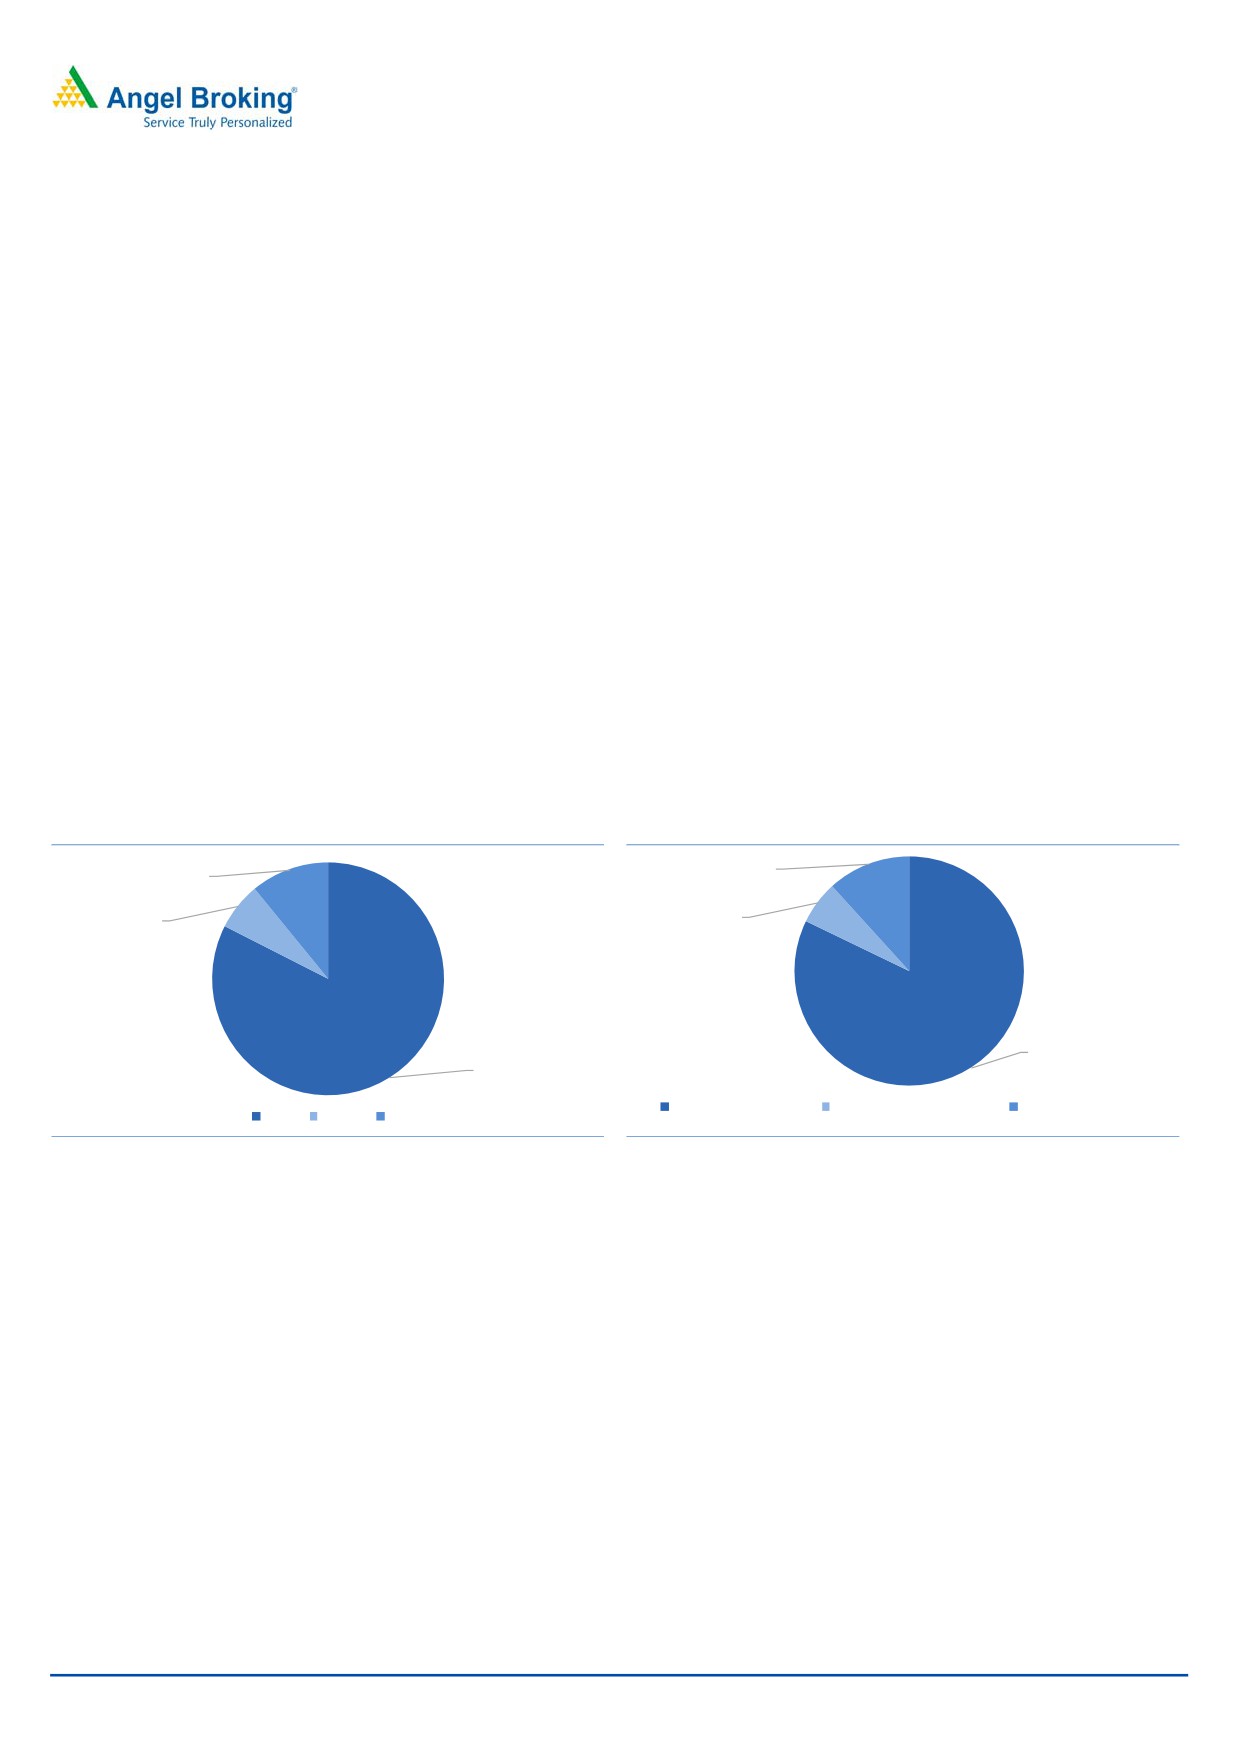
Exhibit 1: Revenue mix
Exhibit 2: Product mix
11.7%
10.9%
6.6%
6.1%
82.2%
82.5%
Carbonated Soft Drinks
Non-Carbonated Beverages
Packaged Drinking Water
India
Nepal
Others
Source: Company, Angel Research
Source: Company, Angel Research
October 24, 2016
2
Varun Beverages | IPO Note
Issue details
This IPO is a mix of OFS and issue of fresh shares. The company is selling fresh
1.5cr shares whereas total 1.0cr shares will be sold through OFS.
Exhibit 3: The issue
Route
No of shares in cr.
Total value
OFS
1
`440cr* - `445cr**
Fresh issue
1.5
`660cr* - `667cr**
Total
2.5
`1,110cr* - `1,112cr**
Source: RHP, Angel Research; Note:*at Lower price band and **Upper price band
Objects of the offer
`540cr will be used for prepayment of debt
Rest of the net proceeds will be used for general corporate purposes
The portion allocated to general corporate purpose looks to be very high (~50% of
the gross proceeds). We believe that this will also be used to repay its certain non
interest bearing debt.
The company, through a business transfer agreement with PepsiCo India in
November 2014 acquired PepsiCo India’s business of manufacturing, marketing,
selling and distributing soft drink beverages and syrup mix in Uttar Pradesh,
Uttarakhand, Himachal Pradesh, Haryana and the Union Territory of Chandigarh
for `1,158cr. With that, VBL also acquired PepsiCo’s four factories located in
Uttarakhand, UP and Haryana. The company has been permitted by PepsiCo to
pay this amount in equal installments and as of June 2016, an amount of
`623.5cr is left in form of deferred payments to PepsiCo India. We believe that the
company will use the IPO proceeds after debt repayment to repay some, if not
most of the deferred payment to PepsiCo India. The company however has not
explicitly mentioned this in the RHP.
Exhibit 4: Shareholding pattern
Pre-Issue
Post-Issue
Particulars
(%)
(%)
Promoter & Promoter Group
86.3%
73.7%
Others
13.7%
26.3%
Total
100.0%
100.0%
Source: Company, Angel Research
Earlier this month, the company converted its hybrid instruments and preference
shares to common equity share. This includes conversion of Compulsory
Convertible Debentures (CCDs) worth
`414cr and Compulsory Convertible
Preference Shares (CCPSs) worth `450cr. This led to an addition of 31.3 million
fresh shares in its equity. With this conversion, there are no preference shares /
convertible debentures left on the company’s balance sheet.
With fresh issuance of 1.5cr shares through this IPO, the company will further see
9% equity dilution.
October 24, 2016
3
Varun Beverages | IPO Note
Investment Rationale
Largest PepsiCo franchisee in the world: Varun Beverages (VBL) is the largest
franchisee of carbonated soft drinks (CSDs) and non-carbonated beverages
(NCBs) of PepsiCo in the world of outside USA. The company produces and
distributes a wide range of CSDs, NCBs and packaged drinking water. VBL has
been in this business since last 25 years and has been able to increase licensed
territories and sub-territories in India to current 17 states and 2 UT.
VBL's contribution in total PepsiCo's volumes has gone up from 26% in CY2011 to
44.1% in CY2015. PepsiCo during this period has seen its soft drink sales volumes
in India increasing from 1,654.9 million liters (ML) in CY2011 to 2,688.1 ML in
CY2015 (13% CAGR). During this period, VBL has reported 28% CAGR in sales
volumes from 437.9 ML in CY2011 to 1,186.04 ML in CY2015. The strong
revenue growth can be attributed to 1) overall increase in PepsiCo's business
(organic growth) 2) increase in the licensed territories granted to VBL by PepsiCo
(inorganic growth). Organically, VBL’s beverage volumes declined by 7% to 759.5
ML in CY2015 however overall sales volumes increased by 45% due to acquisition
of additional territories from PepsiCo. The new territories contributed 36% of the
total sales volumes. We believe that the company will have to keep adding new
revenue territories to remain on a growth trajectory. The decision to grant new
territories remains with PepsiCo.
VBL also operates similar business model in other countries like Sri Lanka, Nepal,
Morocco, Mozambique, Zambia and Zimbabwe however its contribution in
PepsiCo's business there is not provided by the company. These regions at the
moment contribute ~15% of VBL’s total revenues hence they are relatively less
significant at the moment.
Exhibit 5: VBL’s product portfolio licensed from PepsiCo
Product
Territories
Product
Product
Territories
India, Nepal,
Tropicana
India,
Pepsi
Sri Lanka, Morocco,
Slice
Nepal
Zambia, Mozambique
India, Nepal,
Seven-Up
Sri Lanka, Morocco,
Nimbooz
India
Zambia, Mozambique
Mountain
India, Nepal,
Tropicana
India,
Dew
Sri Lanka , Zambia
Frutz
Sri Lanka
India, Nepal, Sri
Mirinda
Lanka, Morocco,
Zambia, Mozambique
India
Aquafina
Sri Lanka
India, Nepal, Sri
Evervess
Lanka, Zambia,
Mozambique
Source: Company, Angel Research
October 24, 2016
4
Varun Beverages | IPO Note
High dependence on Pepsi: VBL has 100% dependence on PepsiCo for it
revenues. PepsiCo at a time is playing as a raw material supplier, licenser and
franchisee partner. As per its agreement with PepsiCo, VBL is required to buy
concentrates from Pepsi as well as pay royalty of 5% on certain non-CSD products.
In exchange brand promotion and advertising is taken care by PepsiCo. There
are three very important aspects of VBL’s partnership agreement with
PepsiCo: 1) product pricing 2) raw material pricing 3) Brand promotion.
Product pricing - The product prices are decided by PepsiCo and not by VBL.
PepsiCo’s pricing depends upon various factors including the prices set by its
competitors. So we believe that VBL has no say in the pricing of the products
hence exerts no command on the products they sell.
Raw material pricing - As per agreement, VBL purchases concentrate from
PepsiCo. Concentrate is the most important ingredient of the carbonated soft
drinks and prices of which are determined by PepsiCo in discussion with VBL.
Even though PepsiCo considers VBL's opinion at the moment, in longer term
this is negative for VBL as a unilateral pricing determined by PepsiCo will
impact VBLs financial performance. The cost of concentrate was between
28-34% from 2014 and H1CY2016 which means it is a significant expense to
VBL.
Brand promotion - PepsiCo takes care of marketing of its brands however
merchandising at the relevant points of sale level is done by VBL. We believe
that this is positive for VBL as brand promotion would cost it a large chunk of
money.
Overall we see the pricing arrangements to be negative to VBL as it has no pricing
power over raw materials and its produces.
Capital intensive business with low asset turnover: VBL is operating a
capital intensive model without showing significant economies of scale. While it is
true that high capital investments act as an entry barrier, it is equally offset by its
nearly non-existent pricing power. For PepsiCo, it is difficult to replace VBL due to
the capital intensive nature of the business and VBL’s experience and strong
distribution abilities would score if PepsiCo decides to look for a new partner.
October 24, 2016
5
Varun Beverages | IPO Note
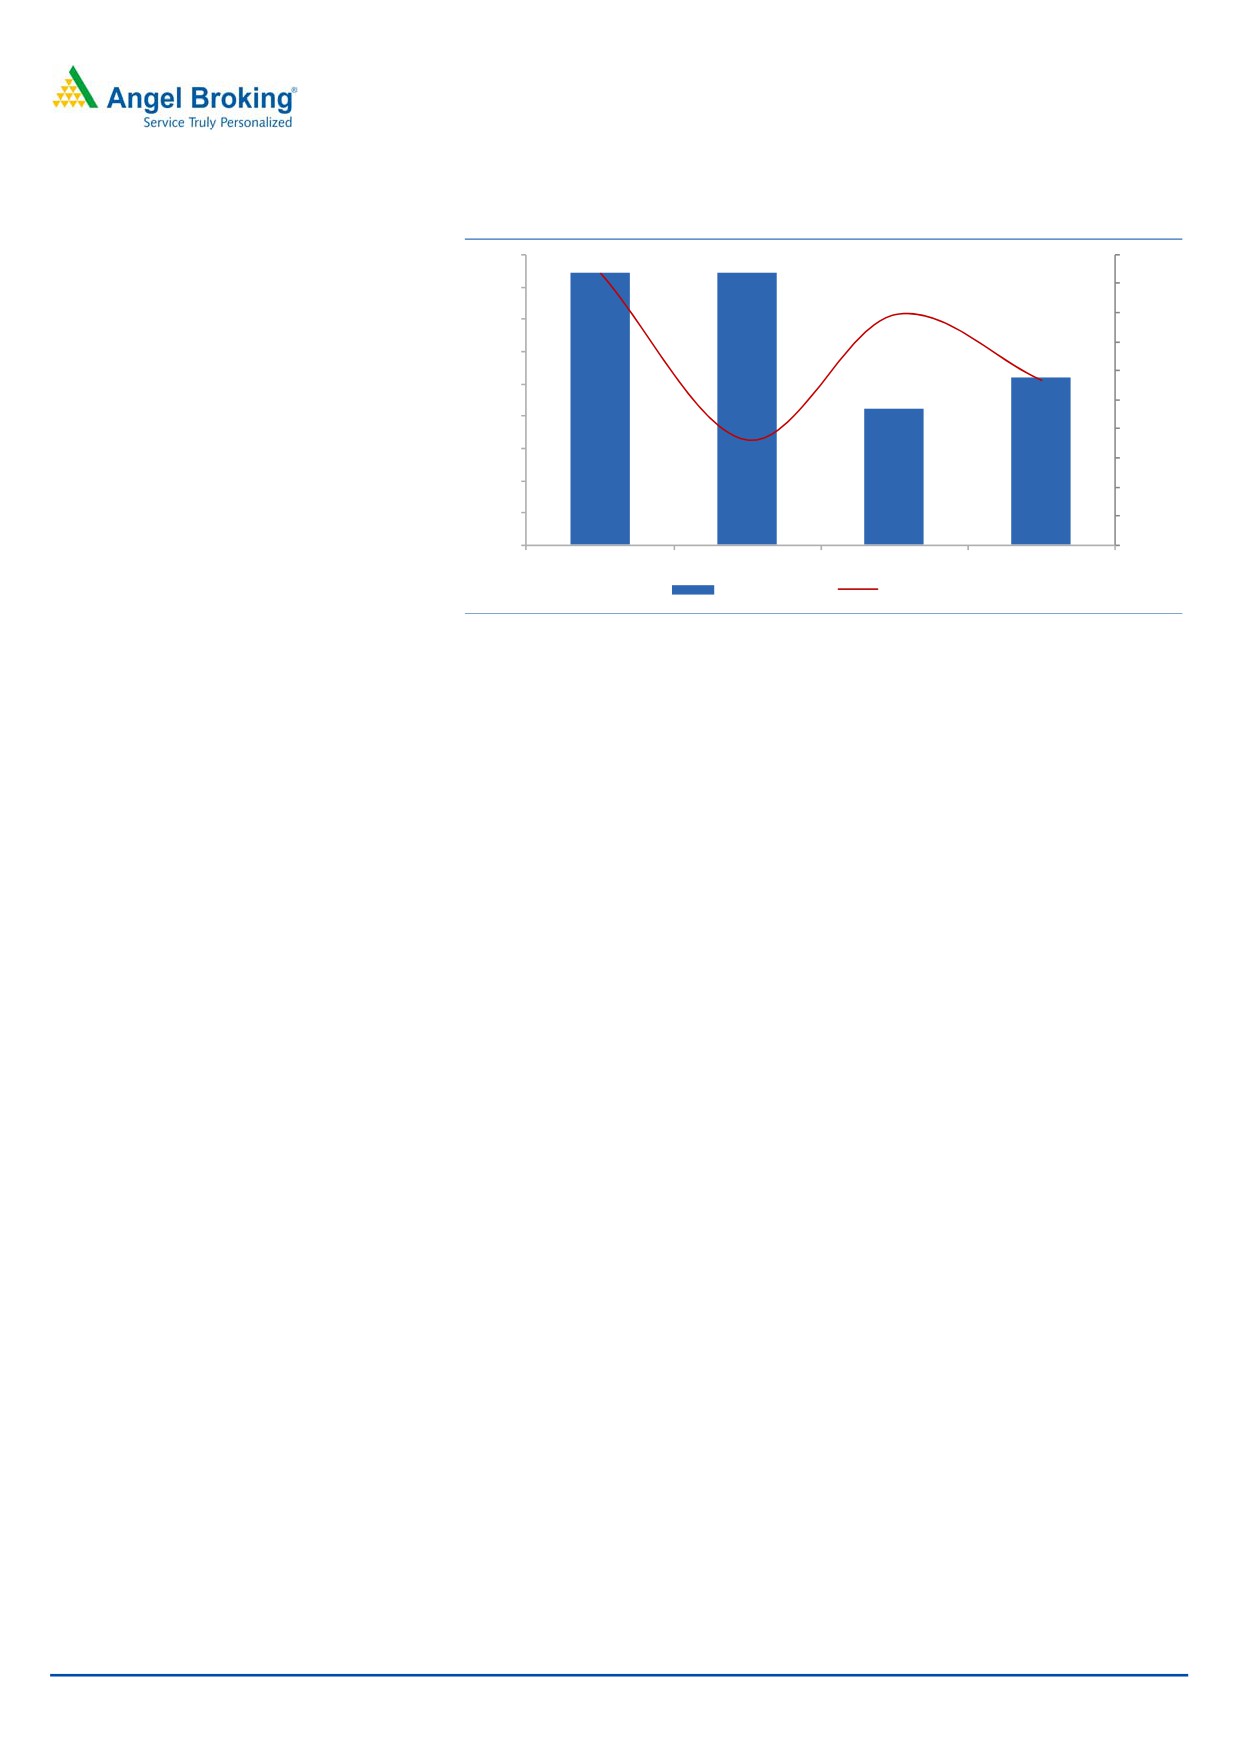
Exhibit 6: Increasing assets despite lower asset turnover
450
0.82
400
0.80
0.78
350
0.76
300
0.74
250
0.72
200
0.70
150
0.68
100
0.66
50
0.64
-
0.62
CY2012
CY2013
CY2014
CY2015
Capex (` cr)
Asset T/O (x)
Source: Company, Angel Research
Companies which create significant entry barriers in their industry also enjoy
superior return ratios. However this is not a case with VBL. Due to its partnership
with PepsiCo, VBL cannot produce any other competitive beverages. This means
despite acquisition / addition of new capacity, VBL is not allowed to leverage on its
additional capacities and industry experience. This is reflected in its gross asset
turnover ratio which has remained well below 1x showing lower turnover of its
fixed assets. The company has also aggressively added new capacities in last few
years which have also led to decline in its asset turnover.
Inconsistent profitability: VBL's financial performance has been inconsistent
with losses reported in CY2013 and CY2014. Overall its top line has witnessed a
CAGR of 25% from CY2011 to CY2015. The CAGR works out to be 51% at the
bottom-line, this has only improved in CY2015 thanks to the acquisition of
PepsiCo India's additional territories which helped it improve its profitability.
VBL’s has decent performance at EBITDA level with margins increasing from ~13%
in 2011 to ~19% in CY2015. The same however is not reflected in its EBT which
has shown drastic decline due to the high depreciation costs which represents
more than 50% of its EBITDA. Owing to its high leverage, VBL’s profitability eroded
significantly in CY2013 and CY2014 as it interest costs took away decent
profitability at EBITDA level. The company has also seen poor set of return ratios.
Return on Equity in CY2015 was at 12.5% vs. 14.6% in CY2011. VBL has also
seen poor cash generation in all years despite having strong cash flow from
operations.
October 24, 2016
6
Varun Beverages | IPO Note
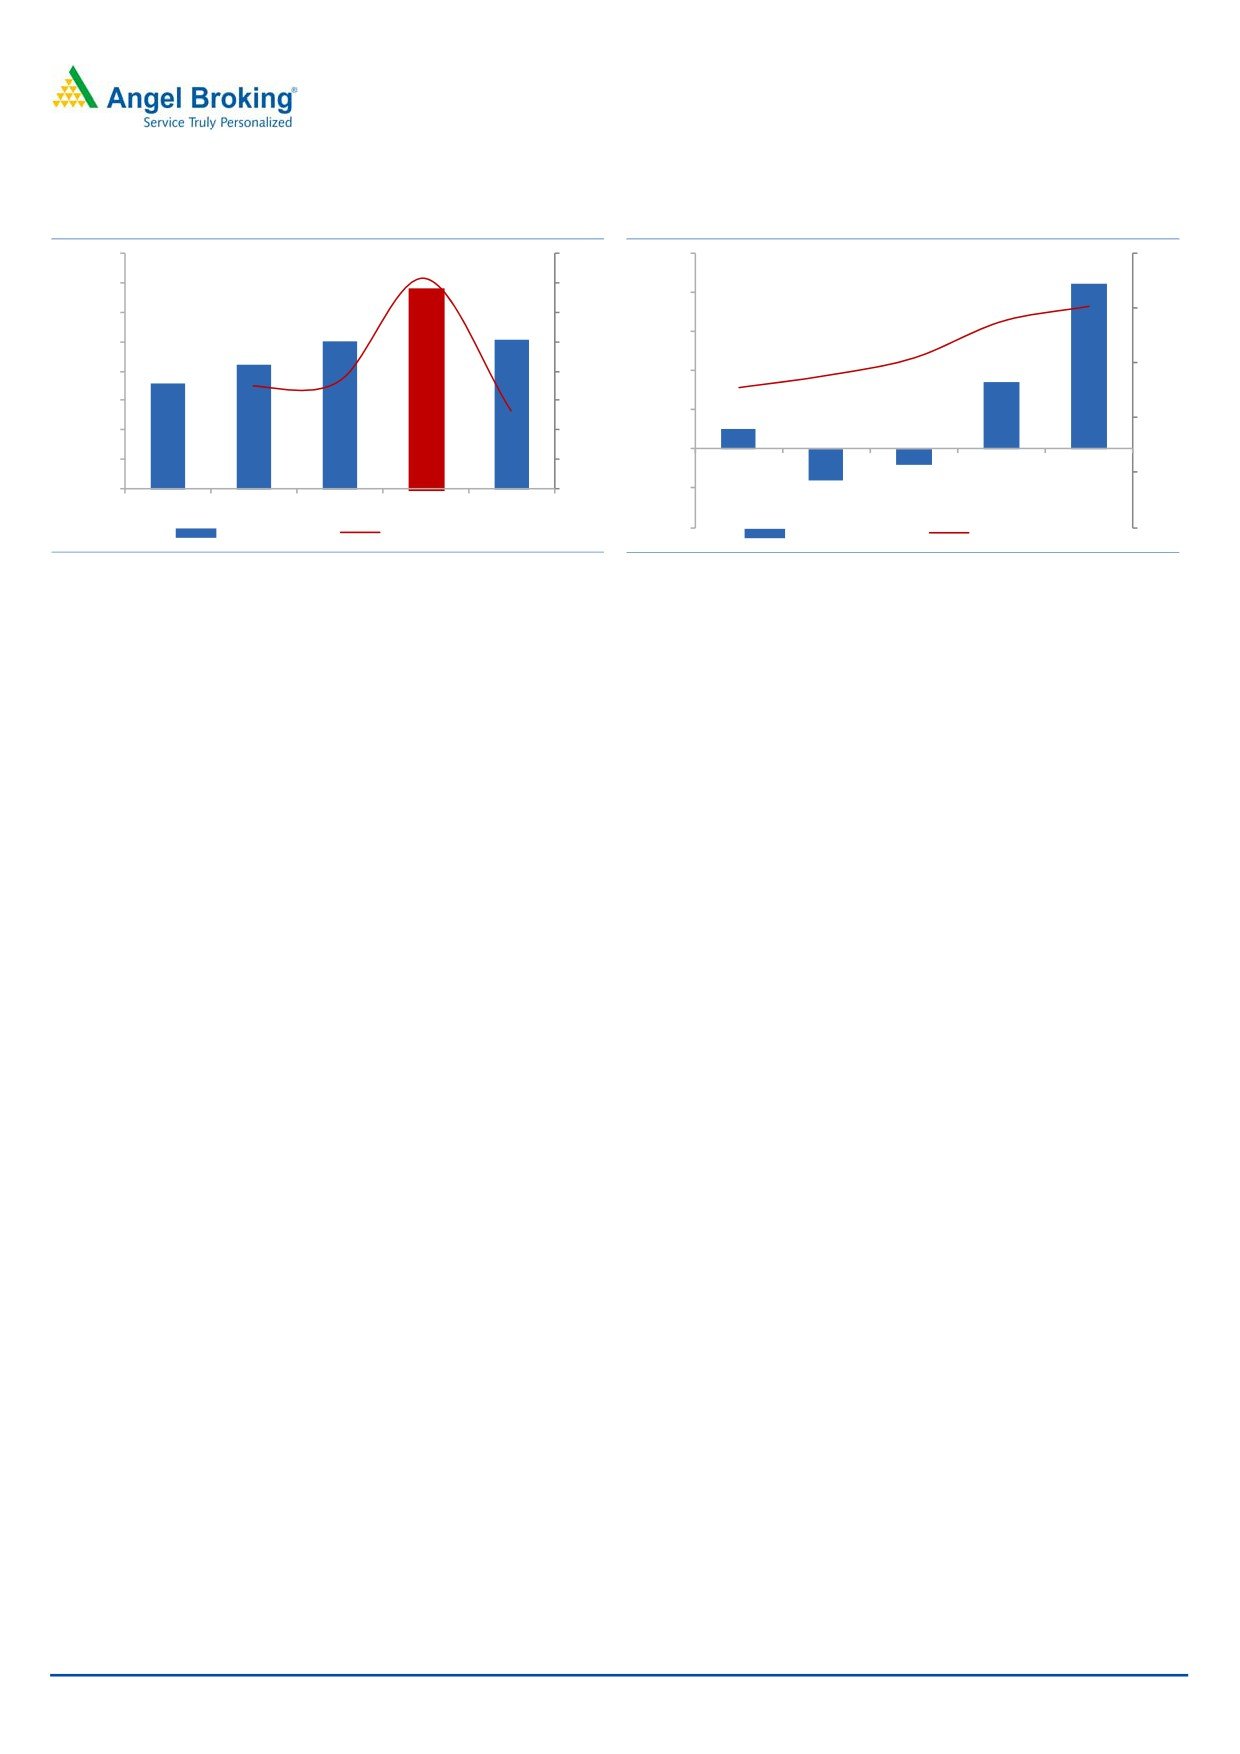
Exhibit 7: Strong growth in 2015
Exhibit 8: Inconsistent profitability
4,000.0
40.0
250.0
25.0
35.0
3,500.0
200.0
3,000.0
30.0
20.0
150.0
2,500.0
25.0
15.0
2,000.0
20.0
100.0
15.0
1,500.0
50.0
10.0
1,000.0
10.0
0.0
500.0
5.0
5.0
0.0
0.0
(50.0)
CY2012
CY2013
CY2014
CY2015
H1CY16
(100.0)
0.0
Net Sales(` cr)
YoY growth (%)
Net profit (` cr)
EBITDA margins
Source: Company, Angel Research
Source: Company, Angel Research
By end of H1CY2016, VBL has `2,138cr in debt (excluding PepsiCo's debt of
`623cr) Due to its high leverage and lower profitability, debt to equity ratios went
up to as high as 11.6x in CY2013. With reduction in debt and improved
profitability in last 18 months, debt to equity ratio has come down to 2.3x.
Outlook and Valuation: Overall we see VBL as a weak franchisee due to the
inconsistent profitability and poor pricing power. Due to the nature of its business,
(bottling, distribution and license to sell PepsiCo’s products), it can neither be
classified as a pure bottler nor a pure distribution company. We believe that there
is no comparable peer for the company in India.
On its upper band of price or `445, the issue is priced at P/E ratio of 85.4x of its
CY2015 EPS of
`5.2 which we believe is expensive. Considering its high
dependence on PepsiCo, low return ratios, poor profitability and high valuation we
rate this IPO ‘Neutral’
Upside risks
Grant of more territories by PepsiCo: PepsiCo’s decision to grant more territories
to VBL in future will increase VBL’s financial performance significantly.
Decline in Concentrate prices by PepsiCo: VBL is dependent on PepsiCo for
concentrate supply, prices of which are decided by PepsiCo. If PepsiCo decides to
cut the concentrate prices, it will lead to improve VBL’s performance.
October 24, 2016
7
Varun Beverages | IPO Note
Income Statement
Y/E December (` cr)
CY2012
CY2013
CY2014
CY2015
Total operating income
1,800
2,115
2,502
3,394
% chg
17.5
18.3
35.6
Total Expenditure
1,572
1,824
2,118
2,760
Raw Material Consumed
1,028
1,199
1,376
1,716
Personnel Expenses
152
183
217
324
Others Expenses
392
442
525
720
EBITDA
228
291
385
634
% chg
27.7
32.1
64.9
(% of Net Sales)
12.7
13.8
15.4
18.7
Depreciation& Amortisation
136
184
210
317
EBIT
92
107
174
317
% chg
15.7
63.4
81.5
(% of Net Sales)
5.1
5.0
7.0
9.3
Net Interest charges
71
152
171
155
Recurring PBT
21
(46)
4
162
% chg
(318.7)
(108.3)
4,195.2
Extraordinary Expense/(Inc.)
-
-
-
-
PBT (reported)
21
(46)
4
162
Tax
(4)
(5)
25
77
(% of PBT)
(20.4)
11.4
657.3
47.3
PAT before MI
25
(40)
(21)
86
Minority Interest (after tax)
0
(0)
-
-
Profit/Loss of Associate Company
-
1
1
2
PAT after MI(reported)
25
(41)
(22)
84
Exceptional Items
-
-
-
-
Reported PAT
25
(41)
(22)
84
% chg
NA
NA
NA
(% of Net Sales)
1.4
(1.9)
(0.9)
2.5
Basic EPS (`)
1.5
(2.4)
(1.2)
5.2
Fully Diluted EPS (`)
1.5
(2.4)
(1.2)
5.2
% chg
NA
NA
NA
October 24, 2016
8
Varun Beverages | IPO Note
Balance Sheet
Y/E December (` cr)
CY2012
CY2013
CY2014
CY2015
SOURCES OF FUNDS
Equity Share Capital
27
134
334
584
Reserves& Surplus
145
42
9
89
Shareholder’s Funds
172
175
343
672
Share application money
-
40
-
-
Minority Interest
0
0
-
-
Total Loans
1,701
2,033
2,139
1,832
Other long term liabilities
35
31
11
636
Long-term provisions
14
18
26
44
Deferred Tax Liability
72
64
81
151
Total Liabilities
1,994
2,361
2,600
3,336
APPLICATION OF FUNDS
Gross Block
2,231
3,055
3,214
4,627
Less: Acc. Depreciation
527
689
868
1,137
Net Block
1,703
2,365
2,345
3,490
Capital Work in Progress
189
27
25
38
Goodwill
10
10
10
10
Investments
0
1
2
3
Other long term assets
68
43
55
127
Current Assets
584
544
859
770
Investments
0
0
302
0
Inventories
231
246
289
425
Sundry Debtors
91
65
97
98
Cash
38
51
34
58
Loans & Advances
220
171
125
180
Other Assets
5
10
11
9
Current liabilities
560
628
695
1,102
Net Current Assets
24
(85)
164
(331)
Total Assets
1,994
2,361
2,600
3,336
October 24, 2016
9
Varun Beverages | IPO Note
Cash Flow Statement
Y/E December (` cr)
CY2012
CY2013
CY2014
CY2015
Profit before tax
21
(46)
4
162
Depreciation
136
184
210
317
Change in Working Capital
20
(12)
44
(41)
Interest / Dividend (Net)
107
157
175
153
Direct taxes paid
(11)
(4)
(11)
(43)
Others Expenses
8
18
9
12
Cash Flow from Operations
280
297
431
560
(Inc.)/ Dec. in Fixed Assets
(421)
(421)
(212)
(260)
(Inc.)/ Dec. in Investments
(91)
(0)
(302)
307
Others Expenses
5
(153)
14
(339)
Cash Flow from Investing
(507)
(574)
(500)
(292)
Issue of Equity
-
-
-
-
Inc./(Dec.) in loans
340.5
395.0
83.7
(667.7)
Dividend Paid (Incl. Tax)
-
-
-
-
Interest / Dividend (Net)
(111.3)
(160.7)
(185.9)
(151.4)
Others
-
40.0
160.0
570.0
Cash Flow from Financing
229
274
58
(249)
Inc./(Dec.) in Cash
3
(2)
(11)
19
Opening Cash balances
15.7
18.7
16.5
5.2
Closing Cash balances
18.7
16.5
5.2
24.3
October 24, 2016
10
Varun Beverages | IPO Note
Key Ratios
Y/E December
CY2012
CY2013
CY2014
CY2015
Valuation Ratio (x)
P/E (on FDEPS)
295.9
NA
NA
85.4
P/CEPS
46.2
51.3
39.1
18.4
P/BV
43.3
42.4
21.7
11.1
Dividend yield (%)
0.0
0.0
0.0
0.0
EV/Sales
5.5
4.7
3.9
2.9
EV/EBITDA
43.3
33.9
25.7
15.6
EV / Total Assets
3.9
3.3
3.0
2.2
Per Share Data (`)
EPS (Basic)
1.5
(2.4)
(1.2)
5.2
EPS (fully diluted)
1.5
(2.4)
(1.2)
5.2
Cash EPS
9.6
8.7
11.4
24.2
DPS
0.0
0.0
0.0
0.0
Book Value
10.3
10.5
20.5
40.3
Returns (%)
ROCE
4.9
4.8
7.0
10.1
Angel ROIC (Pre-tax)
5.6
5.0
7.2
10.4
ROE
14.6
(23.5)
(6.4)
12.5
Turnover ratios (x)
Asset Turnover (Gross Block)
0.8
0.7
0.8
0.7
Inventory / Sales (days)
82
75
77
90
Receivables (days)
17
10
13
9
Payables (days)
32
42
48
39
WC cycle (ex-cash) (days)
66
43
41
60
Solvency ratios (x)
Net debt to equity
9.7
11.3
6.1
3.6
Net debt to EBITDA
7.3
6.8
5.5
3.8
Interest Coverage (EBIT / Interest)
1.3
0.7
1.0
2.0
October 24, 2016
11
Varun Beverages | IPO Note
Research Team Tel: 022 - 39357800
DISCLAIMER
Angel Broking Private Limited (hereinafter referred to as “Angel”) is a registered Member of National Stock Exchange of India Limited,
Bombay Stock Exchange Limited and Metropolitan Stock Exchange Limited. It is also registered as a Depository Participant with CDSL
and Portfolio Manager with SEBI. It also has registration with AMFI as a Mutual Fund Distributor. Angel Broking Private Limited is a
registered entity with SEBI for Research Analyst in terms of SEBI (Research Analyst) Regulations, 2014 vide registration number
INH000000164. Angel or its associates has not been debarred/ suspended by SEBI or any other regulatory authority for accessing
/dealing in securities Market. Angel or its associates/analyst has not received any compensation / managed or co-managed public
offering of securities of the company covered by Analyst during the past twelve months.
This document is solely for the personal information of the recipient, and must not be singularly used as the basis of any investment
decision. Nothing in this document should be construed as investment or financial advice. Each recipient of this document should
make such investigations as they deem necessary to arrive at an independent evaluation of an investment in the securities of the
companies referred to in this document (including the merits and risks involved), and should consult their own advisors to determine
the merits and risks of such an investment.
Reports based on technical and derivative analysis center on studying charts of a stock's price movement, outstanding positions and
trading volume, as opposed to focusing on a company's fundamentals and, as such, may not match with a report on a company's
fundamentals. Investors are advised to refer the Fundamental and Technical Research Reports available on our website to evaluate the
contrary view, if any.
The information in this document has been printed on the basis of publicly available information, internal data and other reliable
sources believed to be true, but we do not represent that it is accurate or complete and it should not be relied on as such, as this
document is for general guidance only. Angel Broking Pvt. Limited or any of its affiliates/ group companies shall not be in any way
responsible for any loss or damage that may arise to any person from any inadvertent error in the information contained in this report.
Angel Broking Pvt. Limited has not independently verified all the information contained within this document. Accordingly, we cannot
testify, nor make any representation or warranty, express or implied, to the accuracy, contents or data contained within this document.
While Angel Broking Pvt. Limited endeavors to update on a reasonable basis the information discussed in this material, there may be
regulatory, compliance, or other reasons that prevent us from doing so.
This document is being supplied to you solely for your information, and its contents, information or data may not be reproduced,
redistributed or passed on, directly or indirectly.
Neither Angel Broking Pvt. Limited, nor its directors, employees or affiliates shall be liable for any loss or damage that may arise from
or in connection with the use of this information.
October 24, 2016
12