3QFY2016 Result Update | Cement
January 27, 2016
UltraTech Cement
ACCUMULATE
CMP
`2,755
Performance Highlights
Target Price
`3,107
Quarterly results (Standalone)
Investment Period
12 Months
Y/E March (` cr) 3QFY2016
2QFY2016
% chg qoq 3QFY2015
% chg yoy
Net revenue
5,747
5,621
2.2
5,490
4.7
Stock Info
Operating profit
1,044
928
12.5
846
23.4
Sector
Cement
OPM (%)
18.2
16.5
0.0
15.4
2.8
Market Cap (` cr)
75,604
Net profit
509
394
29.1
364
39.6
Net Debt (` cr)
1,838
Source: Company, Angel Research
Beta
1.0
UltraTech Cement (UltraTech)’s 3QFY2016 numbers have come in better than
52 Week High / Low
3,399 / 2531
our expectations on the top-line and operational fronts. The company’s net sales
Avg. Daily Volume
285,287
rose by 4.7% yoy to `5,747cr, aided by better than expected volume growth of
Face Value (`)
10
7.1% yoy. Blended realization was under pressure, down by 2.3% yoy, and was
BSE Sensex
24,486
slightly lower than our estimate. The EBITDA increased by 23% yoy to `1,044cr
Nifty
7,436
and the same was above our estimate of `975cr. The EBITDA margin came in at
Reuters Code
ULTC.BO
18.2%, also above our estimate of 17.3%, backed by strong operational
efficiency. The PAT came in at `509cr, up 39.6% yoy, which is above our
Bloomberg Code
UTCEM IN
estimate of `435cr, driven by margin expansion.
EBITDA margin healthy at 18.2%: For 3QFY2016, UltraTech reported an EBITDA
Shareholding Pattern (%)
growth of 23% yoy to `1,044cr, as against our estimate of `975cr. The strong
Promoters
62.7
EBIDTA performance was led by operational efficiency. The operating cost/tonne
MF / Banks / Indian Fls
7.4
declined by 4.6% yoy to `4,055, led by 13.9% yoy decline in power & fuel
FII / NRIs / OCBs
18.1
cost/tonne, largely due to softening pet coke prices. Higher pet coke usage at
Indian Public / Others
11.8
74% vs 65% in the sequential previous quarter helped savings in power & fuel
cost. The EBITDA margin increased by 280bp yoy to 18.2% and was above our
expectation of 17.3%. The blended EBITDA/tonne came in at `900, an increase
Abs. (%)
3m 1yr 3yr
of 16.1% yoy.
Sensex
(11.0)
(15.8)
22.3
Outlook and valuation: We expect UltraTech to post a 13.6% CAGR in its top-
Ultratech
(6.3)
(12.9)
39.2
line on back of new capacity expansion and healthy expected realization over
FY2015-17 period. The company’s bottom-line is expected to grow at a CAGR of
28% yoy over the same period. At the current levels, the stock is trading at 13x
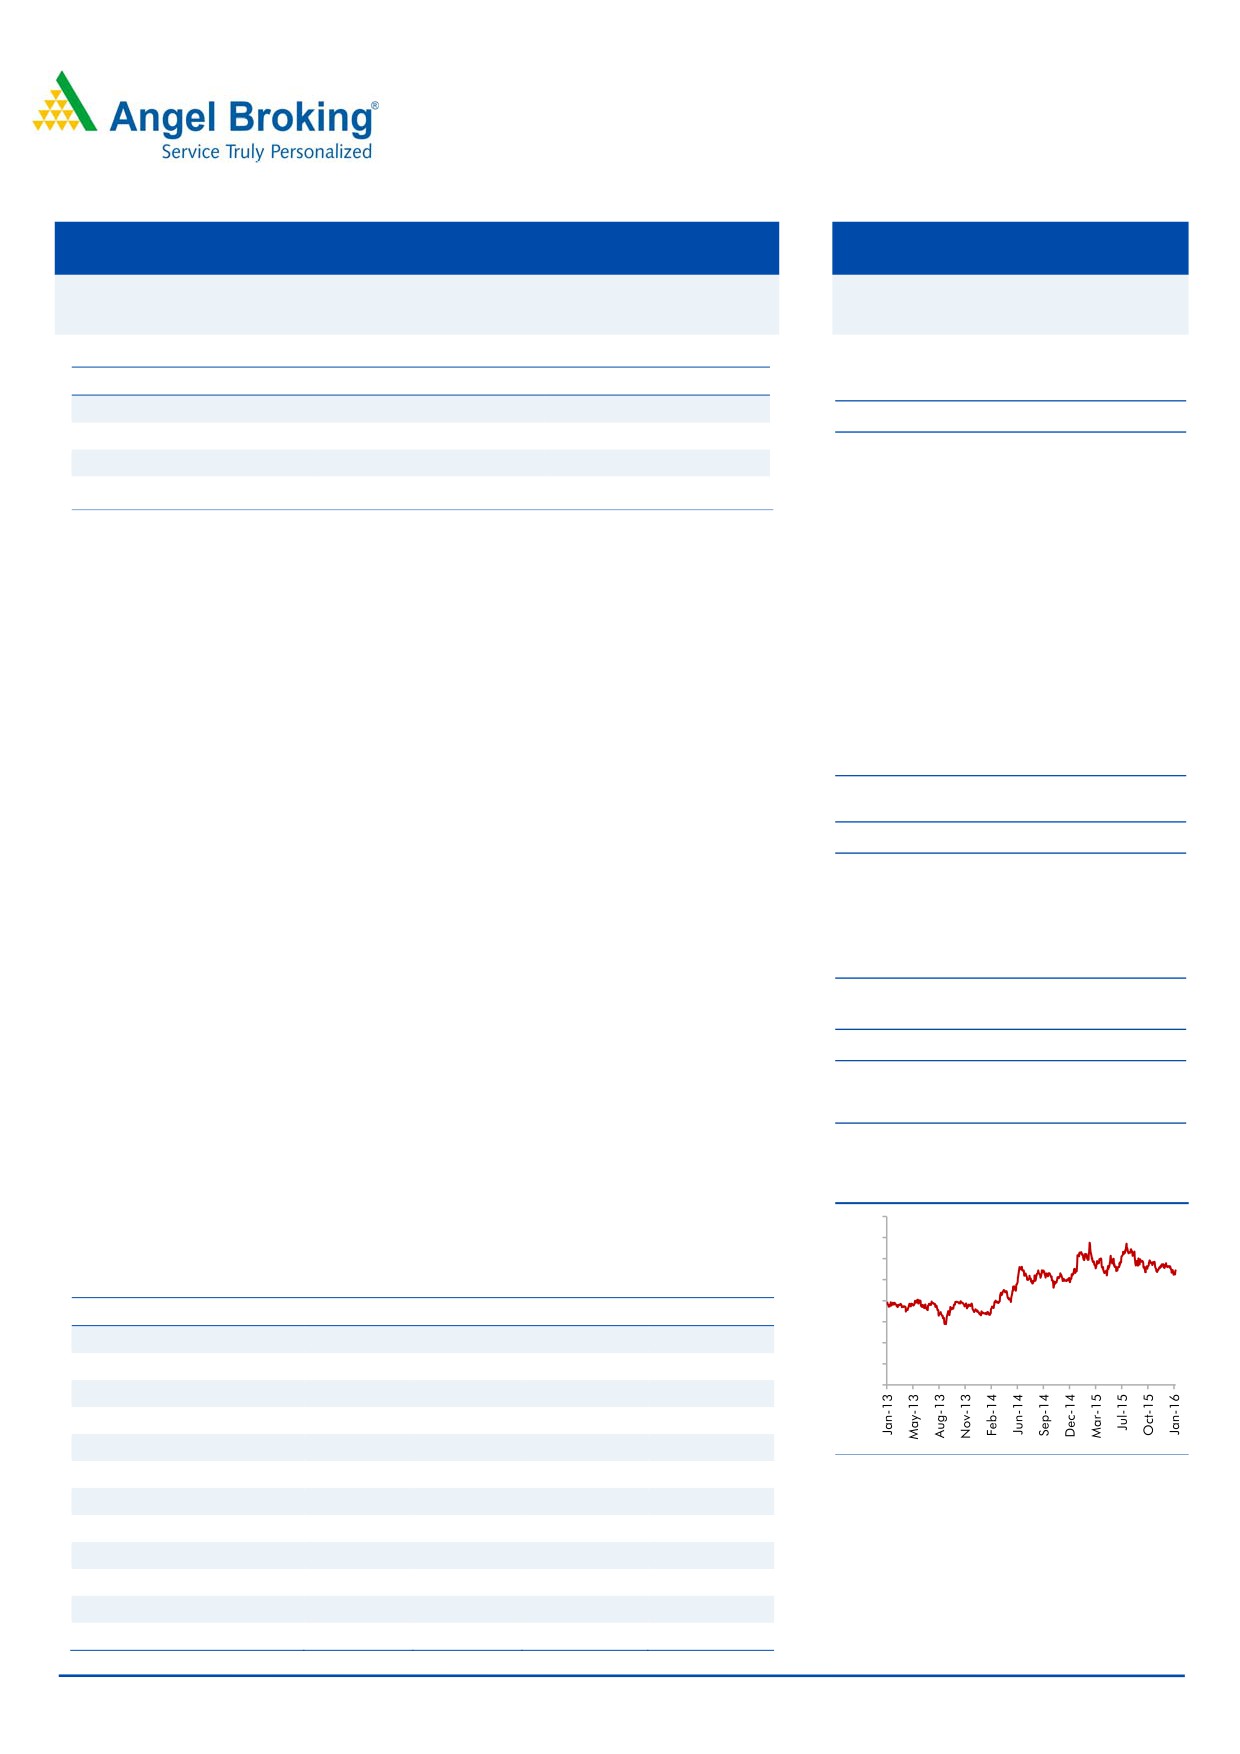
3-year price chart
4,000
EV/EBITDA and at an EV/tonne of US$165 on FY2017 capacity. We maintain
3,500
our Accumulate rating on the stock with a revised target price of `3,107.
3,000
2,500
Key financials (Standalone)
2,000
Y/E March (` cr)
FY2014
FY2015
FY2016E
FY2017E
1,500
Net Sales
20,078
22,656
24,669
29,265
1,000
500
% chg
0.3
12.8
7.6
18.6
0
Net Profit
2,112
2,015
2,253
3,292
% chg
(20.5)
(4.6)
6.7
34.4
FDEPS (`)
73.5
73.4
82.1
120.0
Source: Company, Angel Research
OPM
18.9
18.5
18.2
20.6
P/E(x)
37.3
37.3
33.4
22.8
P/BV(x)
4.4
4.0
3.6
3.1
RoE(%)
12.5
11.2
11.3
14.7
RoCE(%)
11.5
11.4
10.3
13.7
Siddharth Purohit
EV/Sales (x)
3.7
3.4
3.2
2.7
022-39357800 Ext 6872
EV/EBITDA
19.8
18.4
17.6
13.0
Source: Company, Angel Research; Note: CMP as of January 25, 2016
Please refer to important disclosures at the end of this report
1
UltraTech Cement | 3QFY2016 Result Update
Exhibit 1: 3QFY2016 performance (Standalone)
Y/E March (` cr)
3QFY2016
2QFY2016
% Chg 3QFY2015
% Chg
9MFY2016
9MFY2015
% Chg
Net sales
5,747
5,621
2.2
5,490
4.7
17,406
16,518
5.4
Net raw-material costs
800
800
0.1
741
7.9
2,543
2,423
4.9
(% of sales)
13.9
14.2
13.5
14.6
14.7
Power & fuel
1,068
1,059
0.9
1,206
(11.4)
3,224
3,558
(9.4)
(% of sales)
18.6
18.8
22.0
18.5
21.5
Staff costs
349
341
2.6
306
14.3
1,002
892
12.4
(% of sales)
6.1
6.1
5.6
5.8
5.4
Freight & forwarding
1,398
1,347
3.8
1,318
6.1
4,298
3,938
9.1
(% of sales)
24.3
24.0
24.0
24.7
23.8
Other expenses
979
1,041
(6.0)
939
4.2
2,958
2,853
3.7
(% of sales)
17.0
18.5
17.1
17.0
17.3
Total Expenditure
4,703
4,693
0.2
4,644
1.3
14,341
13,835
3.7
Operating Profit
1,044
928
12.5
846
23.4
3,065
2,683
14.2
OPM (bps)
18.2
16.5
165bp
15.4
275bp
17.6
16.2
90bp
Interest
126
130
(3.5)
154
(18.4)
394
398
(0.8)
Depreciation
324
333
(2.8)
278
16.4
940
845
11.2
Other income
132
105
25.5
144
(8.8)
396
522
(24.1)
PBT
726
570
27.5
558
30.2
2,127
1,962
8.4
Provision for taxation
218
176
23.8
193
12.5
634
562
12.7
(% of PBT)
30.0
30.9
34.7
29.8
28.7
Adjusted PAT
509
394
29.1
364
39.6
1,493
1,400
6.7
PATM
8.8
7.0
6.6
8.6
8.5
EPS (`)
18.5
14.4
13.3
54.4
51.0
Source: Company, Angel Research
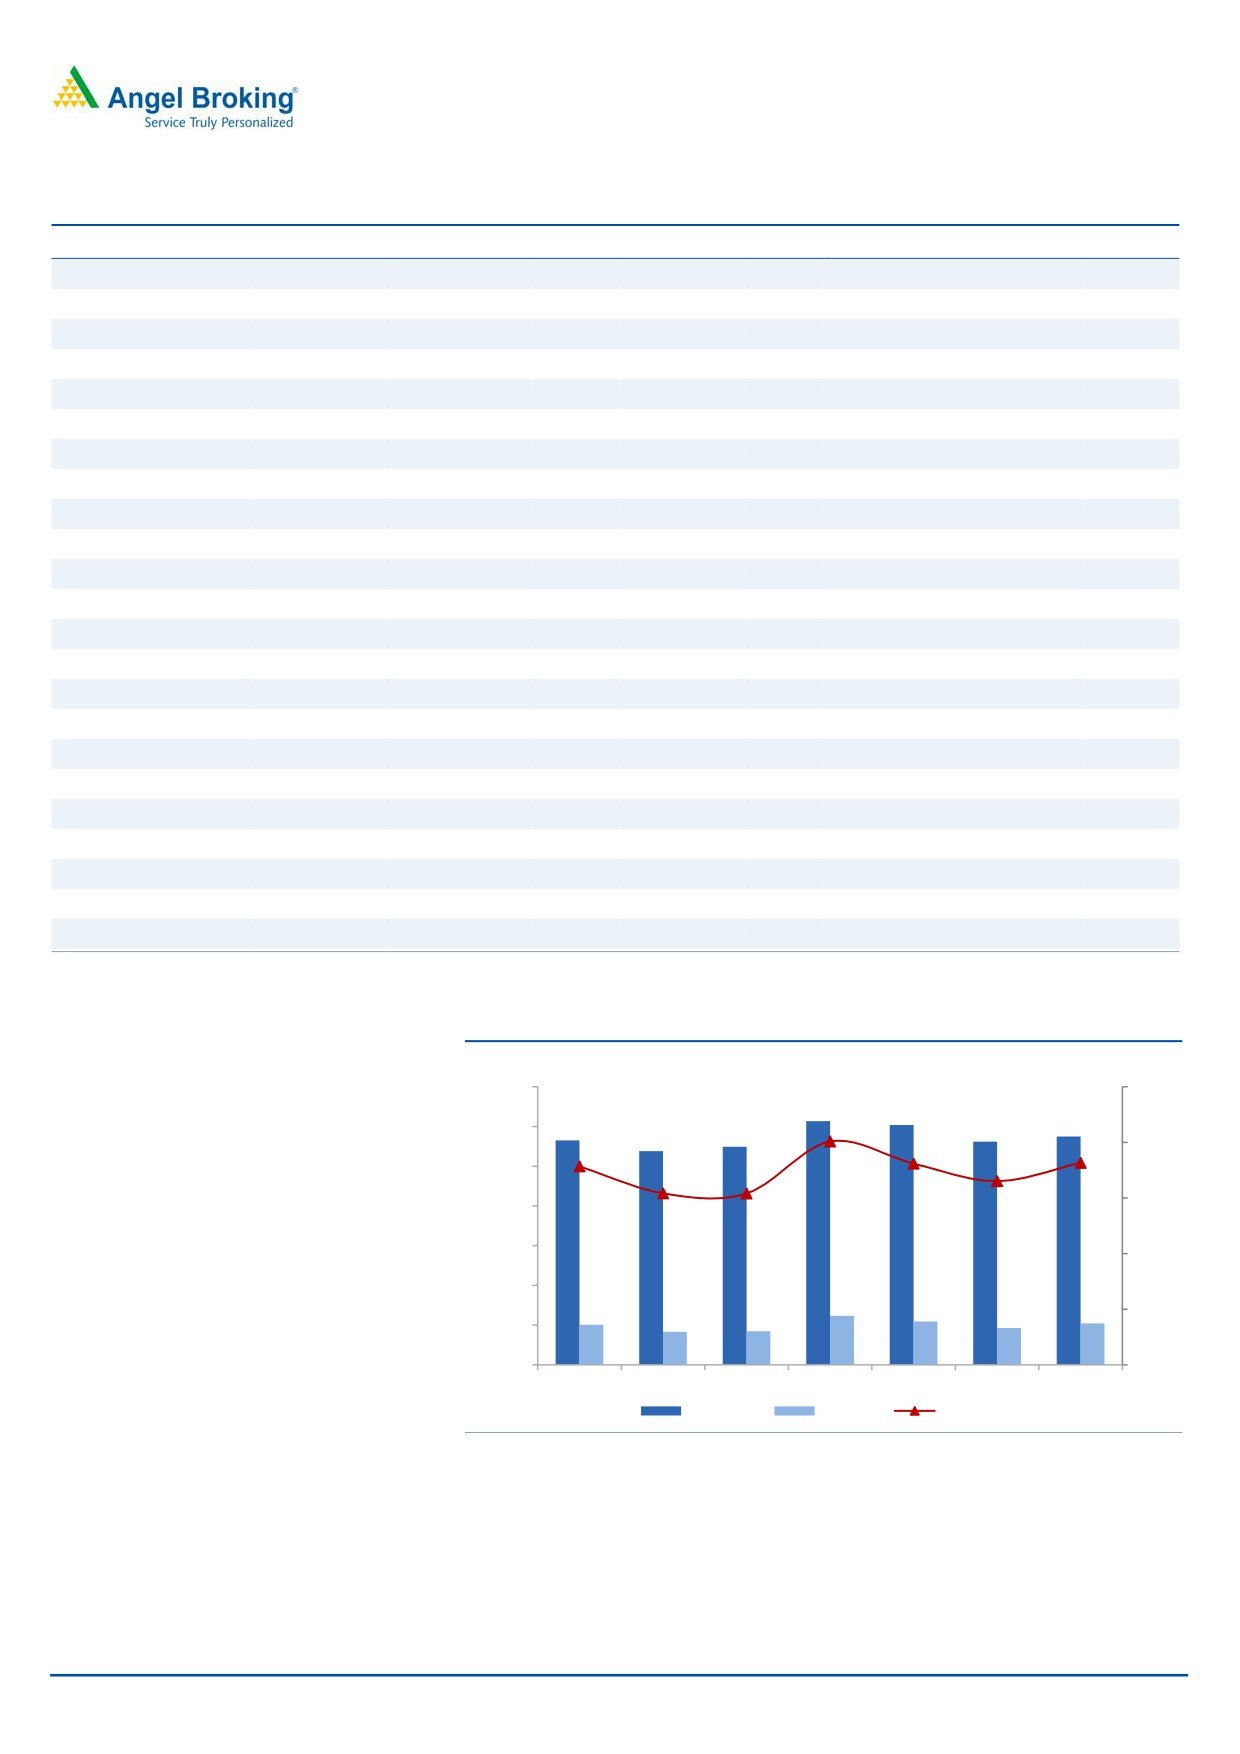
Exhibit 2: Financial performance
(` cr)
(%)
7,000
25.0
6,135
6,038
5,649
5,621
5,747
6,000
5,490
5,379
20.0
5,000
20.1
18.
2
17.8
18.1
16.5
15.0
4,000
15.4
15.4
3,000
10.0
2,000
1,232
1,093
1,008
1,044
5.0
829
846
928
1,000
-
0.0
1QFY15
2QFY15
3QFY15
4QFY15
1QFY16
2QFY16
3QFY16
Net sales
EBITDA
EBITDA %
Source: Company, Angel Research
January 27, 2016
2
UltraTech Cement | 3QFY2016 Result Update
Exhibit 3: 3QFY2016 Actual vs Angel Estimates
(` cr)
Actual
Estimates
Variation (%)
Net Sales
5,747
5,650
1.7
EBITDA
1044
975
7.1
EBITDA M (%)
18.2
17.3
Net Profit
509
435
16.9
Source: Company, Angel Research
Performance highlights
Net sales up 4.7% yoy
For 3QFY2016, UltraTech’s top-line rose by 4.7% yoy to `5,747cr, aided by 7.1%
yoy increase in cement sales volume to 11.6mn tonne. The blended cement
realization/tonne declined by 2.3%/1.2% yoy/qoq to `4,955. Sales volume of
white cement and wall care putty rose by 6.6% yoy to 0.34mn tonne. The company
witnessed strong growth in the East region while the North region continued to be
decent. The company remains hopeful of demand recovery on back of government
spending on infrastructure development and housing schemes.
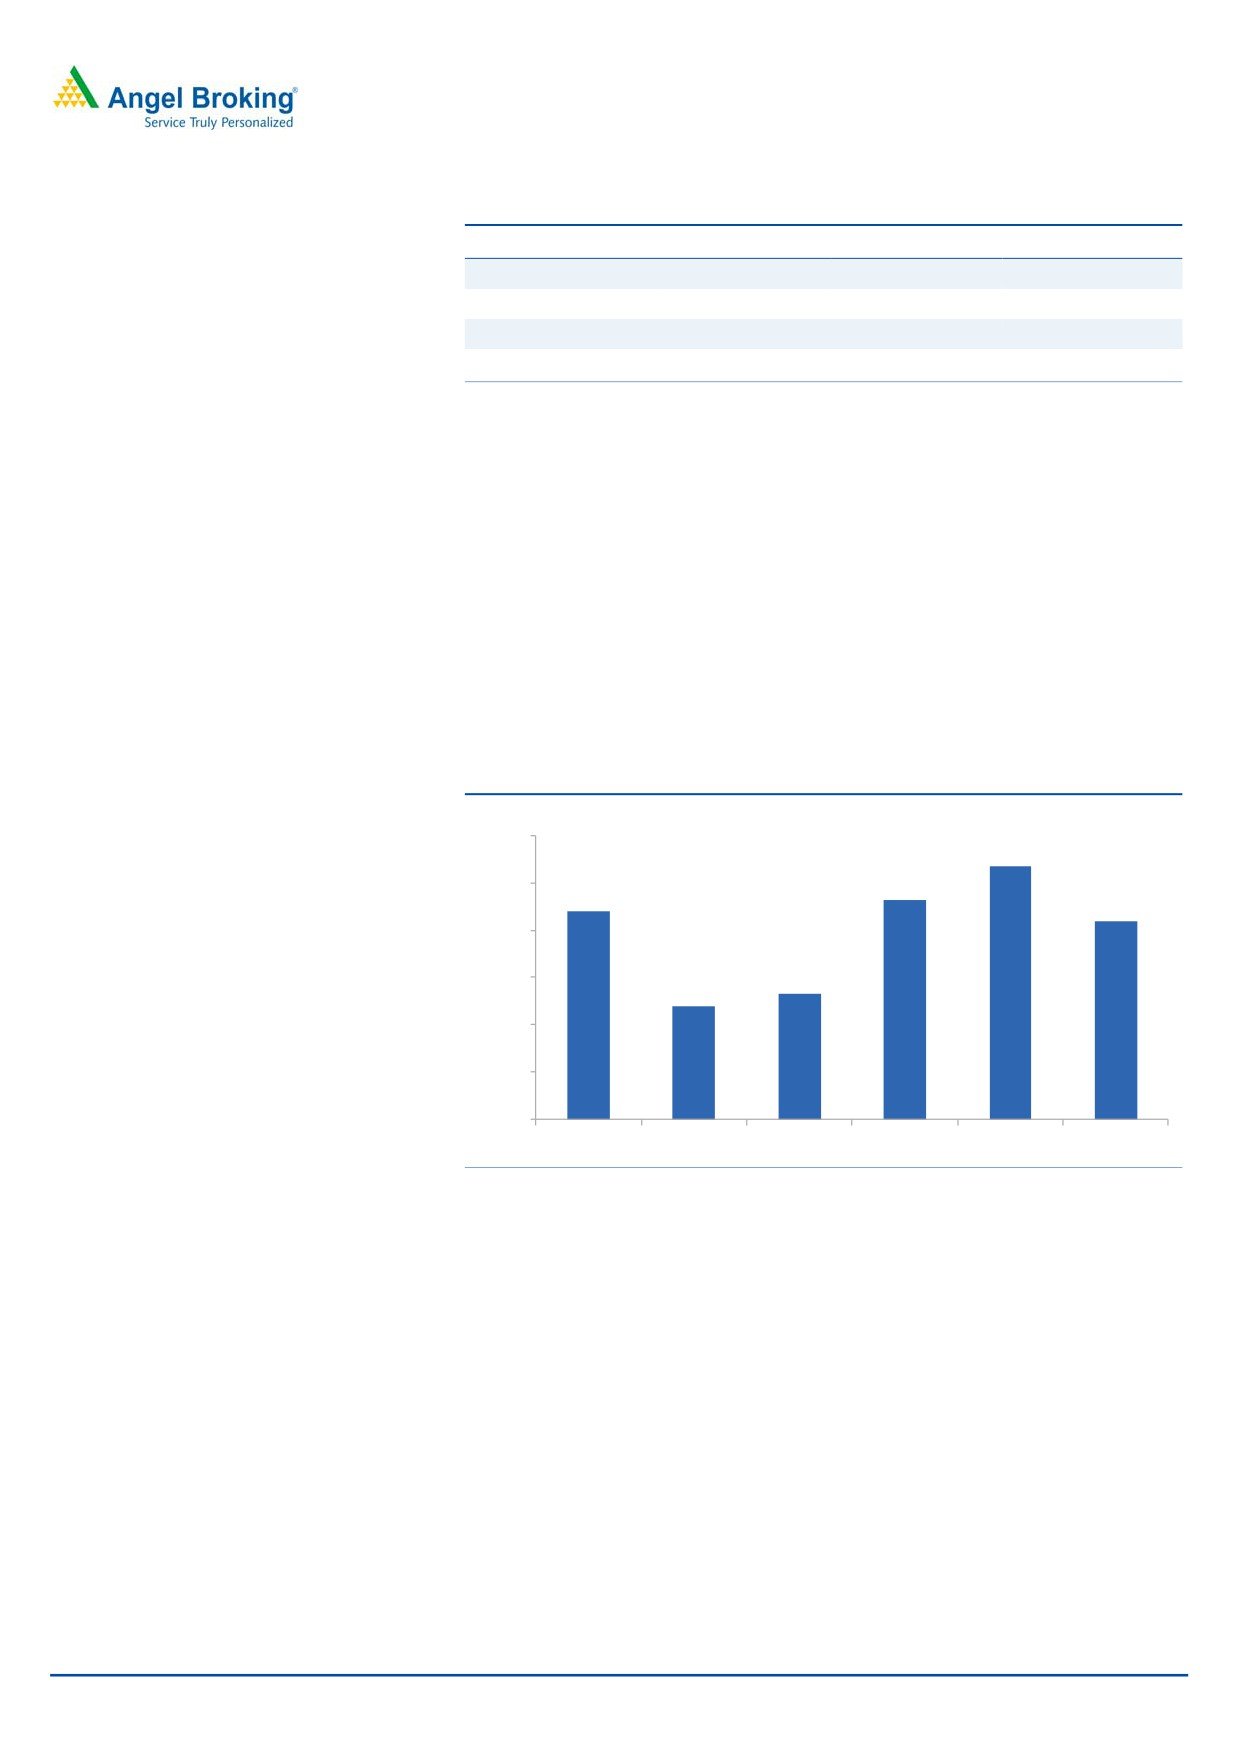
Exhibit 4: Volume performance
(mn tn)
12.5
12.0
12.2
11.8
11.5
11.7
11.6
11.0
10.8
10.5
10.7
10.0
9.5
1QFY15
2QFY15
3QFY15
4QFY15
1QFY16
3QFY16
Source: Company, Angel Research
EBITDA margin improves by 275bp yoy
The EBITDA margin for the quarter improved by 275bp yoy to 18.2% on account
of healthy top-line growth and lower operating costs. Operating efficiency was led
by 11.4% yoy fall in power expenses, mainly due to decline in pet coke prices. The
lower input costs would be reflected in the coming quarters as well. The company
consumed 74% pet coke during the quarter as against 65% consumption in
2QFY2016. Freight cost/tonne at `1,205 remained flat yoy, while it declined
5.5% qoq (`1,276 in 2QFY2016) due lower diesel prices. The company intends to
optimize fuel costs by increasing pet coke consumption levels to 85-90% across
plants from the current levels of 74%.
January 27, 2016
3
UltraTech Cement | 3QFY2016 Result Update
Per-tonne analysis
During 2QFY2016, UltraTech’s raw material cost/tonne declined marginally by
0.4% yoy. The power and fuel cost/tonne declined by13.9% yoy, mainly due to
higher pet coke consumption. Pet coke prices have corrected by 18% yoy, thus
resulting in lower power & fuel cost/tonne. Freight cost/tonne remained flat yoy; it
however declined by 5.5% qoq. The company’s operating cost/tonne declined by
4.6% yoy to `4,055 during the quarter. The company’s operating profit/tonne rose
by 16.1% yoy to `900, during the quarter.
Exhibit 5: Operational performance
Particulars (`/tonne)
3QFY2016 2QFY2016 3QFY2015 qoq chg (%) yoy chg (%)
Net Realization/tonne
4,955
4,962
5,027
(0.1)
(1.4)
Net Raw-Material Cost/tonne
690
775
693
(11.0)
(0.4)
Power and Fuel cost/tonne
921
902
1,070
2.1
(13.9)
Freight Cost/tonne
1,205
1,276
1,206
(5.5)
(0.1)
Other Cost/tonne
844
770
905
9.5
(6.7)
Operating costs/tonne
4,055
4,064
4,252
(0.2)
(4.6)
Operating Profit/tonne
900
898
775
0.2
16.1
Source: Company, Angel Research
Investment arguments
Update on capacity addition plans: UltraTech is the largest cement company in
India with its current capacity standing at 64.7mtpa. The company commissioned
1.6mtpa grinding units each in Jhajjar, Haryana and Dhankuni, West Bengal
during the quarter. The acquisition of JP Associates’ two plants at Bela and Sidhi
district of Madhya Pradesh has been delayed due to provision in new Mines and
Minerals Development and Regulation Act 2015. The new act restricts transfer of
mines that were not allotted through the auction process. The Management expects
the integration of the JP Associates’ Madhya Pradesh units to be completed by
March 2016 end. Post this acquisition, UltraTech’s capacity would increase to
71.2mtpa by the end of FY2017.
Outlook and valuation:
We expect UltraTech to post a 13.6% CAGR in its top-line on back of new capacity
expansion and expected healthy realization over FY2015-17. The company’s
bottom-line is expected to grow at a CAGR of 28% yoy over the same period. At
the current levels, the stock is trading at 13x EV/EBITDA and at EV/tonne of
US$165 on FY2017E capacity. We maintain our Accumulate rating on the stock
with a revised target price of `3,107.
Company Background
UltraTech became India's largest cement player on a standalone basis, with total
capacity of 64.7 mtpa post the merger of Jaiprakash Associates’ Gujarat’s
4.8mtpa unit with itself in 1QFY2015. UltraTech also acquired a controlling stake
in Dubai-based ETA Star (cement capacities of 3mtpa in the Middle East and
Bangladesh) in 2010, which took its total consolidated capacity to 67.7mtpa.
UltraTech is a pan-India player, with 22 cement plants spread across the country.
January 27, 2016
4
UltraTech Cement | 3QFY2016 Result Update
Profit and Loss statement (Standalone)
Y/E March (` cr)
FY2013
FY2014
FY2015
FY2016E
FY2017E
Net Sales
20,018
20,078
22,656
24,669
29,265
Other operating income
157
202
280
-
-
Total operating income
20,175
20,280
22,936
24,669
29,265
% chg
10.2
0.5
13.1
7.6
18.6
Total Expenditure
15,499
16,494
18,741
20,192
23,245
Net Raw Materials
2,910
3,327
3,560
3,992
4,625
Other Mfg costs
4,299
4,135
4,743
4,794
5,443
Personnel
968
1,015
1,218
1,401
1,611
Other
7,323
8,017
9,220
10,004
11,566
EBITDA
4,675
3,785
4,195
4,478
6,020
% chg
12.7
(19.0)
10.8
6.7
34.4
(% of Net Sales)
23.4
18.9
18.5
18.2
20.6
Depreciation& Amortization
945
1,052
1,133
1,354
1,545
EBIT
3,730
2,733
3,062
3,124
4,475
% chg
15.0
(26.7)
12.0
2.0
43.2
(% of Net Sales)
18.6
13.6
13.5
12.7
15.3
Interest & other Charges
210
319
547
569
547
Other Income
305
329
372
673
788
(% of PBT)
8.0
12.0
12.9
20.9
16.7
Recurring PBT
3,825
2,743
2,886
3,228
4,716
% chg
12.8
(28.3)
5.2
11.9
46.1
Extraordinary Expense/(Inc.)
-
-
-
-
-
PBT (reported)
3,825
2,743
2,886
3,228
4,716
Tax
1,170.0
631.0
871.5
974.8
1,424.0
(% of PBT)
30.6
23.0
30.2
30.2
30.2
PAT (reported)
2,655
2,112
2,015
2,253
3,292
ADJ. PAT
2,655
2,016
2,015
2,253
3,292
% chg
8.6
(24.1)
(0.1)
11.9
46.1
(% of Net Sales)
13.3
10.0
8.9
9.1
11.2
Basic EPS (`)
97
74
73
82
120
Fully Diluted EPS (`)
97
74
73
82
120
January 27, 2016
5
UltraTech Cement | 3QFY2016 Result Update
Balance Sheet (standalone)
Y/E March (` cr)
FY2013
FY2014
FY2015
FY2016E
FY2017E
SOURCES OF FUNDS
Equity Share Capital
274
274
274
274
274
Reserves& Surplus
14,961
16,823
18,583
20,653
23,609
Shareholders Funds
15,235
17,098
18,858
20,928
23,883
Total Loans
5,409
5,199
7,414
7,414
7,414
Deferred Tax Liability
1,906
2,296
2,792
2,792
2,792
Other long term liabilities
2
2
1
1
1
Long term provisions
134
138
138
138
138
Total Liabilities
22,685
24,733
29,203
31,273
34,229
APPLICATION OF FUNDS
Gross Block
21,382
25,078
30,660
35,660
39,660
Less: Acc. Depreciation
8,260
9,206
10,339
11,693
13,238
Net Block
13,122
15,872
20,321
23,968
26,423
Capital Work-in-Progress
3,505
2,042
2,700
700
1,700
Goodwill
-
-
-
-
-
Investments
5,109
5,392
5,209
5,209
5,209
Long term loans and adv.
983
1,181
1,181
1,181
1,181
Current Assets
4,689
5,268
5,805
6,782
7,169
Cash
143
278
214
609
271
Loans & Advances
1,173
1,326
1,620
1,819
2,104
Other
3,373
3,665
3,971
4,353
4,794
Current liabilities
4,724
5,021
6,012
6,565
7,452
Net Current Assets
(35)
247
(207)
216
(283)
Mis. Exp. not written off
-
-
-
-
-
Total Assets
22,685
24,733
29,203
31,273
34,229
January 27, 2016
6
UltraTech Cement | 3QFY2016 Result Update
Cash flow statement (Standalone)
Y/E March (` cr)
FY2013
FY2014
FY2015
FY2016E FY2017E
Profit before tax
3,825
2,743
2,886
3,228
4,716
Depreciation
945
1,052
1,133
1,354
1,545
Change in Working Capital
808
(340)
391
(29)
162
Add: Interest expenses
210
319
547
569
547
Less: Other income
305
329
372
673
788
Direct taxes paid
1,170
631
872
975
1,424
Cash Flow from Operations
4,313
2,814
3,714
3,474
4,757
(Inc)/ Decin Fixed Assets
(3,977)
(2,232)
(6,241)
(3,000)
(5,000)
(Inc)/ Dec in Investments
(1,320)
(283)
183
-
-
Other income
305
329
372
673
788
Cash Flow from Investing
(4,992)
(2,186)
(5,686)
(2,327)
(4,212)
Issue of Equity
0
0
0
-
-
Inc./(Dec.) in loans
1,256
(209)
2,214
0
0
Dividend Paid (Incl. Tax)
289
289
297
332
486
Others
334
(4)
9
457
420
Cash Flow from Financing
633
(493)
1,908
(790)
(906)
Inc./(Dec.) in Cash
(46)
135
(64)
358
(360)
Opening Cash balances
188
143
277
214
572
Closing Cash balances
143
277
214
572
211
January 27, 2016
7
UltraTech Cement | 3QFY2016 Result Update
Key Ratios
Y/E March
FY2013
FY2014
FY2015
FY2016E
FY2017E
Valuation Ratio (x)
P/E (on FDEPS)
28.3
37.3
37.3
33.4
22.8
P/CEPS
20.9
23.7
23.9
20.8
15.5
P/BV
4.9
4.4
4.0
3.6
3.1
Dividend yield (%)
0.4
0.4
0.4
0.4
0.6
EV/Sales
3.7
3.7
3.4
3.2
2.7
EV/EBITDA
15.8
19.8
18.4
17.6
13.0
EV / Total Assets
3.2
3.0
2.6
2.5
2.3
Per Share Data (`)
EPS (Basic)
96.8
73.5
73.4
82.1
120.0
EPS (fully diluted)
96.8
73.5
73.4
82.1
120.0
Cash EPS
131.3
115.4
114.7
131.5
176.3
DPS
10.5
10.5
10.8
12.1
17.7
Book Value
555.7
623.5
687.2
762.7
870.4
Dupont Analysis
EBIT margin
18.5
13.5
13.3
12.7
15.3
Tax retention ratio
69.4
77.0
69.8
69.8
69.8
Asset turnover (x)
1.0
0.9
0.9
0.8
0.9
ROIC (Post-tax)
12.6
9.0
8.0
7.3
9.7
Cost of Debt (Post Tax)
3.1
4.6
6.1
5.4
5.2
Leverage (x)
0.3
0.3
0.4
0.4
0.3
Operating ROE
15.8
10.4
8.7
8.0
11.2
Returns (%)
ROCE (Pre-tax)
18.0
11.5
11.4
10.3
13.7
Angel ROIC (Pre-tax)
26.6
17.7
16.1
13.6
17.3
ROE
18.9
12.5
11.2
11.3
14.7
Turnover ratios (x)
Asset Turnover (Gross Block)
1.0
0.9
0.8
0.7
0.8
Inventory / Sales (days)
40
42
41
43
39
Receivables (days)
16
21
20
19
17
Payables (days)
104
108
107
114
110
WC cycle (ex-cash) (days)
(2)
(2)
(4)
(6)
(6)
Solvency ratios (x)
Net debt to equity
0.0
(0.0)
0.1
0.1
0.1
Net debt to EBITDA
0.0
(0.1)
0.5
0.4
0.3
Interest Coverage (EBIT / Int.)
17.8
8.6
5.6
5.5
8.2
January 27, 2016
8
UltraTech Cement | 3QFY2016 Result Update
Research Team Tel: 022 - 39357800
DISCLAIMER
Angel Broking Private Limited (hereinafter referred to as “Angel”) is a registered Member of National Stock Exchange of India Limited,
Bombay Stock Exchange Limited and Metropolitan Stock Exchange of India Limited. It is also registered as a Depository Participant with
CDSL and Portfolio Manager with SEBI. It also has registration with AMFI as a Mutual Fund Distributor. Angel Broking Private Limited is
a registered entity with SEBI for Research Analyst in terms of SEBI (Research Analyst) Regulations, 2014 vide registration number
INH000000164. Angel or its associates has not been debarred/ suspended by SEBI or any other regulatory authority for accessing
/dealing in securities Market. Angel or its associates including its relatives/analyst do not hold any financial interest/beneficial
ownership of more than 1% in the company covered by Analyst. Angel or its associates/analyst has not received any compensation /
managed or co-managed public offering of securities of the company covered by Analyst during the past twelve months. Angel/analyst
has not served as an officer, director or employee of company covered by Analyst and has not been engaged in market making activity
of the company covered by Analyst.
This document is solely for the personal information of the recipient, and must not be singularly used as the basis of any investment
decision. Nothing in this document should be construed as investment or financial advice. Each recipient of this document should
make such investigations as they deem necessary to arrive at an independent evaluation of an investment in the securities of the
companies referred to in this document (including the merits and risks involved), and should consult their own advisors to determine
the merits and risks of such an investment.
Reports based on technical and derivative analysis center on studying charts of a stock's price movement, outstanding positions and
trading volume, as opposed to focusing on a company's fundamentals and, as such, may not match with a report on a company's
fundamentals.
The information in this document has been printed on the basis of publicly available information, internal data and other reliable
sources believed to be true, but we do not represent that it is accurate or complete and it should not be relied on as such, as this
document is for general guidance only. Angel Broking Pvt. Limited or any of its affiliates/ group companies shall not be in any way
responsible for any loss or damage that may arise to any person from any inadvertent error in the information contained in this report.
Angel Broking Pvt. Limited has not independently verified all the information contained within this document. Accordingly, we cannot
testify, nor make any representation or warranty, express or implied, to the accuracy, contents or data contained within this document.
While Angel Broking Pvt. Limited endeavors to update on a reasonable basis the information discussed in this material, there may be
regulatory, compliance, or other reasons that prevent us from doing so.
This document is being supplied to you solely for your information, and its contents, information or data may not be reproduced,
redistributed or passed on, directly or indirectly.
Neither Angel Broking Pvt. Limited, nor its directors, employees or affiliates shall be liable for any loss or damage that may arise from
or in connection with the use of this information.
Note: Please refer to the important ‘Stock Holding Disclosure' report on the Angel website (Research Section). Also, please refer to the
latest update on respective stocks for the disclosure status in respect of those stocks. Angel Broking Pvt. Limited and its affiliates may
have investment positions in the stocks recommended in this report.
Disclosure of Interest Statement
UltraTech Cement
1. Analyst ownership of the stock
No
2. Angel and its Group companies ownership of the stock
No
3. Angel and its Group companies' Directors ownership of the stock
No
4. Broking relationship with company covered
No
Note: We have not considered any Exposure below ` 1 lakh for Angel, its Group companies and Directors
Ratings (Based on expected returns
Buy (> 15%)
Accumulate (5% to 15%)
Neutral (-5 to 5%)
over 12 months investment period):
Reduce (-5% to -15%)
Sell (< -15)
January 27, 2016
9