4QFY2016 Result Update | Agrichemical
May 3, 2016
United Phosphorus
BUY
CMP
`595
Performance Highlights
Target Price
`684
Y/E March (` cr)
4QFY2016 3QFY2016
% chg (qoq) 4QFY2015
% chg (yoy)
Investment Period
12 Months
Net sales
4,292
3050
40.7
3563
20.5
Other income
120
131
(8.2)
16
652.3
Stock Info
Gross profit
2143
1652
29.7
1702
25.9
Sector
Agrichemical
Operating profit
927
579
60.0
711
30.3
Market Cap (` cr)
25,487
Adj. net profit
574
306
87.8
451
27.4
Net Debt (` cr)
1,113
Source: Company, Angel Research
Beta
1.1
52 Week High / Low
600/342
For 4QFY2016, United Phosphorus (UPL) posted sales of `4,292cr, up 20.5% yoy,
Avg. Daily Volume
143071
mainly led by 25% growth in volume and a 1% rise in price. The exchange rate
Face Value (`)
2
dipped by
6.0% during the quarter. In terms of geography, Latin America
BSE Sensex
25,437
(`1,428cr), Europe (`872cr), USA (`971cr), and India (`417cr) posted a yoy growth
Nifty
7,806
of 57%, 8%, 13% and 4%, respectively. The ROW region posted flat sales of
`652cr. On the operating front, strong sales growth led the gross margin to come
Reuters Code
UNPO.BO
in at 49.9% (V/s 47.8% in 4QFY2015), while the OPM came in at 21.6% (V/s
Bloomberg Code
UNTP@IN
20.0% in 4QFY2015). Thus, the Adj. net profit came in at `574cr (V/s `451cr in
4QFY2015), a yoy growth of 27.4%. We recommend a buy on the stock.
Shareholding Pattern (%)
Quarterly highlights: For 4QFY2016, United Phosphorus (UPL) posted sales of
Promoters
29.7
`4,292cr, up 20.5% yoy, mainly led by 25% growth in volume and a 1% rise in
MF / Banks / Indian Fls
15.0
price. The exchange rate dipped by
6.0% during the quarter. In terms of
FII / NRIs / OCBs
47.8
geography, Latin America (`1,428cr), Europe (`872cr), USA (`971cr), and India
Indian Public / Others
7.5
(`417cr) posted a yoy growth of 57%, 8%, 13% and 4%, respectively. The ROW
region posted flat sales of `652cr. On the operating front, strong sales growth led
the gross margin to come in at 49.9% (V/s 47.8% in 4QFY2015), while the OPM
Abs. (%)
3m 1yr
3yr
came in at 21.6% (V/s 20.0% in 4QFY2015). Thus, the Adj. net profit came in at
Sensex
3.7
(5.8)
28.9
`574cr (V/s `451cr in 4QFY2015), a yoy growth of 27.4%.
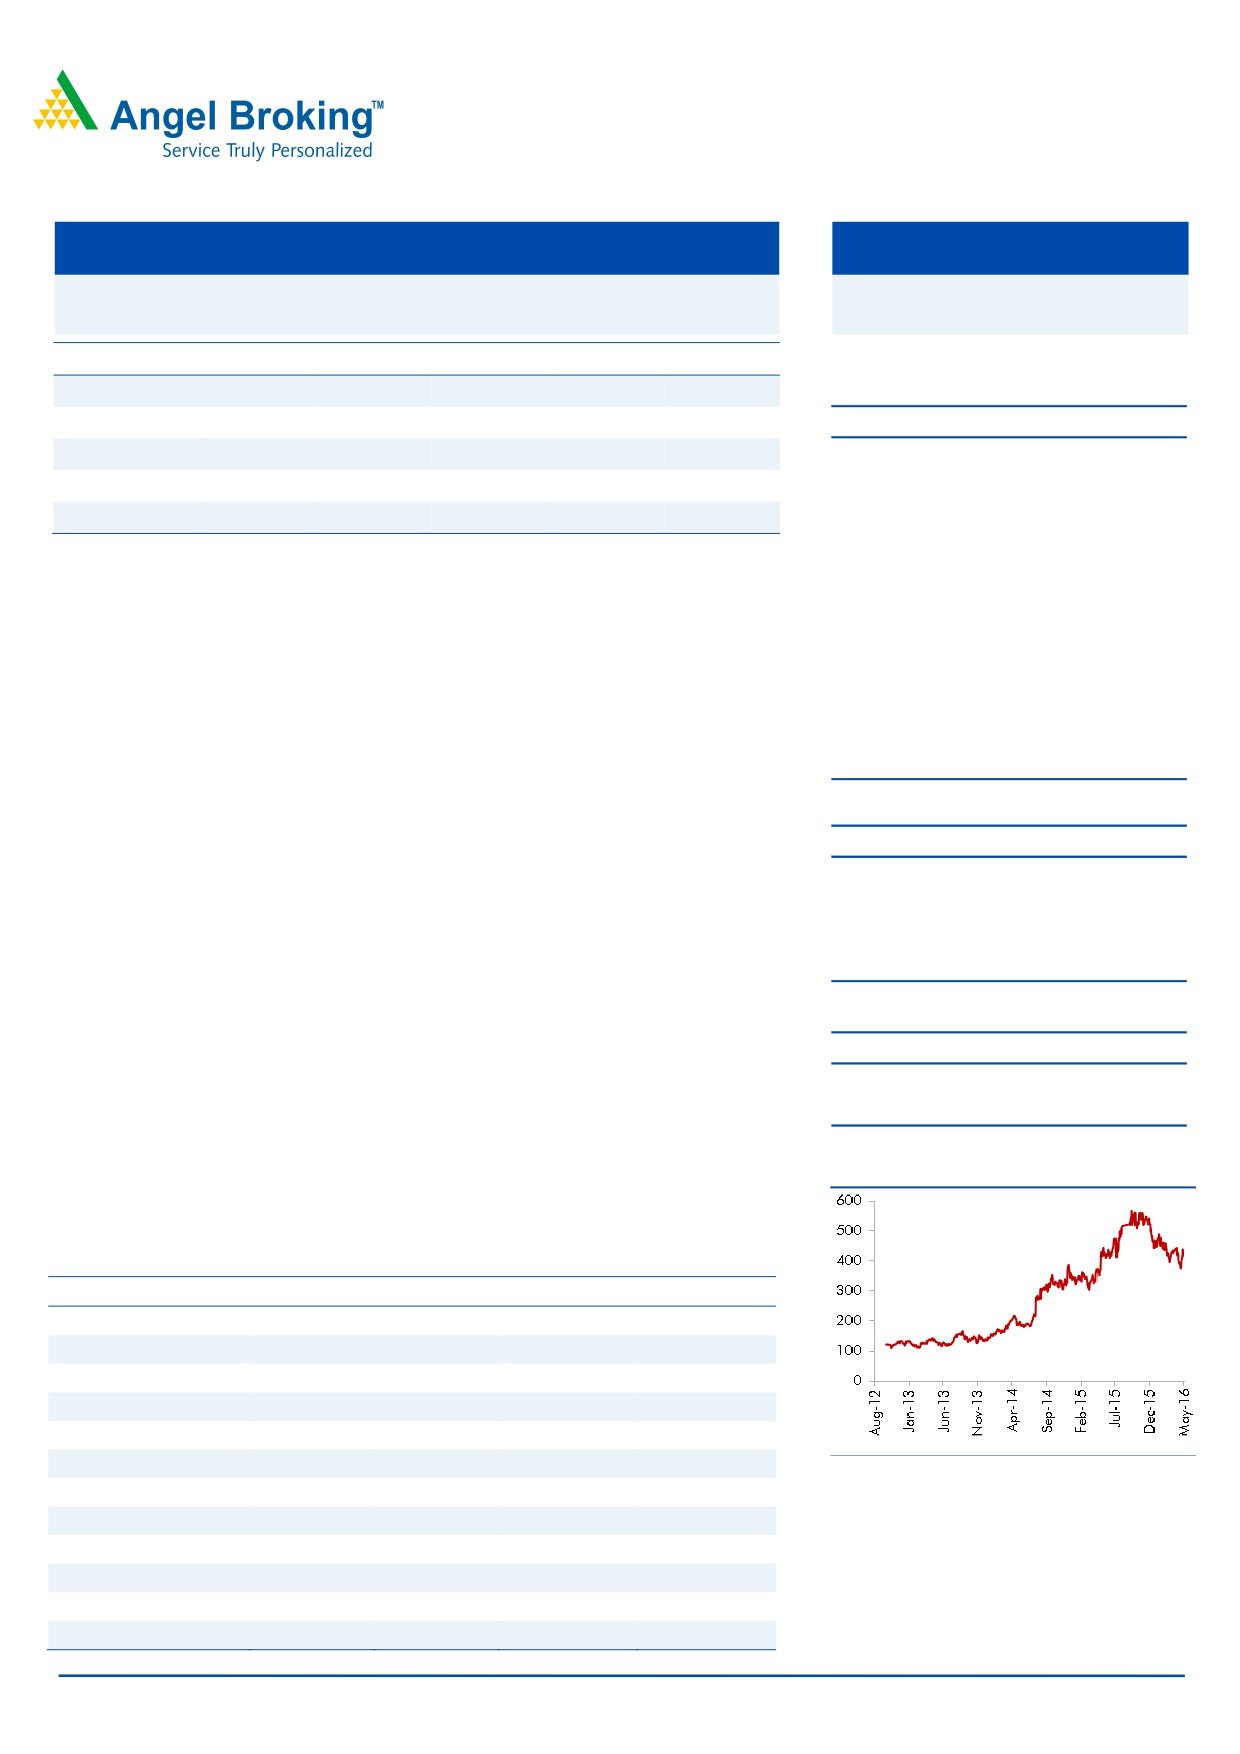
UPL
43.1
21.0
309.4
Outlook and valuation: We expect UPL to post a CAGR of 16.0% and 18.9% in
sales and PAT, respectively, over FY2016-18E. The Management has given its
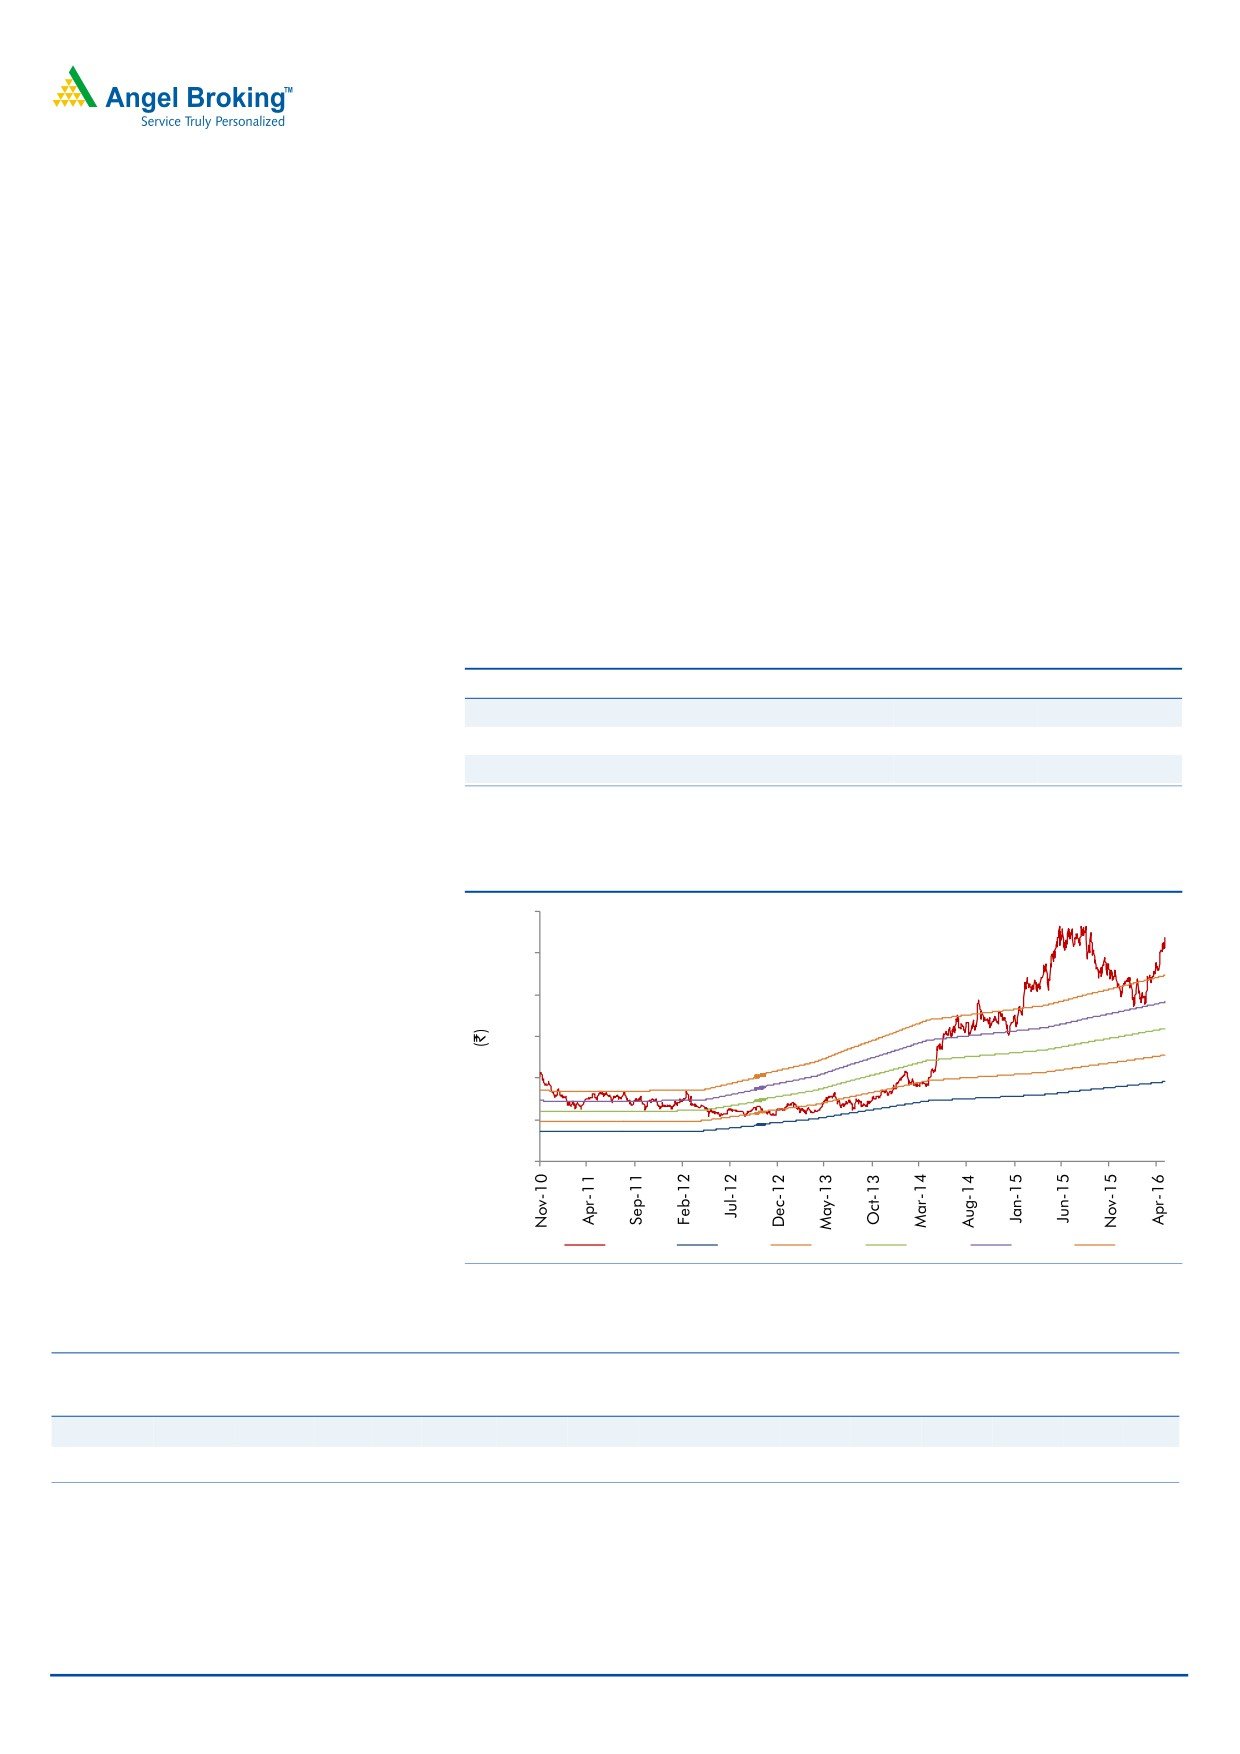
3-year price chart
guidance of 12-15% volume growth with 60-100bp margin expansion in FY2017. We
recommend a buy rating on the stock.
Key financials (Consolidated)
Y/E March (` cr)
FY2015
FY2016
FY2017E
FY2018E
Total revenue
11,911
13,083
15,176
17,604
% chg
12.6
9.8
16.0
16.0
Adj. profit
1,147
1,352
1,601
1,912
% chg
10.2
17.9
18.5
19.4
EBITDA (%)
18.3
18.5
18.5
18.5
EPS (`)
26.7
31.5
37.4
44.6
Source: Company, Angel Research
P/E (x)
22.2
18.9
15.9
13.3
P/BV (x)
4.3
3.8
3.1
2.6
RoE (%)
20.6
21.4
21.4
21.2
RoCE (%)
19.9
20.8
20.6
21.1
Sarabjit Kour Nangra
EV/Sales (x)
2.1
2.0
1.7
1.4
+91-22-3935 7800 ext. 6806
EV/EBITDA (x)
11.6
10.8
9.1
7.6
Source: Company, Angel Research; Note: CMP as of May 2, 2016
Please refer to important disclosures at the end of this report
1
United Phosphorus | 4QFY2016 Result Update
Exhibit 1: 4QFY2016 Performance (Consolidated)
Y/E March (` cr)
4QFY2016
3QFY2016
% chg (qoq)
4QFY2015
% chg (yoy) FY2016 FY2015
% chg
Net sales
4,292
3,050
40.7
3,563
20.5
13,083
11,911
9.8
Other income
120
131
(8.2)
16
652.3
383
177
117.0
Total income
4,413
3,181
38.7
3,579
23.3
13,466
12,088
11.4
Gross profit
2143
1652
29.7
1702
25.9
6671
5895
13.2
Gross margin (%)
49.9
54.2
47.8
51.0
49.5
Operating profit
927
579
60.0
711
30.3
2419
2175
11.2
Operating margin (%)
21.6
19.0
20.0
18.5
18.3
Financial cost
203
182
12.0
123
65.4
622
517
Depreciation
159
123
29.1
103
54.4
502
425
18.2
PBT
684
405
68.9
501
36.6
1679
1410
19.0
Provision for taxation
64
73
(11.5)
50
28.5
283
244
16.0
PAT Before Exc. And MI
620
333
86.4
451
37.5
1396
1166
19.7
Minority Income/ ( Exp.)
(8)
(8)
(3)
(13)
(43)
Income from Associate/ (Exp)
(35)
(14)
(8)
(31)
21
Extra ordinary Income/( Exp.)
(25)
(24)
0
(53)
(2)
Reported PAT
552
286
92.9
440
25.5
1299
1144
13.5
Adjusted PAT
574
306
87.8
451
27.4
1343
1146
17.2
EPS (`)
13.4
7.1
10.5
31.3
26.7
Source: Company, Angel Research
Top-line growth supported mainly by USA and Latin America
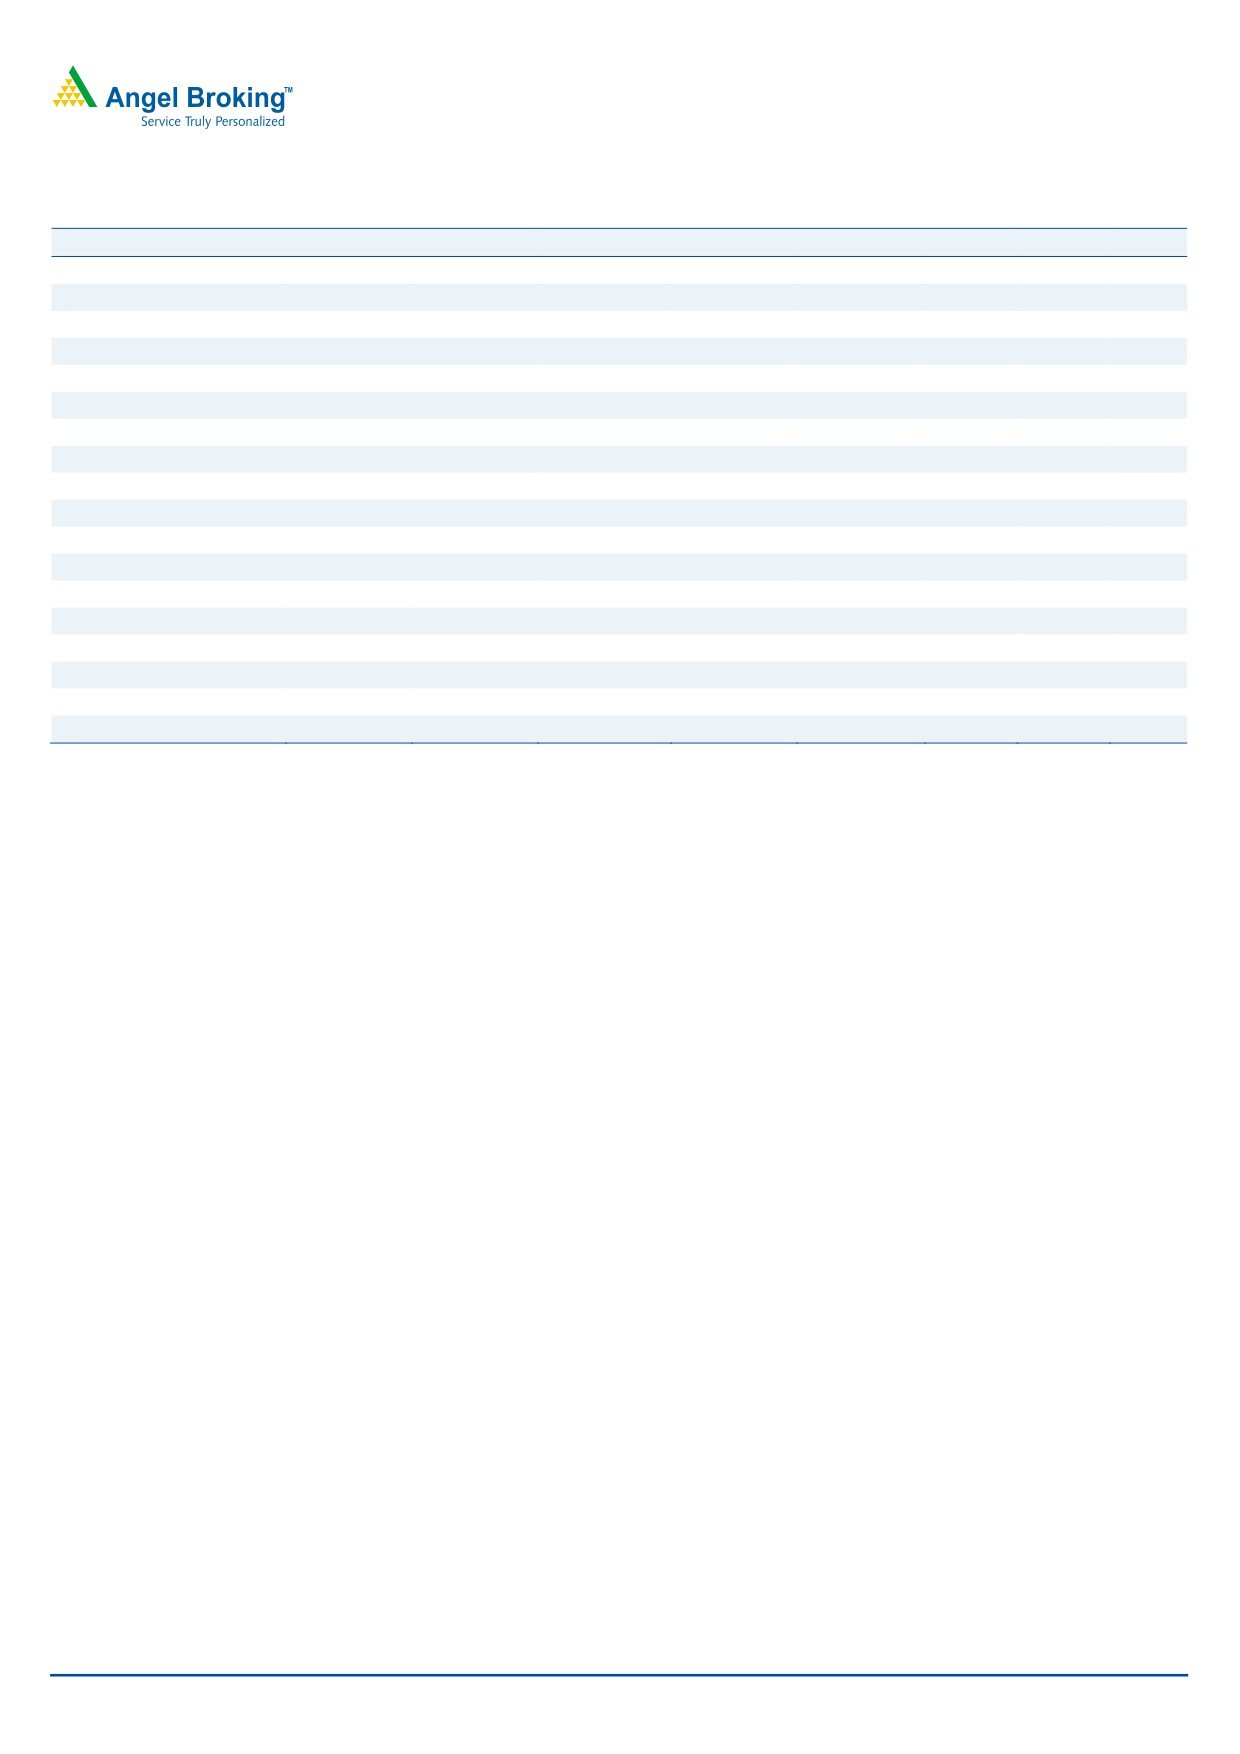
During the quarter, UPL posted a 20.5% yoy growth in sales to `4,292cr, mainly
boosted by 13% and 57% yoy growth in USA and Latin America, respectively.
Other key markets like India and Europe posted a growth of 4% and 8% yoy,
respectively. Overall growth was driven by price and volume growth of 1% and
25% respectively, while exchange had a weigh down effect by 6%.
India (`417cr) posted a 4% yoy rise on back of high acceptance of the company’s
insecticides. However, the revenue growth was subdued owing to serious drought
conditions affecting agrochemical usage, both in Kharif & Rabi crops. Channel
inventory continued, resulting in tight liquidity conditions in the market. Europe
(`872cr) posted a 8% yoy rise, benefitting from a mild winter and early spring;
however the North Europe suffered from a dry summer which affected the usage of
cereal fungicides.
Latin America (`1,428cr) posted a strong 57% yoy growth as farmers in Brazil and
Argentina benefitted from currency devaluation for their commodity exports. Ease
of export tax on agricultural commodities in Argentina further aided demand for
the company’s agrochemicals. UPL’s North America (`971cr) business registered a
13% yoy revenue growth, led by healthy demand for its newly launched products.
ROW (`652cr) remained flat. The company expects improved market access
through increased registrations in African countries. The company received an
excellent acceptance for its cotton portfolio in Pakistan, though consumption got
affected due to floods. The company expects North Africa and Iran to grow with US
lifting the economic embargo. In Turkey, significant citrus / berries crop damage
due to frost / hail storm affected fungicides consumption.
May 3, 2016
2
United Phosphorus | 4QFY2016 Result Update
Exhibit 2: Sales Break-up (Marketwise)
100%
923
80%
1,557
1,354
2,080
1,705
60%
505
804
358
40%
300
872
1,083
401
715
498
417
20%
862
971
553
594
374
0%
4QFY2015
1QFY2016
2QFY2016
3QFY2016
4QFY2016
North America
India
EU
Others
Source: Company
Exhibit 3: Sales performance (including export incentives)
Exhibit 4: Growth break-up
4,292
30
4,200
26
3,563
25
3,600
3,064
3,050
20
2,801
3,000
15
2,400
10
1,800
5
1
1,200
0
600
(5)
0
(10)
(6)
4QFY2015
1QFY2016
2QFY2016
3QFY2016
4QFY2016
Exchange impact
Realisation
Volume
Source: Company, Angel Research
Source: Company, Angel Research
Exhibit 5: Volume and realisation break-up (yoy)
30
26
25
18
20
16
15
13
11
10
5
2
3
1
0
0
(2)
(5)
4QFY2015
1QFY2016
2QFY2016
3QFY2016
4QFY2016
Realisation
Volume
Source: Company, Angel Research
May 3, 2016
3
United Phosphorus | 4QFY2016 Result Update
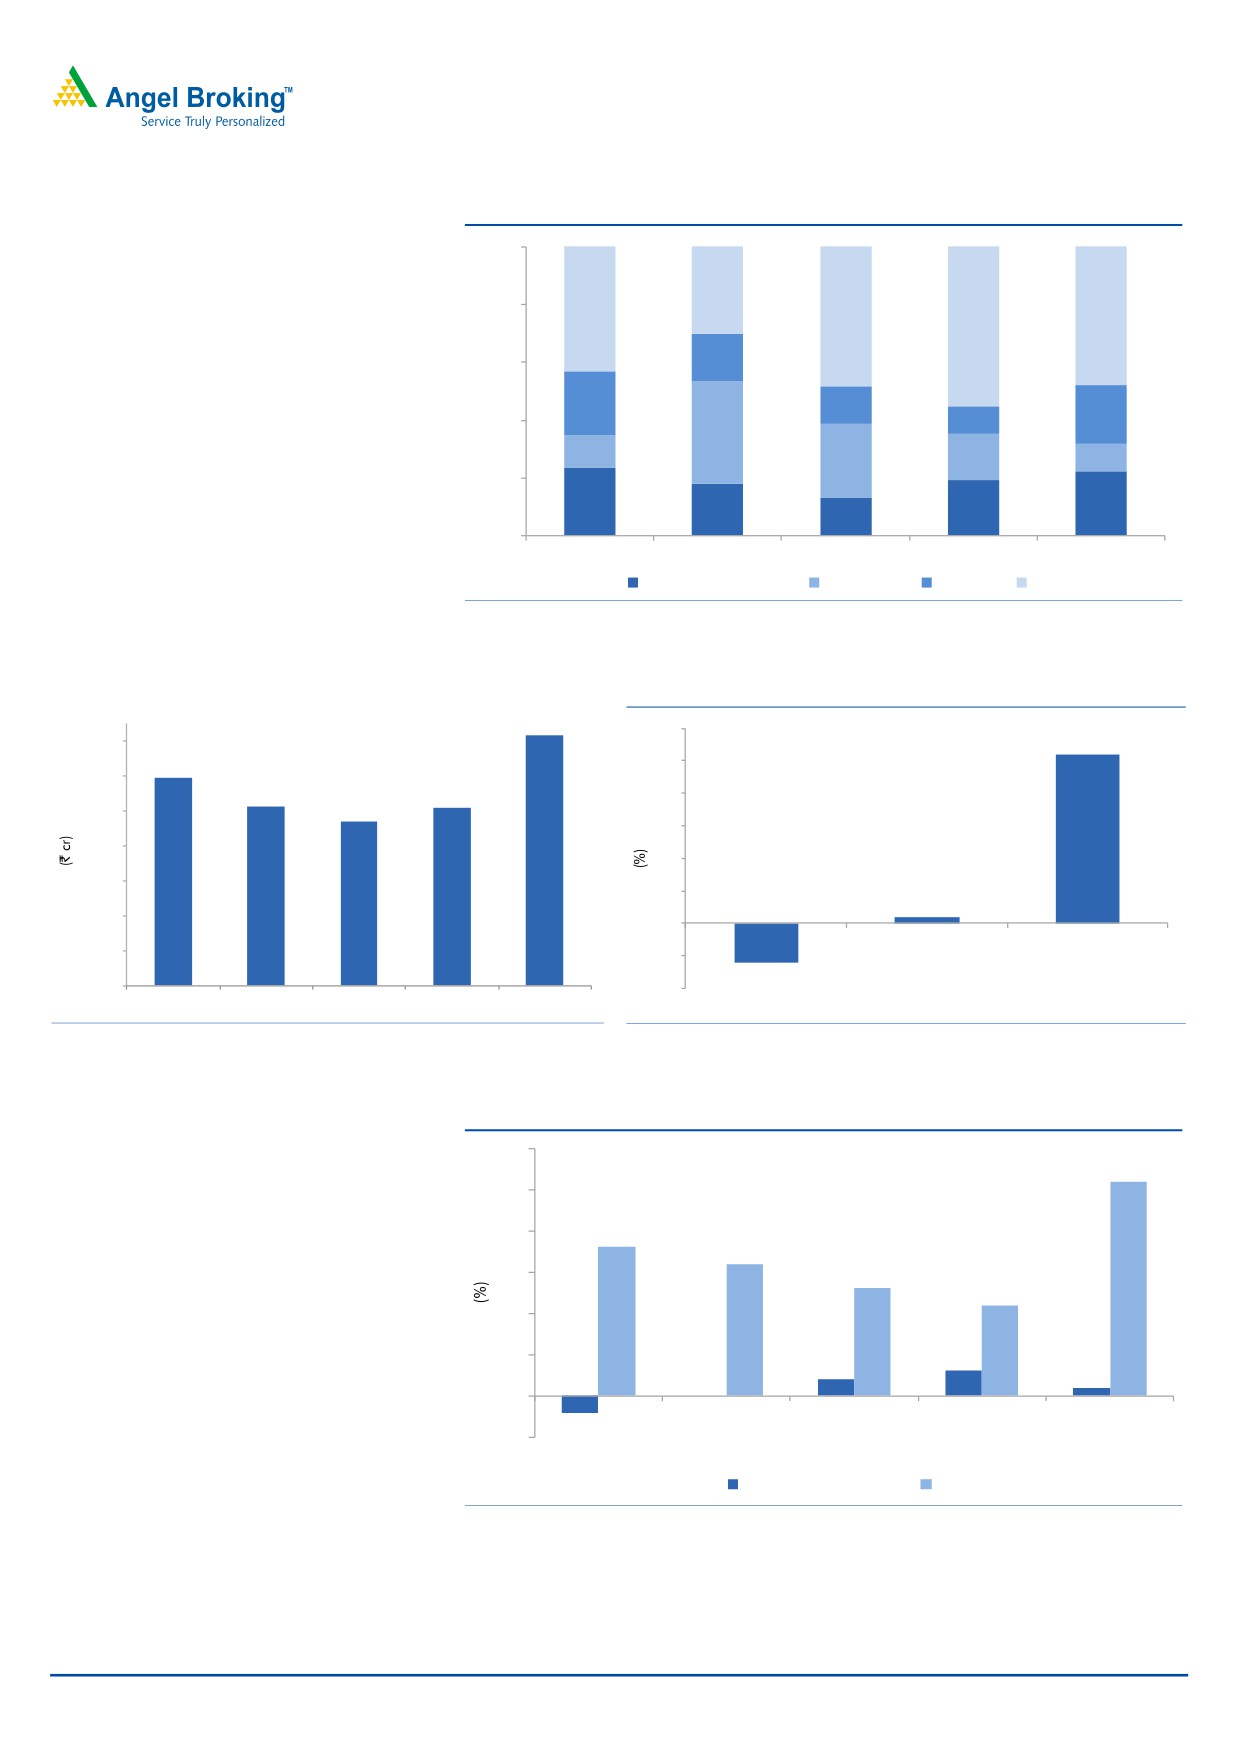
EBITDA margin improves
On the operating front, strong sales growth led the gross margin to come in at
49.9% V/s (47.8% in 4QFY2015) and the OPM to come in at 21.6% (V/s 20.0% in
4QFY2015) (supported by healthy volume growth and price rise).
Exhibit 6: EBITDA margin trend
25.0
24.0
23.0
22.0
21.0
21.6
20.0
20.0
19.0
19.0
18.0
17.0
17.3
16.0
16.5
15.0
4QFY2015
1QFY2016
2QFY2016
3QFY2016
4QFY2016
Source: Company, Angel Research
Adj net profit grew 27.4% yoy
A strong top-line and operating performance aided the Adj. net profit to come in
at `574cr V/s `451cr in 4QFY2015, a growth of 27.4% yoy. Other income during
the quarter came in at `120cr V/s `16cr in 4QFY2015, a yoy growth of 652.3%.
Exhibit 7: Adjusted PAT trend
700
30
574
600
25
500
451
20
400
306
15
285
300
190
10
200
5
100
0
0
4QFY2015
1QFY2016
2QFY2016
3QFY2016
4QFY2016
Adj PAT
% YoY
Source: Company, Angel Research
May 3, 2016
4
United Phosphorus | 4QFY2016 Result Update
Concall Highlights
The company targets a revenue growth of 12-15% (at constant currency) for
FY2017 on the back of volumes. It expects EBITDA margin to improve 60-
100bp, driven by improvement in gross margins.
The company is targeting a RoCE of 23-25% over the next 3-5 years. It plans
to invest `850cr including on product registrations.
UPL attained an innovation rate (contribution of products launched in the last
5 years) of ~14% in FY2016 (v/s 5% in FY2015 and v/s 2.5% in FY2014). It is
targeting to attain ~15% in FY2017. In India business, 28-29% of revenues
come from innovative products.
UPL’s LatAm business grew by ~25% as against 18-20% decline for the
industry, driven by new product launches. It applied for
~20 product
registrations in CY2015 and plans for another ~20 registrations in CY2016.
Hence, it expects strong growth in LatAm to continue.
UPL continued to gain market share in the global agro-chemical industry.
While its revenues grew ~10% in FY2016 (~18% on constant currency basis),
global industry declined by ~9.6% in CY2015.
Investment arguments
Innovators dominant in the off-patent space; Generic firms in
a sweet spot
The global agrichem industry, valued at US$53bn (CY2014), is dominated by the
top six innovators, viz Bayer, Syngenta, Monsanto, BASF, DuPont and Dow, which
enjoy a large market share of the patented (28%) and off-patent (32%) market.
The top six innovators enjoy a large share of the off-patent market due to high
entry barriers for pure generic players. Thus, one-third of the total pie worth
US$18bn, which is controlled by the top six innovators through proprietary
off-patent products, provides a high-growth opportunity for larger integrated
generic players like UPL.
Generic segment’s market share to increase
Generic players have been garnering a high market share; their share has
increased from 32% levels in 1998 to 40% by 2006-end. The industry registered a
CAGR of 3% over 1998-2006, while generic players outpaced the industry with a
CAGR of 6%. Going ahead, given the opportunities and a drop in the rate of new
molecule introduction by innovators, we expect generic players to continue to
outpace the industry’s growth rate and augment their market share in the overall
pie. Historically, global agrichem players have been logging in-line growth with
global GDP. Going ahead, over CY2016-17, the global economy is expected to
grow by 2-3%. Assuming this trend plays out in terms of growth for the agrichem
industry, and the same rate of genericisation occurs, then the agrichemical generic
industry could log in 6-8% yoy growth during the period and garner a market
share of 44-45%.
May 3, 2016
5
United Phosphorus | 4QFY2016 Result Update
A global generic play
UPL figures among the top five global generic agrichemical players with presence
across major markets including the US, EU, Latin America, and India. Given the
high entry barriers by way of high investments, entry of new players is restricted.
Thus, amidst this scenario and on account of having a low-cost base,
we believe UPL enjoys an edge over competition and is placed in a sweet spot to
leverage the upcoming opportunities in the global generic space.
May 3, 2016
6
United Phosphorus | 4QFY2016 Result Update
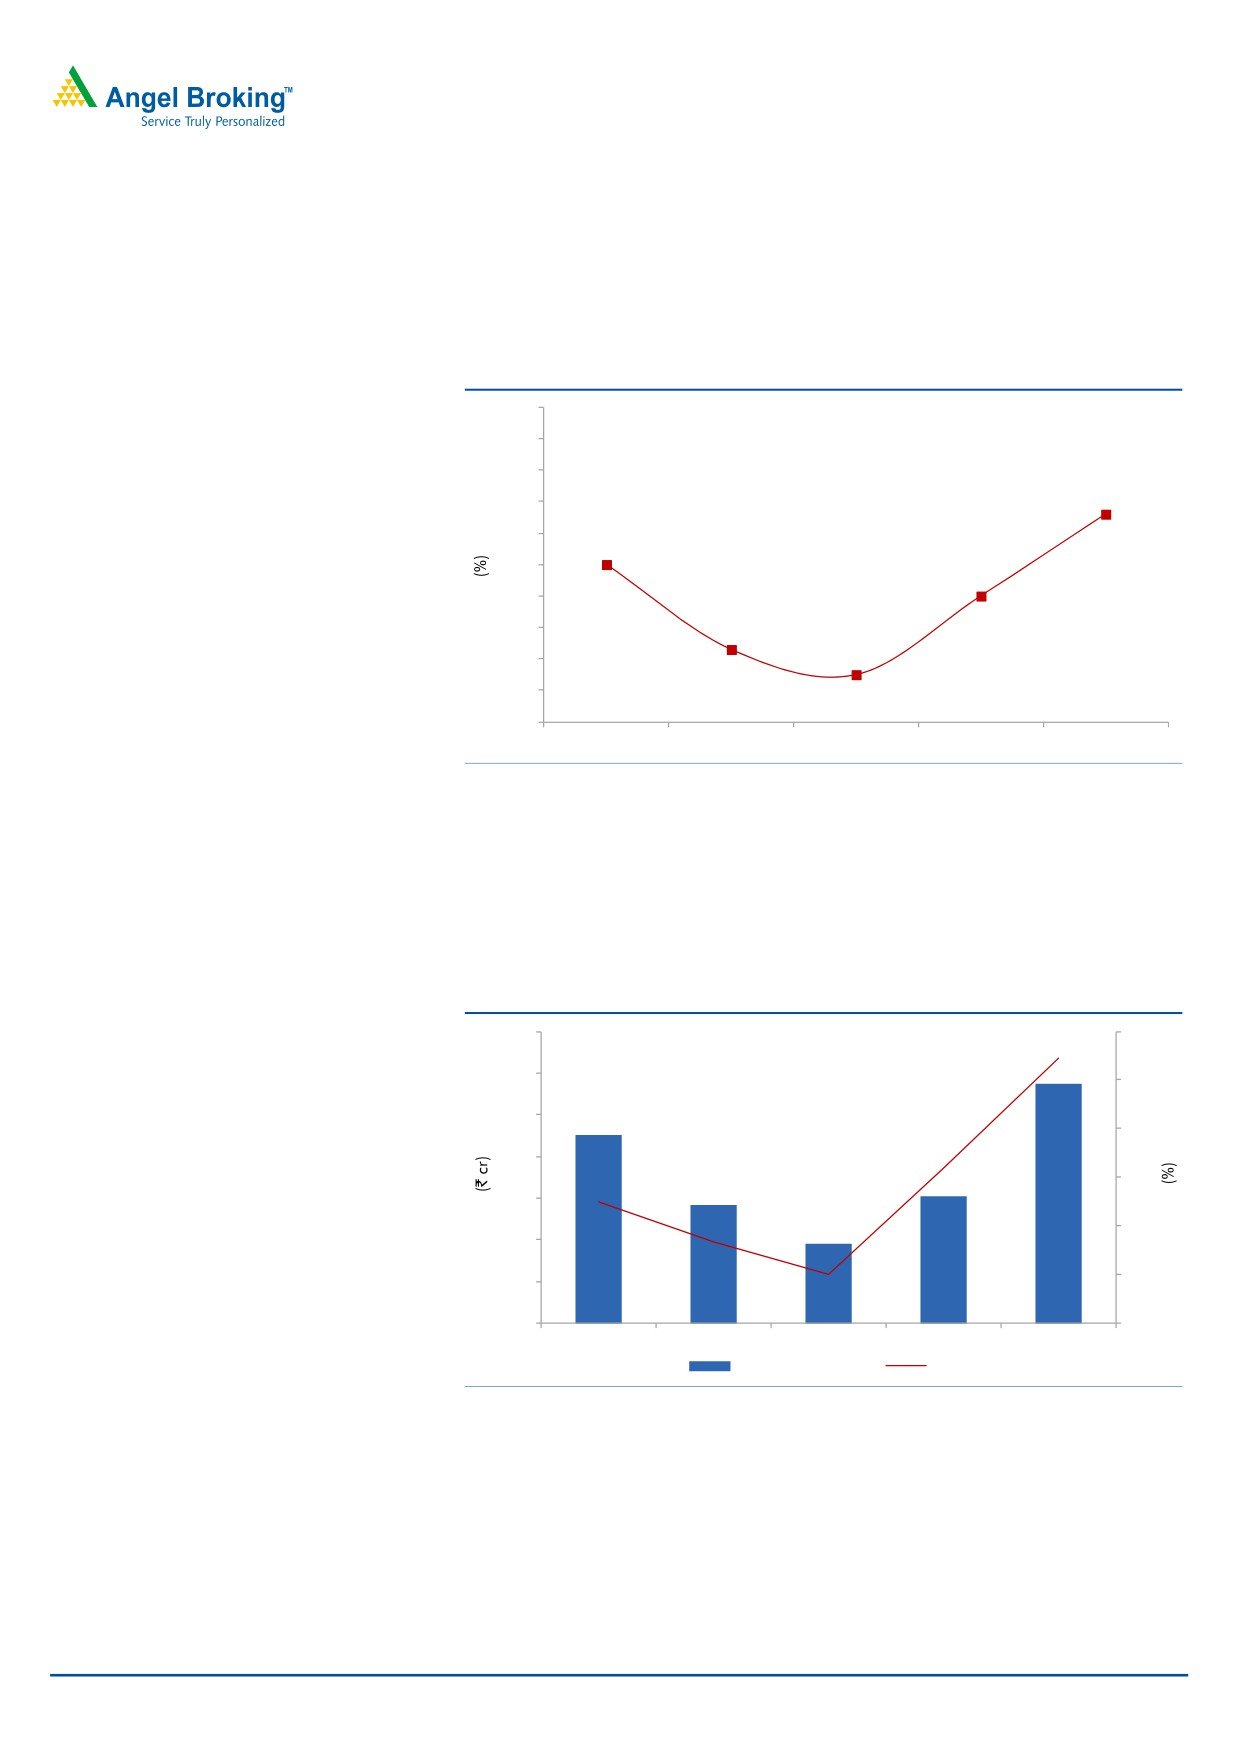
Outlook and valuation
Over the last few years, the global agriculture sector has been reviving on the back
of rising food prices. Food security is also a top priority for most governments;
reducing food loss is one of the easiest ways to boost food inventory. Hence, we
believe agrichemical companies would continue to do well in the wake of
heightened food security risks, and strong demand is likely to be witnessed across
the world. Overall, we expect the global agrichemical industry to perform well
from here on. Generics are expected to register a healthy growth due to a)
increasing penetration and wresting market share from innovators and b) patent
expiries worth US$3bn-4bn during the next five years.
We estimate UPL to post a 16.0% and 18.9% CAGR in sales and PAT, respectively,
over FY2016-18E. We believe at the current market price the stock provides decent
upsides (13.3x FY2018E EPS). Hence we recommend a buy rating on the stock.
Exhibit 8: Key assumption
FY2017E
FY2018E
Sales growth
16.0
16.0
EBITDA margin
18.5
19.4
Tax rate
20.0
20.0
Source: Company, Angel Research
Exhibit 9: P/E band
600
500
400
300
200
100
0
Price
6x
8x
10x
12x
14x
Source: Company, Angel Research
Exhibit 10: Peer valuation
Company Reco
Mcap CMP TP Upside
P/E (x)
EV/Sales (x)
EV/EBITDA (x)
RoE (%)
CAGR (%)
(` cr)
(`)
(`)
(%) FY17E FY18E FY17E FY18E FY17E FY18E FY17E FY18E Sales PAT
Rallis
Neutral
3,817
196
-
-
21.7
17.8
2.2
1.9
16.4
13.3
18.4
19.8
15.0
22.3
UPL
Buy
25,487
595
684
15.0
15.9
13.3
1.7
1.4
9.1
7.6
21.4
21.2
16.0
18.9
Source: Company, Angel Research, Bloomberg
May 3, 2016
7
United Phosphorus | 4QFY2016 Result Update
Company background
United Phosphorus (UPL) is a global generic crop protection, chemicals and seeds
company. The company is fully backward and forward integrated by taking
advantage of the consolidation opportunities within the agrochemical industry. UPL
is the largest Indian agrochemical company and had revenue of about `13,083cr
for the year ended March 2016.
Profit & Loss Statement (Consolidated)
Y/E March (` cr)
FY2013
FY2014
FY2015
FY2016
FY2017E
FY2018E
Net Sales
9,010
10,580
11,911
13,083
15,176
17,604
Other operating income
184
191
45
219
219
219
Total operating income
9,195
10,771
11,956
13,302
15,395
17,823
% chg
19.9
17.1
11.0
11.3
15.7
15.8
Total Expenditure
7,568
8,751
9,736
10,663
12,369
14,349
Net Raw Materials
4,687
5,441
6,016
6,411
7,437
8,627
Other Mfg costs
741
942
980
1,164
1,351
1,567
Personnel
853
946
1,043
1,224
1,420
1,647
Other
1,287
1,422
1,697
1,864
2,162
2,508
EBITDA
1,442
1,829
2,175
2,419
2,806
3,255
% chg
19.6
26.8
19.0
11.2
16.0
16.0
(% of Net Sales)
16.0
17.3
18.3
18.5
18.5
18.5
Depreciation& Amortisation
354
407
425
502
573
629
EBIT
1,273
1,613
1,796
2,137
2,452
2,845
% chg
21.1
26.7
11.4
19.0
14.8
16.0
(% of Net Sales)
13.8
15.0
15.0
16.1
15.9
16.0
Interest & other Charges
429
487
517
622
502
502
Other Income
73
131
131
112
112
112
(% of PBT)
8
10
9
7
5
5
Recurring PBT
917
1,257
1,410
1,626
2,062
2,455
% chg
25.0
37.1
12.2
15.3
26.8
19.1
Extraordinary Expense/(Inc.)
27
85
(2)
(53)
-
-
PBT (reported)
944
1,172
1,413
1,679
2,062
2,455
Tax
203
222
244
283
412
491
(% of PBT)
21.5
18.9
17.3
16.9
20.0
20.0
PAT (reported)
741
950
1,169
1,396
1,649
1,964
Add: Share of earnings of asso.
32
30
21
(31)
(35)
(39)
Less: Minority interest (MI)
(2)
7
43
13
13
13
Prior period items
-
24
-
-
-
-
PAT after MI (reported)
775
950
1,144
1,299
1,601
1,912
ADJ. PAT
754
1,040
1,147
1,352
1,601
1,912
% chg
34.3
38.0
10.2
17.9
18.5
19.4
(% of Net Sales)
8.4
9.8
9.6
10.3
10.6
10.9
Basic EPS (`)
17.0
24.3
26.7
31.5
37.4
44.6
Fully Diluted EPS (`)
17.0
24.3
26.7
31.5
37.4
44.6
% chg
40.1
42.5
10.2
17.9
18.5
19.4
May 3, 2016
8
United Phosphorus | 4QFY2016 Result Update
Balance Sheet (Consolidated)
Y/E March (` cr)
FY2013
FY2014
FY2015
FY2016
FY2017E
FY2018E
SOURCES OF FUNDS
Equity Share Capital
89
86
86
86
86
86
Preference Capital
-
-
-
-
-
-
Reserves& Surplus
4,557
5,162
5,775
6,705
8,092
9,790
Shareholders’ Funds
4,645
5,247
5,860
6,791
8,178
9,875
Minority Interest
234
172
44
42
55
68
Total Loans
4,203
2,873
2,781
3,860
3,860
3,860
Other Long term liab.
395
311
594
464
464
464
Long Term Provisions
51
53
53
53
53
53
Deferred Tax Liability
(13)
57
45
(5)
(5)
(5)
Total Liabilities
9,516
8,714
9,378
11,205
12,605
14,315
APPLICATION OF FUNDS
Gross Block
5,386
6,039
6,792
7,791
8,591
9,391
Less: Acc. Depreciation
3,173
3,580
4,005
4,507
5,080
5,709
Net Block
2,213
2,459
2,787
3,285
3,511
3,682
Capital Work-in-Progress
378
378
378
378
378
378
Goodwill / Intangilbles
1,277
1,212
1,449
1,463
1,463
1,463
Investments
1,025
737
764
1,066
1,066
1,066
Long Term Loan & Adv.
277
389
418
537
532
618
Current Assets
7,154
7,572
8,372
10,069
11,756
14,187
Cash
1,548
1,023
1,010
1,068
1,688
2,508
Loans & Advances
852
771
586
840
1,435
1,664
Other
4,754
5,779
6,776
8,162
8,633
10,015
Current liabilities
2,807
4,033
4,789
5,593
6,102
7,078
Net Current Assets
4,346
3,539
3,582
4,476
5,654
7,109
Others
-
-
-
-
-
-
Total Assets
9,516
8,714
9,378
11,205
12,605
14,315
May 3, 2016
9
United Phosphorus | 4QFY2016 Result Update
Cash Flow Statement (Consolidated)
Y/E March (` cr)
FY2013 FY2014 FY2015 FY2016 FY2017E FY2018E
Profit before tax
944
1,172
1,413
1,679
2,062
2,455
Depreciation
354
407
425
502
573
629
Change in Working Capital
(806)
171
(86)
(955)
(553)
(720)
Less: Other income
-
-
-
-
-
-
Direct taxes paid
(203)
(222)
(244)
(283)
(412)
(491)
Cash Flow from Operations
288
1,528
1,508
942
1,670
1,873
(Inc.)/ Dec. in Fixed Assets
(771)
(653)
(753)
(1,000)
(800)
(800)
(Inc.)/ Dec. in Investments
(231)
-
-
-
-
-
Inc./ (Dec.) in loans and adv.
-
-
-
-
-
-
Other income
-
-
-
-
-
-
Cash Flow from Investing
(1,002)
(653)
(753)
(1,000)
(800)
(800)
Issue of Equity
-
(3)
-
-
-
-
Inc./(Dec.) in loans
(908)
1,413
(192)
(949)
0
0
Dividend Paid (Incl. Tax)
(129)
(201)
(214)
(214)
(214)
(214)
Others
1,733
(2,612)
(362)
1,278
(35)
(39)
Cash Flow from Financing
696
(1,403)
(768)
115
(249)
(253)
Inc./(Dec.) in Cash
(18)
(525)
(13)
58
620
820
Opening Cash balances
1,566
1,548
1,023
1,010
1,068
1,688
Closing Cash balances
1,548
1,023
1,010
1,068
1,688
2,508
May 3, 2016
10
United Phosphorus | 4QFY2016 Result Update
Key Ratios
Y/E March
FY2013
FY2014
FY2015
FY2016
FY2017E
FY2018E
Valuation Ratio (x)
P/E (on FDEPS)
34.9
24.5
22.2
18.9
15.9
13.3
P/CEPS
23.8
17.6
16.2
13.8
11.7
10.0
P/BV
5.7
4.9
4.3
3.8
3.1
2.6
Dividend yield (%)
0.4
0.4
0.4
0.4
0.4
0.4
EV/Sales
2.9
2.4
2.1
2.0
1.7
1.4
EV/EBITDA
18.0
13.9
11.6
10.8
9.1
7.6
EV / Total Assets
2.7
2.9
2.7
2.3
2.0
1.7
Per Share Data (`)
EPS (Basic)
17.0
24.3
26.7
31.5
37.4
44.6
EPS (fully diluted)
17.0
24.3
26.7
31.5
37.4
44.6
Cash EPS
25.0
33.8
36.7
43.2
50.7
59.3
DPS
2.5
2.5
2.5
2.5
2.5
2.5
Book Value
105.0
122.4
136.7
158.4
190.8
230.4
DuPont Analysis
EBIT margin
13.8
15.0
15.0
16.1
15.9
16.0
Tax retention ratio
78.5
81.1
82.7
83.1
80.0
80.0
Asset turnover (x)
1.4
1.5
1.6
1.6
1.6
1.7
ROIC (Post-tax)
15.4
18.5
20.3
21.0
20.4
21.8
Cost of Debt (Post Tax)
8.9
11.2
15.1
15.6
10.4
10.4
Leverage (x)
0.5
0.5
0.3
0.4
0.3
0.2
Operating ROE
18.6
21.9
22.0
22.9
23.8
24.1
Returns (%)
ROCE (Pre-tax)
14.4
17.7
19.9
20.8
20.6
21.1
Angel ROIC (Pre-tax)
20.0
23.2
24.7
25.6
25.9
27.6
ROE
17.1
21.0
20.6
21.4
21.4
21.2
Turnover ratios (x)
Asset Turnover (Gross Block)
1.8
1.9
1.9
1.8
1.9
2.0
Inventory / Sales (days)
78
83
86
86
84
84
Receivables (days)
102
83
86
86
84
84
Payables (days)
108
69
72
73
71
71
WCcycle (ex-cash) (days)
96
92
78
83
89
89
Solvency ratios (x)
Net debt to equity
0.4
0.6
0.4
0.3
0.4
0.3
Net debt to EBITDA
1.5
1.8
1.0
0.8
1.2
0.8
Interest Coverage (EBIT / Int.)
3.0
3.3
3.5
3.4
4.9
5.7
May 3, 2016
11
United Phosphorus | 4QFY2016 Result Update
Research Team Tel: 022 - 39357800
DISCLAIMER
Angel Broking Private Limited (hereinafter referred to as “Angel”) is a registered Member of National Stock Exchange of India Limited,
Bombay Stock Exchange Limited and Metropolitan Stock Exchange of India Limited. It is also registered as a Depository Participant with
CDSL and Portfolio Manager with SEBI. It also has registration with AMFI as a Mutual Fund Distributor. Angel Broking Private Limited is
a registered entity with SEBI for Research Analyst in terms of SEBI (Research Analyst) Regulations, 2014 vide registration number
INH000000164. Angel or its associates has not been debarred/ suspended by SEBI or any other regulatory authority for accessing
/dealing in securities Market. Angel or its associates including its relatives/analyst do not hold any financial interest/beneficial
ownership of more than 1% in the company covered by Analyst. Angel or its associates/analyst has not received any compensation /
managed or co-managed public offering of securities of the company covered by Analyst during the past twelve months. Angel/analyst
has not served as an officer, director or employee of company covered by Analyst and has not been engaged in market making activity
of the company covered by Analyst.
This document is solely for the personal information of the recipient, and must not be singularly used as the basis of any investment
decision. Nothing in this document should be construed as investment or financial advice. Each recipient of this document should
make such investigations as they deem necessary to arrive at an independent evaluation of an investment in the securities of the
companies referred to in this document (including the merits and risks involved), and should consult their own advisors to determine
the merits and risks of such an investment.
Reports based on technical and derivative analysis center on studying charts of a stock's price movement, outstanding positions and
trading volume, as opposed to focusing on a company's fundamentals and, as such, may not match with a report on a company's
fundamentals.
The information in this document has been printed on the basis of publicly available information, internal data and other reliable
sources believed to be true, but we do not represent that it is accurate or complete and it should not be relied on as such, as this
document is for general guidance only. Angel Broking Pvt. Limited or any of its affiliates/ group companies shall not be in any way
responsible for any loss or damage that may arise to any person from any inadvertent error in the information contained in this report.
Angel Broking Pvt. Limited has not independently verified all the information contained within this document. Accordingly, we cannot
testify, nor make any representation or warranty, express or implied, to the accuracy, contents or data contained within this document.
While Angel Broking Pvt. Limited endeavors to update on a reasonable basis the information discussed in this material, there may be
regulatory, compliance, or other reasons that prevent us from doing so.
This document is being supplied to you solely for your information, and its contents, information or data may not be reproduced,
redistributed or passed on, directly or indirectly.
Neither Angel Broking Pvt. Limited, nor its directors, employees or affiliates shall be liable for any loss or damage that may arise from
or in connection with the use of this information.
Note: Please refer to the important ‘Stock Holding Disclosure' report on the Angel website (Research Section). Also, please refer to the
latest update on respective stocks for the disclosure status in respect of those stocks. Angel Broking Pvt. Limited and its affiliates may
have investment positions in the stocks recommended in this report.
Disclosure of Interest Statement
UPL
1. Analyst ownership of the stock
No
2. Angel and its Group companies ownership of the stock
No
3. Angel and its Group companies' Directors ownership of the stock
No
4. Broking relationship with company covered
No
Note: We have not considered any Exposure below ` 1 lakh for Angel, its Group companies and Directors
Ratings (Based on expected returns
Buy (> 15%)
Accumulate (5% to 15%)
Neutral (-5 to 5%)
over 12 months investment period):
Reduce (-5% to -15%)
Sell (< -15)
May 3, 2016
12