2QFY2016 Result Update | Educational Services
November 10, 2015
Tree House Education & Accessories
BUY
CMP
`249
Performance Highlights
Target Price
`314
Y/E March (` cr)
2QFY16 2QFY15
% chg (qoq) 1QFY16
% chg (yoy)
Investment Period
12 Months
Net sales
57
50
15.1
69
(17.1)
EBITDA
30.2
30
1.5
41
(26.4)
Stock Info
Sector
Educational Services
EBITDA Margin (%)
52.7
59.7
(700bp)
59.4
(670bp)
Adjusted PAT
13
13
1.2
18
(29.3)
Market Cap (` cr)
1,052
Source: Company, Angel Research
Net Debt
(66.8)
Beta
0.8
Tree House Education & Accessories (THEAL)’ 2QFY2016 results underperformed
52 Week High / Low
548 / 246
our estimates on all parameters. The top-line growth was decent mainly due to
Avg. Daily Volume
10,782
strong addition of 73 new pre-schools. On the operating profit front, the
Face Value (`)
10
company reported flattish growth yoy which resulted into lower growth in
profitability.
BSE Sensex
26,121
Nifty
7,915
Top-line grew ~15% yoy: The company’s top-line grew ~15% yoy to ~`57cr,
Reuters Code
THEA.BO
mainly due to growth in existing pre-schools and addition of new pre-schools. The
Bloomberg Code
THEAL.IN
company added
73 pre-schools in various cities like Ahmednagar, Goa,
Gurgaon, Jalgaon, Noida, and Ratnagiri, during the quarter.
Shareholding Pattern (%)
Poor operating performance drags down Net profit growth: The operating profit came
Promoters
30.0
in at ~`30cr, up ~2% yoy. However, operating margins contracted by 700bp yoy
MF / Banks / Indian Fls
3.5
to 52.7%, as the company opened 73 new centres during the quarter, which is the
FII / NRIs / OCBs
21.3
highest ever in the history of the company in a single quarter. The reported net
profit grew by only ~1% yoy to ~`13cr, due to the poor operating performance.
Indian Public / Others
45.2
Outlook and Valuation: We continue to remain positive on the stock, as we
Abs.(%)
3m 1yr 3yr
believe THEAL will continue to register robust growth going ahead. The growth
Sensex
(7.5)
(6.3)
39.8
would come on the back of consistent expansion of pre-schools and repayment of
debt which would boost earnings. We expect the company to report a CAGR of
THEAL
(37.5)
(44.7)
10.7
~23% in the top-line and ~21% in the bottom-line over FY2015-17E. We
recommend a Buy rating on the stock, with a target price of `314.
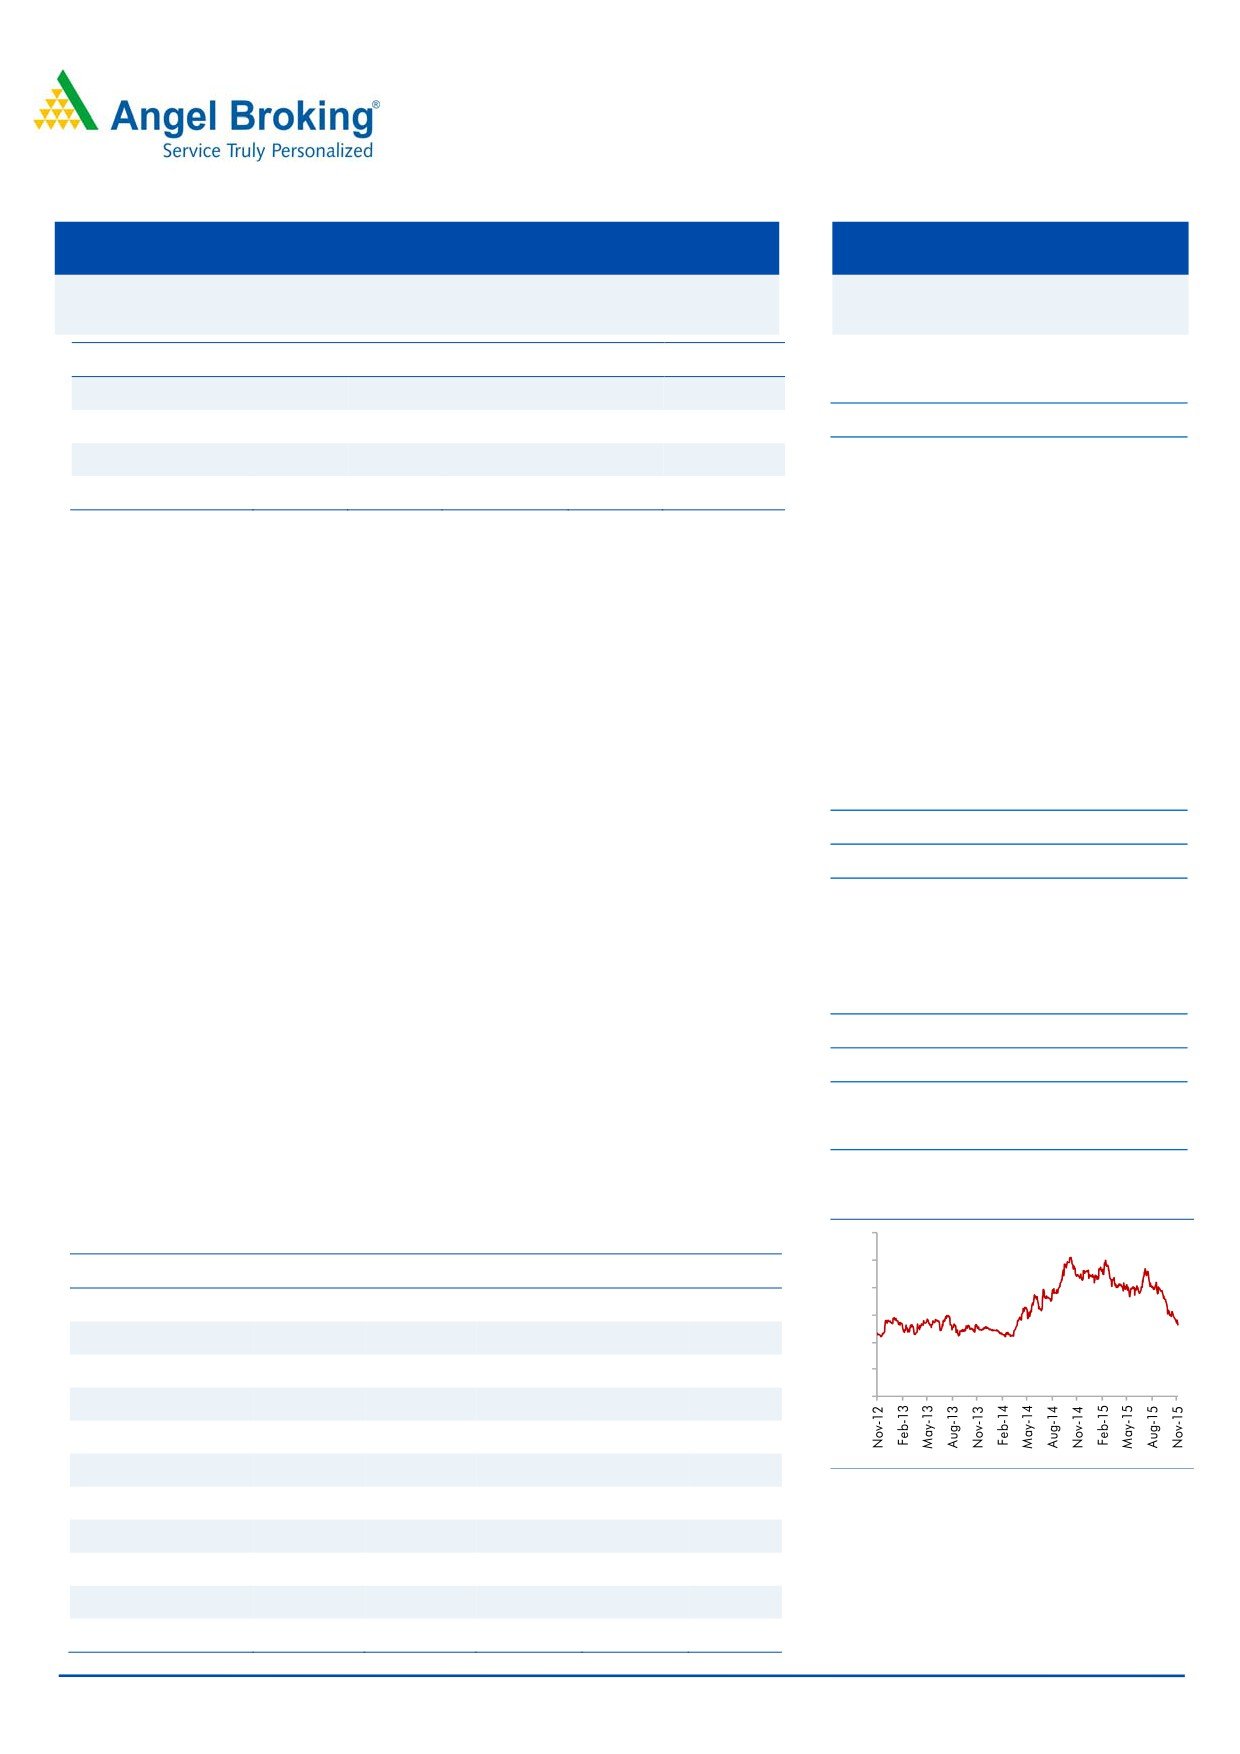
3 year daily price chart
600
Key Financials
500
Y/E March (` cr)
FY2013
FY2014E
FY2015
FY2016E FY2017E
400
Net Sales
114
158
207
256
315
300
% chg
48.0
37.9
31.6
23.4
23.2
200
Net Profit
33
44
61
70
89
100
0
% chg
53.9
31.8
38.6
14.7
27.0
EBITDA Margin (%)
54.1
56.6
57.2
57.2
57.5
FDEPS (`)
7.9
10.4
14.4
16.5
21.0
Source: Company, Angel Research
P/E (x)
31.6
24.0
17.3
15.1
11.9
P/BV (x)
3.1
2.6
1.6
1.5
1.3
RoE (%)
9.7
11.0
9.3
9.6
10.9
Amarjeet S Maurya
RoCE (%)
11.8
14.9
12.0
12.7
14.5
+91 22 39357800 Ext: 6831
EV/Sales (x)
9.3
7.1
4.8
4.2
3.6
Source: Company, Angel Research; Note: CMP as of November 9, 2015
Please refer to important disclosures at the end of this report
1
Tree House | 2QFY2016 Result Update
Exhibit 1: 2QFY2016 performance highlights
Y/E March (` cr)
2QFY16
2QFY15
% yoy
1QFY16
% qoq
1HFY16
1HFY15
% chg
Net Sales
57
50
15.1
69
(17.1)
126
104
21.8
Staff Costs
8
6
28.0
6
20.6
14
11
27.4
(% of Sales)
13.4
12.1
9.2
11.1
10.6
Operating Expense
19
14
38.0
22
(10.4)
41
30
38.5
(% of Sales)
33.9
28.3
31.4
32.5
28.6
Total Expenditure
27
20
35.0
28
(3.4)
55
41
35.5
Operating Profit
30
30
2
41
(26.4)
71
63
13.0
OPM (%)
52.7
59.7
59.4
56.3
60.7
Interest
5
4
3.7
4
22.5
8
8
Depreciation
10
6
58.4
10
4.0
20
12
59.7
Other Income
3
0
826.5
3
5.0
6
0
1,155.1
PBT
19
19
(3.1)
31
(38.8)
49
44
13.3
(% of Sales)
32.7
38.8
44.4
39.1
42.0
Provision for Taxation
6
7
(11.0)
13
(52.5)
19
15
24.7
(% of PBT)
32.0
34.9
41.2
37.7
34.3
Minority Interest
Recurring PAT
13
13
1.2
18
(29.3)
31
29
7.4
PATM
22.3
25.3
26.1
24.4
27.6
Extra-ordinary Items (Income)
2
2
Adj. PAT
13
13
1.2
20
(36.0)
33
29
14.0
Source: Company, Angel Research
November 10, 2015
2
Tree House | 2QFY2016 Result Update
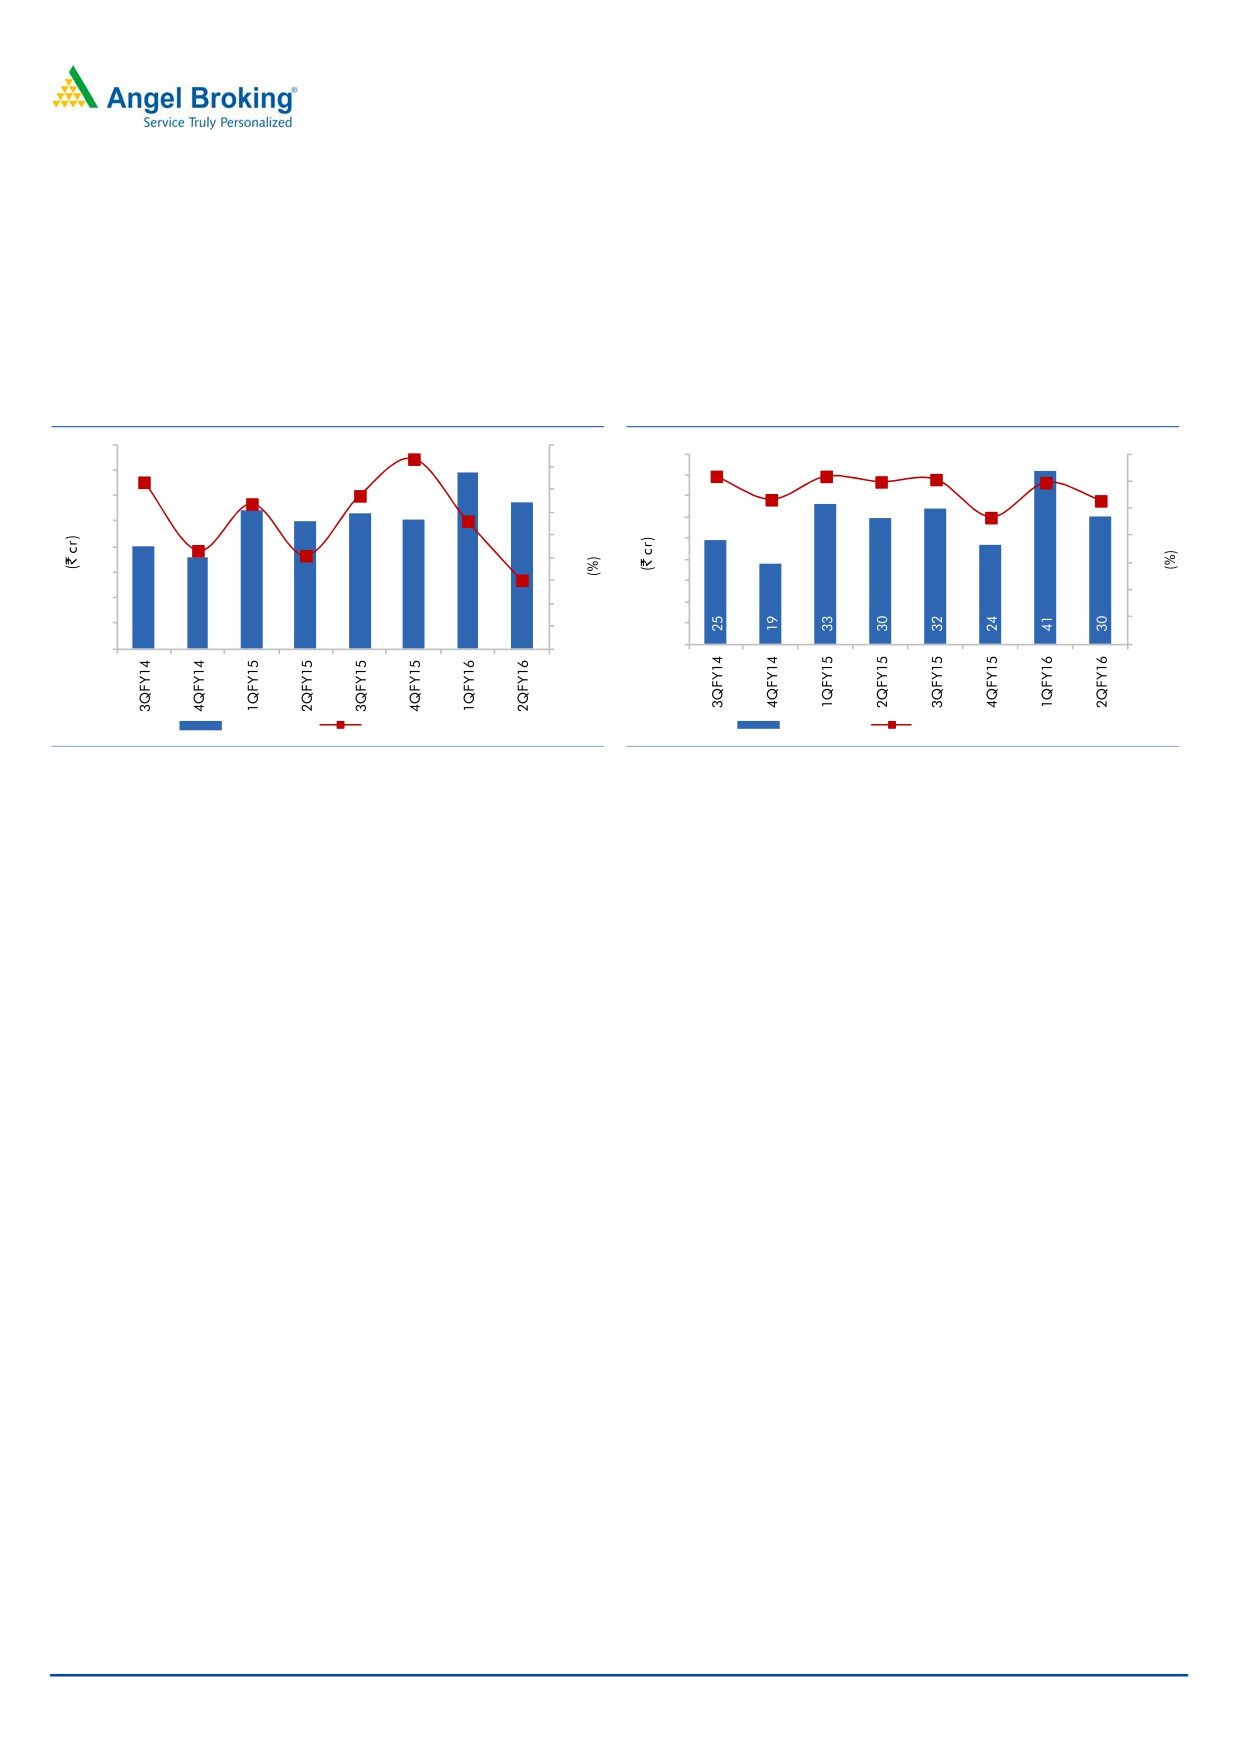
Healthy top-line growth led by addition of pre-schools
The company’s top-line grew ~15% yoy to ~`57cr, mainly due to growth in
existing pre-schools and addition of new pre-schools. The company added 73 pre-
schools in various cities like Ahmednagar, Goa, Gurgaon, Jalgaon, Noida, and
Ratnagiri, during the quarter.
Exhibit 2: Steady expansion aids growth momentum
Exhibit 3: EBIDTA and EBIDTA margin tend
80
33.7
41.8
28.1
45
45
61.7
60.6
70
61.7
59.4
70
36.7
40
59.7
40
53.1
52.7
31.9
60
35
60
20.5
35
46.5
30
50
50
30
21.6
25
25
40
40
20
20
30
30
15.1
15
15
20
20
10
10
10
10
5
5
40
36
54
50
53
51
69
57
0
0
0
0
Revenue (LHS)
Revenue growth yoy (RHS)
EBITDA (LHS)
EBITDA Margin (RHS)
Source: Company, Angel Research
Source: Company, Angel Research
Operating margin contraction by 700bp yoy
The operating profit came in at ~`30cr, up ~2% yoy. However, the operating
margin contracted by 700bp yoy to 52.7%, as the company opened 73 new
centres during the quarter, which is the highest ever in the history of the company
in a single quarter.
Poor operating performance drags down Net profit growth
For the quarter, the reported net profit grew by only ~1% yoy to ~`13cr, due to the
poor operating performance.
November 10, 2015
3
Tree House | 2QFY2016 Result Update
Investment Arguments
Expansion plan for pre-schools to drive growth
THEAL is expected to continue to post revenue growth on the back of its growing
geographic presence. In the past few years, the company has increased its number
of pre-school branches at a rapid pace, ie from 302 in FY2012 to 720 in
2QFY2016 (self-operated branches + franchisees). At present, the company’s
branches are concentrated in Maharashtra, with the region accounting for ~40%
of its branches. THEAL is now looking at expansion of pre-schools on a large scale
and across different regions, with particular focus on the Delhi & NCR region. The
company would be adding 150 pre-schools in FY2016. This move, we believe, is a
positive step in terms of mitigating the risk of geographic concentration.
Day care centers to trigger growth & profitability
THEAL has expanded its day-care foot print to 190 centers, with it receiving an
encouraging response in this segment. The Management believes that this service
will contribute significantly to the company’s top-line and bottom-line, going
ahead. THEAL has entered into tie-ups with large corporates in the IT, ITES,
banking and consulting space to provide day-care services for their employees.
Focus on monetization of K-12 School assets
The company is providing school management services to 24 K-12 schools in 3
states in India. The company is now focusing on monetizing its investments in K-12
school premises and moving towards an asset-light model while it would continue
to provide educational services in this segment. The company owns 5 set-ups (land
& building) including 1 in collaboration with a joint venture (JV) partner; THEAL
has a 50% stake in the JV. Of these, the company has sold 1 school property for
~`17cr; for another property, it has signed a MOU for sale of its land and
building in Vadodara for a consideration of `52.5cr.
Payment of debt
Currently the company is more focused on expansion and debt reduction. The
company has raised `200cr through a QIP to fund its expansion plans. Further, it
would be selling its K-12 school property, and would utilize its free cash flows to
offset debt. The company expects to be virtually debt free within two years.
November 10, 2015
4
Tree House | 2QFY2016 Result Update
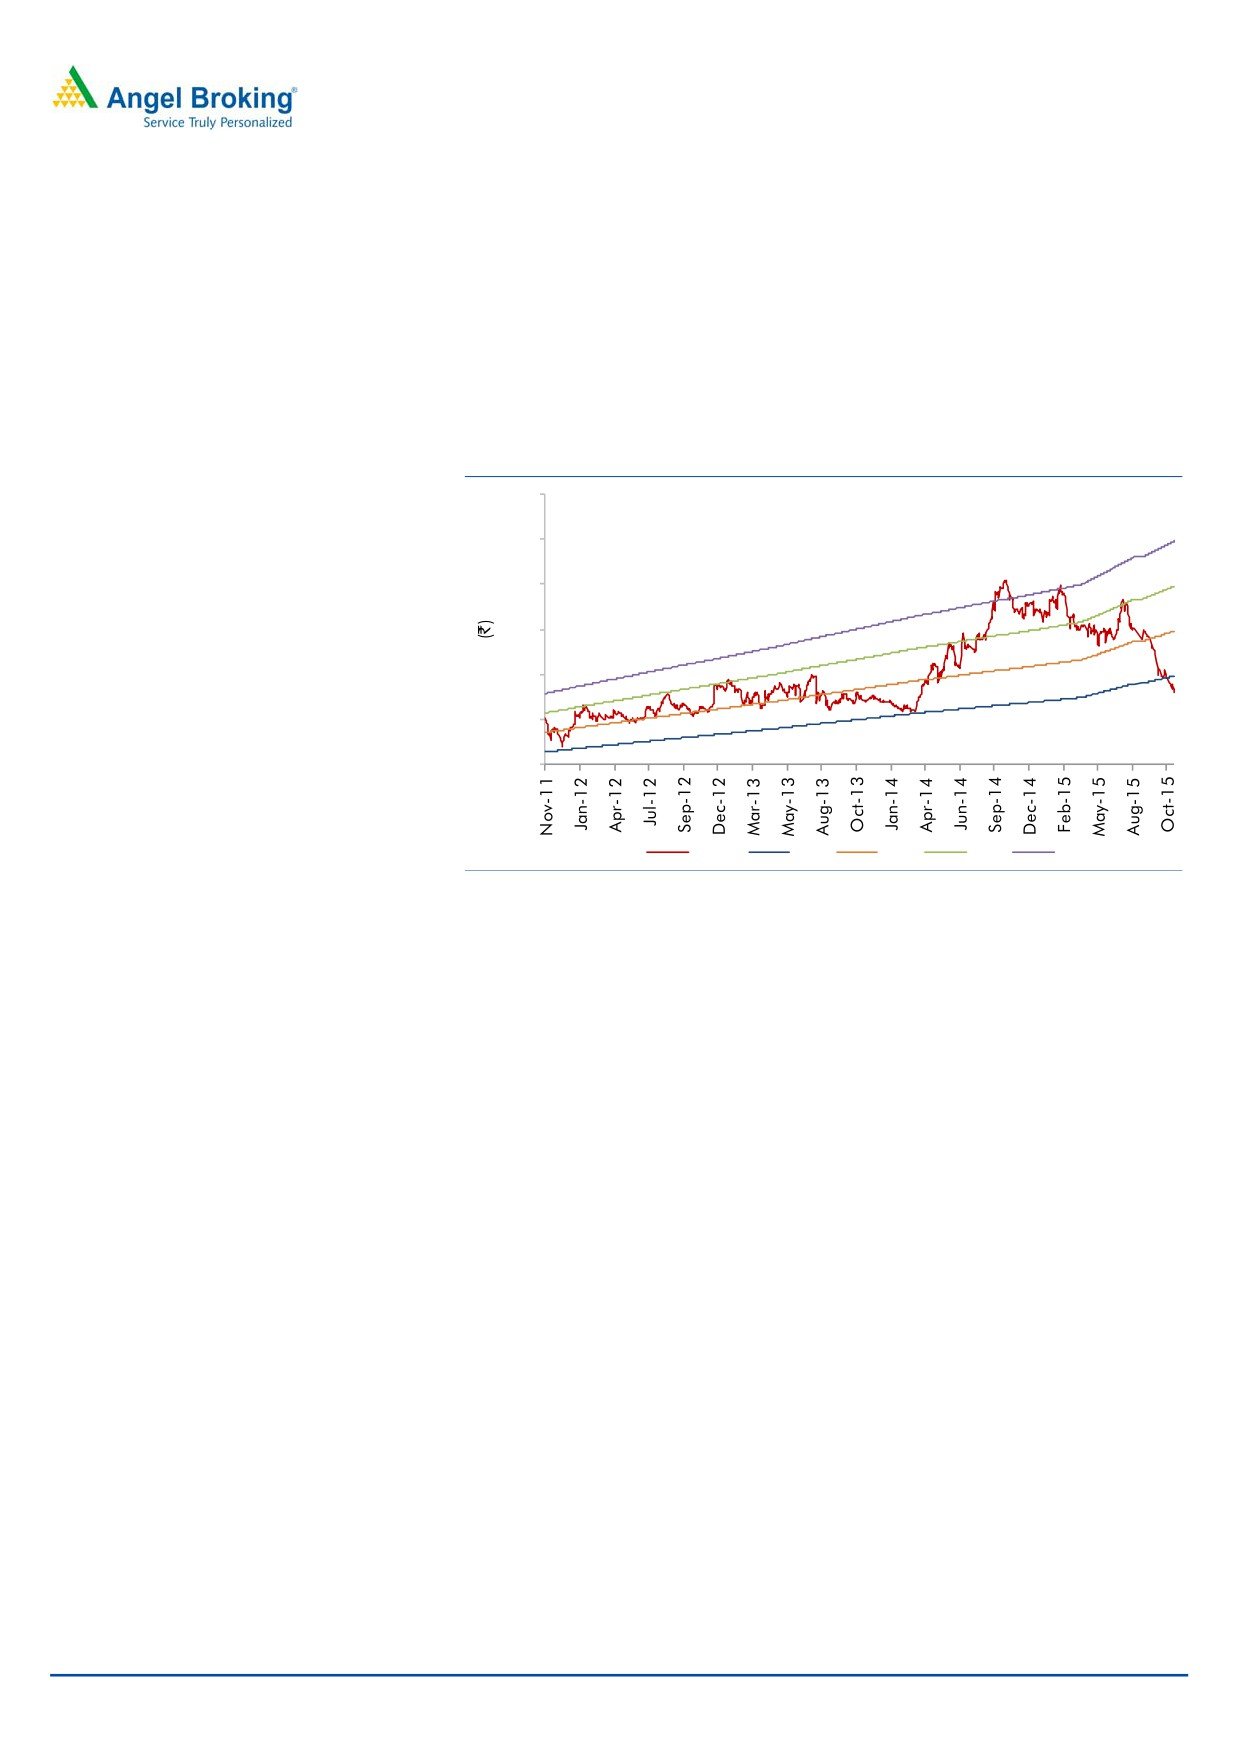
Outlook and Valuations:
We continue to remain positive on the stock, as we believe THEAL will continue to
register robust growth going ahead. The growth would come on the back of
consistent expansion of pre-schools and repayment of debt which would boost
earnings. We expect the company to report a CAGR of ~23% in the top-line and
~21% in the bottom-line over FY2015-17E. We recommend a Buy rating on the
stock, with a target price of `314.
Exhibit 4: One Year Forward PE
700
600
500
400
300
200
100
Price
15x
20x
25x
30x
Source: Company, Angel Research
Competition
The education sector in India is largely unorganized and the business of pre-
schools is highly fragmented and competitive. In addition to competition from
unorganized players in the pre-schools business, THEAL faces a lot of competition
from organized players in the market where it competes with various pre-schools
like Kidzee, Euro Kids, and Roots to Wings (operated by Educomp Solutions).
Key Risks
Geographical concentration risk: Around 42% of the company’s pre-schools
are located in and around Mumbai metropolitan. This suggests a geographical
concentration risk to the company.
Regulatory risk: Government introduced regulations on pre-schools may impose
restrictions on the company.
Company Background
Tree House Education and Accessories Limited (THEAL) runs quality pre-schools
and also provides educational services to K-12 schools throughout the country.
THEAL has revolutionized the concept of pre-school pedagogy in India through the
use of innovative teaching methods and child-focused personal care. The company
currently has 647 pre-schools, of which, 540 are self-operated. These are present
across 88 cities in India (data as of June 30, 2015). The company also provides
school management services to 24 K-12 schools in 3 states in India.
November 10, 2015
5
Tree House | 2QFY2016 Result Update
Profit and loss statement (Standalone)
Y/E March (` cr)
FY12
FY13
FY14
FY15
FY16E
FY17E
Total operating income
77
114
158
207
256
315
% chg
96.8
48.0
37.9
31.6
23.4
23.2
Total Expenditure
35
52
68
89
110
134
Personnel Expenses
10
13
17
24
30
38
Others Expenses
26
39
51
65
79
96
EBITDA
42
62
89
119
146
181
% chg
148.4
47.2
44.4
33.0
23.4
23.8
(% of Net Sales)
54.4
54.1
56.6
57.2
57.2
57.5
Depreciation& Amortisation
8
13
17
27
36
46
EBIT
34
48
72
92
110
135
% chg
41.6
49.2
27.2
19.9
22.4
(% of Net Sales)
44.3
42.4
45.8
44.3
43.0
42.8
Interest & other Charges
7
7
8
15
18
18
Other Income
4
7
1
7
8
10
(% of PBT)
12.3
14.4
2.0
8.5
8.0
7.9
Share in profit of Associates
-
-
-
-
-
-
Recurring PBT
32
49
66
84
100
127
% chg
54.7
35.1
26.8
19.1
27.0
Prior Period & Extraord. Exp./(Inc.)
-
-
-
-
-
-
PBT (reported)
32
49
66
84
100
127
Tax
10
16
22
23
30
38
(% of PBT)
31.4
31.8
33.5
27.3
30.0
30.0
PAT (reported)
22
33
44
61
70
89
ADJ. PAT
22
33
44
61
70
89
% chg
53.9
31.8
38.6
14.7
27.0
(% of Net Sales)
28.1
29.2
27.9
29.3
27.3
28.1
Basic EPS (`)
5.1
7.9
10.4
14.4
16.5
21.0
Fully Diluted EPS (`)
5.1
7.9
10.4
14.4
16.5
21.0
% chg
135.7
53.9
31.8
38.6
14.7
27.0
November 10, 2015
6
Tree House | 2QFY2016 Result Update
Balance Sheet (Standalone)
Y/E March (` cr)
FY12
FY13
FY14
FY15
FY16E
FY17E
SOURCES OF FUNDS
Equity Share Capital
34
36
37
42
42
42
Equity Share Warrants
-
10
3
-
-
-
Reserves& Surplus
223
297
360
615
682
768
Shareholders Funds
256
343
401
657
725
810
Total Loans
51
67
83
106
140
120
Deferred Tax Liability
3
5
5
5
5
5
Total Liabilities
311
415
489
768
870
935
APPLICATION OF FUNDS
Gross Block
154
185
293
393
533
663
Less: Acc. Depreciation
17
30
46
73
109
156
Net Block
137
155
247
320
424
507
Capital Work-in-Progress
20
40
28
28
28
28
Investments
31
10
11
11
11
11
Current Assets
149
240
240
462
471
469
Inventories
4
5
6
7
8
10
Sundry Debtors
6
7
29
39
48
60
Cash
48
49
11
161
100
35
Loans & Advances
7
10
7
10
13
16
Other Assets
85
169
187
244
302
347
Current liabilities
25
30
38
54
65
81
Net Current Assets
123
210
202
408
406
388
Deferred Tax Asset
0
0
0
0
0
0
Mis. Exp. not written off
-
-
-
-
-
-
Total Assets
311
415
489
768
870
935
November 10, 2015
7
Tree House | 2QFY2016 Result Update
Cash Flow statement
Y/E March (` cr)
FY12
FY13
FY14
FY15
FY16E FY17E
Profit Before Tax
32
49
66
84
100
127
Depreciation
8
13
17
27
36
46
Other Income
(29)
(58)
(35)
(56)
(60)
(46)
Change in Working Capital
3
3
6
15
18
18
Direct taxes paid
(7)
(18)
(19)
(23)
(30)
(38)
Cash Flow from Operations
(0)
(3)
0
-
-
-
(Incr)/ Decr in Fixed Assets
6
(14)
35
47
65
107
(Incr)/Decr In Investments
(73)
(71)
(96)
(100)
(140)
(130)
Other Income
(29)
21
(2)
-
-
-
Cash Flow from Investing
(101)
(49)
(97)
(100)
(140)
(130)
Issue of Equity/Preference
135
50
20
201
-
-
Incr/(Decr) in Debt
-
-
-
20
34
(20)
Dividend Paid (Incl. Tax)
-
(3)
(4)
(2)
(2)
(3)
Others
(21)
17
9
(15)
(18)
(18)
Cash Flow from Financing
114
64
24
203
13
(41)
Incr/(Decr) In Cash
19
1
(38)
151
(62)
(64)
Opening cash balance
29
48
49
11
161
100
Closing cash balance
48
49
11
161
100
35
November 10, 2015
8
Tree House | 2QFY2016 Result Update
Key Ratios
Y/E March
FY12
FY13
FY14
FY15
FY16E
FY17E
Valuation Ratio (x)
P/E (on FDEPS)
48.6
31.6
24.0
17.3
15.1
11.9
P/CEPS
35.8
22.6
17.3
12.0
9.9
7.8
P/BV
4.1
3.1
2.6
1.6
1.5
1.3
Dividend yield (%)
0.3
0.4
0.5
0.8
0.9
1.3
EV/Sales
13.3
9.3
7.1
4.8
4.2
3.6
EV/EBITDA
24.4
17.2
12.5
8.3
7.4
6.2
EV / Total Assets
3.0
2.4
2.1
1.2
1.2
1.1
Per Share Data (`)
EPS (Basic)
5.1
7.9
10.4
14.4
16.5
21.0
EPS (fully diluted)
5.1
7.9
10.4
14.4
16.5
21.0
Cash EPS
7.0
11.0
14.4
20.7
25.1
31.9
DPS
0.8
1.1
1.3
2.0
2.3
3.1
Book Value
60.6
81.2
94.7
155.3
171.3
191.5
Returns (%)
ROCE
11.1
11.8
14.9
12.0
12.7
14.5
Angel ROIC (Pre-tax)
14.9
13.8
15.7
15.6
14.6
15.3
ROE
8.4
9.7
11.0
9.3
9.6
10.9
Turnover ratios (x)
Asset Turnover (Gross Block)
0.6
0.7
0.6
0.6
0.6
0.6
Inventory / Sales (days)
17
15
13
13
12
12
Receivables (days)
27
22
67
68
69
70
Payables (days)
23
12
13
13
14
14
WC cycle (ex-cash) (days)
22
25
67
68
67
68
November 10, 2015
9
Tree House | 2QFY2016 Result Update
Research Team Tel: 022 - 39357800
DISCLAIMER
Angel Broking Private Limited (hereinafter referred to as “Angel”) is a registered Member of National Stock Exchange of India Limited,
Bombay Stock Exchange Limited and Metropolitan Stock Exchange of India Limited. It is also registered as a Depository Participant with
CDSL and Portfolio Manager with SEBI. It also has registration with AMFI as a Mutual Fund Distributor. Angel Broking Private Limited is
a registered entity with SEBI for Research Analyst in terms of SEBI (Research Analyst) Regulations, 2014 vide registration number
INH000000164. Angel or its associates has not been debarred/ suspended by SEBI or any other regulatory authority for accessing
/dealing in securities Market. Angel or its associates including its relatives/analyst do not hold any financial interest/beneficial
ownership of more than 1% in the company covered by Analyst. Angel or its associates/analyst has not received any compensation /
managed or co-managed public offering of securities of the company covered by Analyst during the past twelve months. Angel/analyst
has not served as an officer, director or employee of company covered by Analyst and has not been engaged in market making activity
of the company covered by Analyst.
This document is solely for the personal information of the recipient, and must not be singularly used as the basis of any investment
decision. Nothing in this document should be construed as investment or financial advice. Each recipient of this document should
make such investigations as they deem necessary to arrive at an independent evaluation of an investment in the securities of the
companies referred to in this document (including the merits and risks involved), and should consult their own advisors to determine
the merits and risks of such an investment.
Reports based on technical and derivative analysis center on studying charts of a stock's price movement, outstanding positions and
trading volume, as opposed to focusing on a company's fundamentals and, as such, may not match with a report on a company's
fundamentals.
The information in this document has been printed on the basis of publicly available information, internal data and other reliable
sources believed to be true, but we do not represent that it is accurate or complete and it should not be relied on as such, as this
document is for general guidance only. Angel Broking Pvt. Limited or any of its affiliates/ group companies shall not be in any way
responsible for any loss or damage that may arise to any person from any inadvertent error in the information contained in this report.
Angel Broking Pvt. Limited has not independently verified all the information contained within this document. Accordingly, we cannot
testify, nor make any representation or warranty, express or implied, to the accuracy, contents or data contained within this document.
While Angel Broking Pvt. Limited endeavors to update on a reasonable basis the information discussed in this material, there may be
regulatory, compliance, or other reasons that prevent us from doing so.
This document is being supplied to you solely for your information, and its contents, information or data may not be reproduced,
redistributed or passed on, directly or indirectly.
Neither Angel Broking Pvt. Limited, nor its directors, employees or affiliates shall be liable for any loss or damage that may arise from
or in connection with the use of this information.
Note: Please refer to the important ‘Stock Holding Disclosure' report on the Angel website (Research Section). Also, please refer to the
latest update on respective stocks for the disclosure status in respect of those stocks. Angel Broking Pvt. Limited and its affiliates may
have investment positions in the stocks recommended in this report.
Disclosure of Interest Statement
Tree House
1. Analyst ownership of the stock
No
2. Angel and its Group companies ownership of the stock
No
3. Angel and its Group companies' Directors ownership of the stock
No
4. Broking relationship with company covered
No
Note: We have not considered any Exposure below ` 1 lakh for Angel, its Group companies and Directors
Ratings (Based on expected returns
Buy (> 15%)
Accumulate (5% to 15%)
Neutral (-5 to 5%)
over 12 months investment period):
Reduce (-5% to -15%)
Sell (< -15)
November 10, 2015
10