(Long Term Cash : 3 Months)
Range
Stop Loss
Target
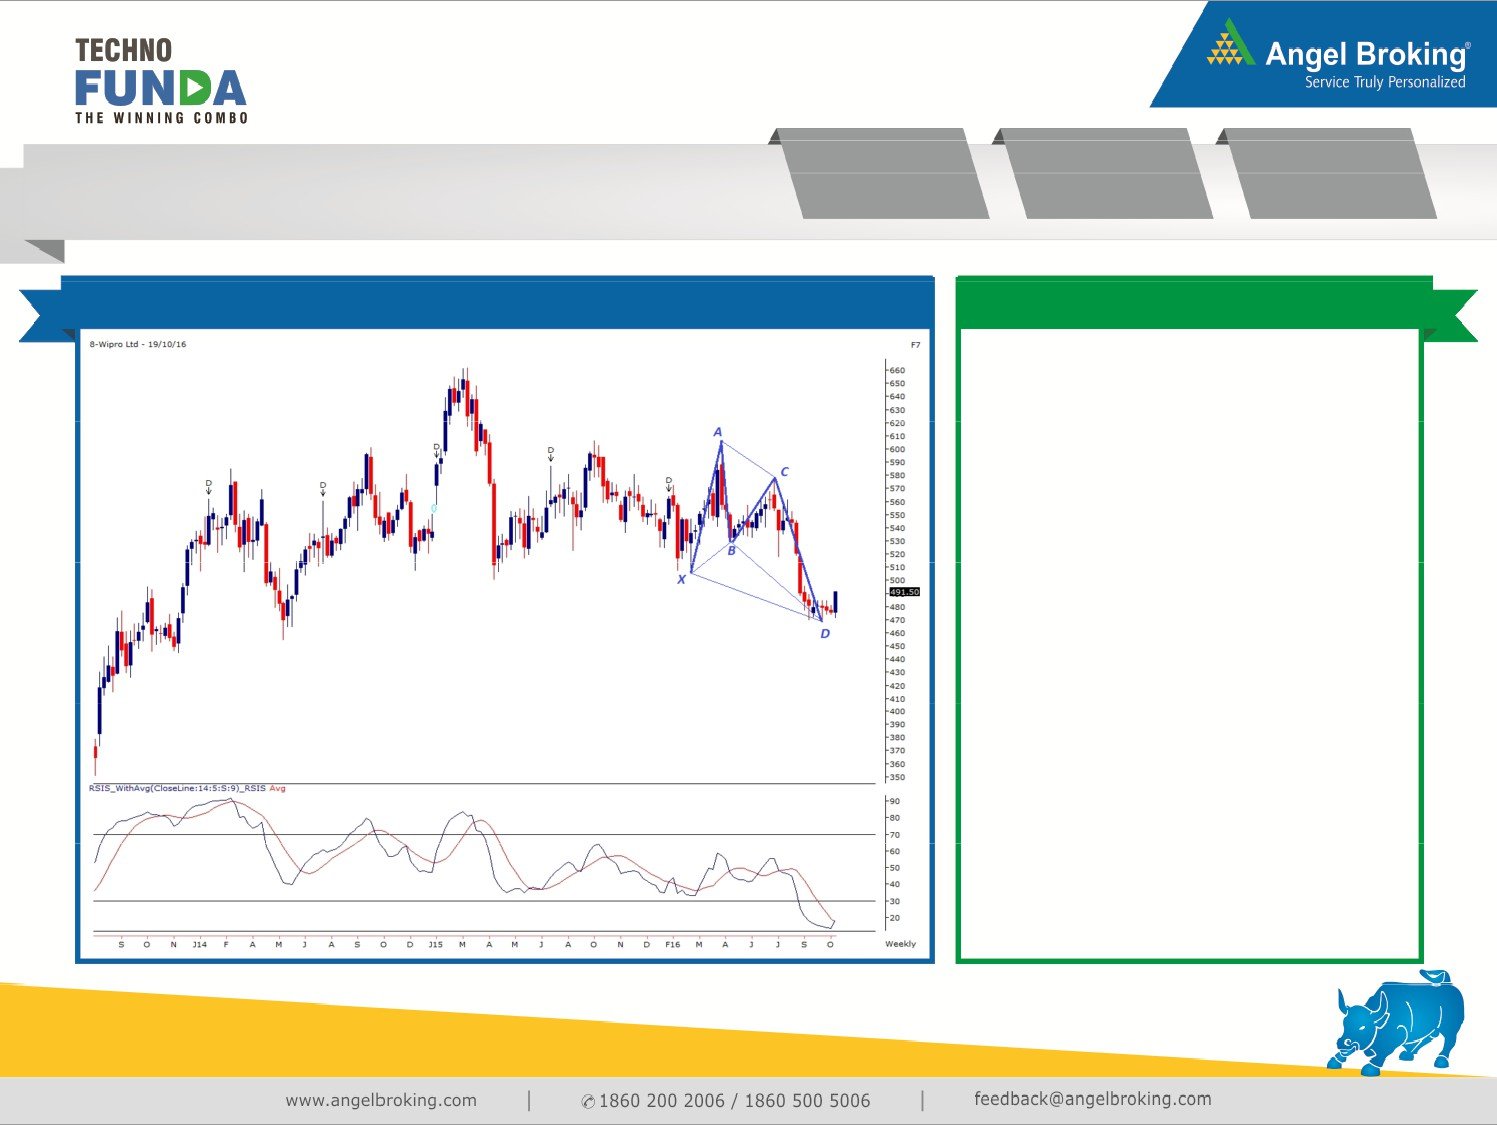
Wipro Ltd (NSE Cash) - BUY
491 - 485
449
565
Daily Chart
Technical Evidences
The stock has seen a decent correction in
the recent past and has reached around its
Potential Reversal Zone (PRZ) of a ‘Bullish
Butterfly’ pattern on weekly chart, which is
placed at `467 - `472.
The stock traded around the mentioned
PRZ levels for a month and is now coming
out of the consolidation phase.
The ‘RSI - Smoothened’ oscillator is also
rebounding from extreme oversold territory
and is giving positive crossover with its
average on weekly chart, indicating
possibility of a reversal in the counter.
Considering the formation of Bullish
Harmonic pattern along with other
technical evidences, we expect a healthy
move in the upward direction.
Thus, the stock can be bought from current
level to a decline up to `485 for a target of
`565 in coming three months. A stop loss
can be placed at ` 449.
Source: Falcon ( Chart time: 09:50 IST on 19/10/2016 )
October 19, 2016
Stock Info
Wipro Ltd
Moderate outlook on growth: For 2QFY2017, the company has given a revenue
Sector
IT
guidance of US$1,901-1,939mn, implying a US $ qoq growth of 0-1% on CC,
all organic as full integration of HPS has been completed in 1QFY2017. So after
Market cap
1,17,006
the 2QFY2017 guidance, the expected recovery in the company looks more likely
in FY2018. We expect US$ and INR revenue CAGR to be at 8.4% and 7.9%,
Beta
0.55
respectively, over FY2016-18E.
Target sales CAGR of 20% and EBIT Margin of 23%: The company as part of its
52 week high/low
607/470
vision for 2020, is targeting to reach US$15bn revenues with 23% EBIT margin,
implying revenue CAGR of ~20% over the next four years,. if the margins by
Avg. Daily Volume
1,16,005
300bps expansion, then it would imply an even higher CAGR for earnings.
Going by the guidance, the company’s organic growth outlook is not even closer
Face Value (`)
2.0
to its peers. However, on the acquisition front, the company has been very
aggressive in comparison to its peers.
Outlook and Valuation: On the valuations front, the stock is currently trading at
Shareholding Pattern (%)
14.8x its FY2017E and 13.7x its FY2018E EPS, ie at a discount to its peers, which
we expect the gap to narrow down once the company’s performance comes in
line with its peers in terms of growth and profitability. We recommend an
Promoters
73.3
Accumulate on the stock.
MF / Banks / Indian Fls
5.0
Company
Sales
OPM PAT EPS Adj. ROE P/E P/BV EV/EBITDA EV/Sales
(` cr)
(%)
(` cr)
(`)
(%)
(x)
(x)
(x)
(x)
FII / NRIs / OCBs
13.6
FY2017E
51,631
21.7
8,887
35.9
19.0
13.4
2.5
8.5
1.9
Indian Public / Others
8.1
FY2018E
55,822
17.9
9,115
36.9
18.1
13.1
2.6
7.2
1.5
October 19, 2016
Research Team Tel: 022 - 3935 7600
DISCLAIMER
Angel Broking Private Limited (hereinafter referred to as “Angel”) is a registered Member of National Stock Exchange of India Limited, Bombay Stock Exchange Limited and Metropolitan
Stock Exchange Limited. It is also registered as a Depository Participant with CDSL and Portfolio Manager with SEBI. It also has registration with AMFI as a Mutual Fund Distributor. Angel
Broking Private Limited is a registered entity with SEBI for Research Analyst in terms of SEBI (Research Analyst) Regulations, 2014 vide registration number INH000000164. Angel or its
associates has not been debarred/ suspended by SEBI or any other regulatory authority for accessing /dealing in securities Market. Angel or its associates/analyst has not received any
compensation / managed or co-managed public offering of securities of the company covered by Analyst during the past twelve months.
This document is solely for the personal information of the recipient, and must not be singularly used as the basis of any investment decision. Nothing in this document should be construed
as investment or financial advice. Each recipient of this document should make such investigations as they deem necessary to arrive at an independent evaluation of an investment in the
securities of the companies referred to in this document (including the merits and risks involved), and should consult their own advisors to determine the merits and risks of such an
investment.
Reports based on technical and derivative analysis center on studying charts of a stock's price movement, outstanding positions and trading volume, as opposed to focusing on a company's
fundamentals and, as such, may not match with a report on a company's fundamentals. Investors are advised to refer the Fundamental and Technical Research Reports available on our
website to evaluate the contrary view, if any.
The information in this document has been printed on the basis of publicly available information, internal data and other reliable sources believed to be true, but we do not represent that it
is accurate or complete and it should not be relied on as such, as this document is for general guidance only. Angel Broking Pvt. Limited or any of its affiliates/ group companies shall not
be in any way responsible for any loss or damage that may arise to any person from any inadvertent error in the information contained in this report. Angel Broking Pvt. Limited has not
independently verified all the information contained within this document. Accordingly, we cannot testify, nor make any representation or warranty, express or implied, to the accuracy,
contents or data contained within this document. While Angel Broking Pvt. Limited endeavors to update on a reasonable basis the information discussed in this material, there may be
regulatory, compliance, or other reasons that prevent us from doing so.
This document is being supplied to you solely for your information, and its contents, information or data may not be reproduced, redistributed or passed on, directly or indirectly.
Neither Angel Broking Pvt. Limited, nor its directors, employees or affiliates shall be liable for any loss or damage that may arise from or in connection with the use of this information.
Disclosure of Interest Statement
Wipro
1. Financial interest of research analyst or Angel or his Associate or his relative
No
2. Ownership of 1% or more of the stock by research analyst or Angel or associates or relatives
No
3. Served as an officer, director or employee of the company covered under Research
No
4. Broking relationship with company covered under Research
No
October 19, 2016