Range
Stop Loss
Target
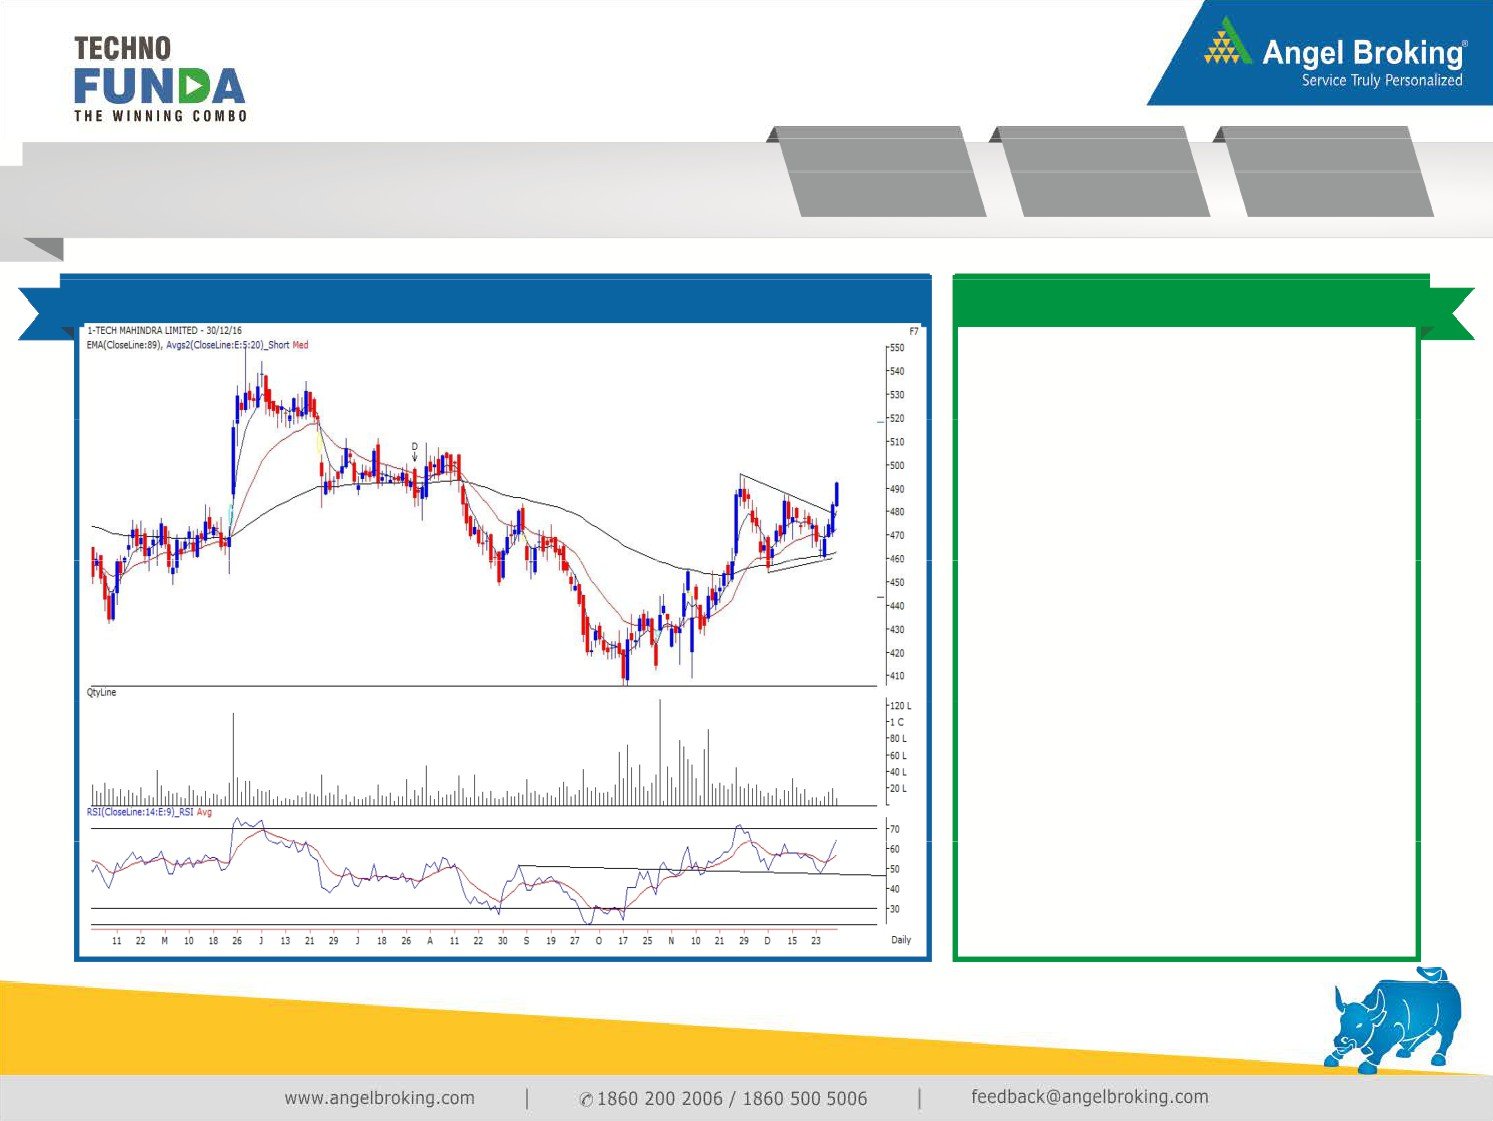
Tech Mahindra (NSE Cash) - BUY
485 - 490
457
548
Daily Chart
Technical Evidences
The stock tested its long term support around
` 400 in the month of October. Post that, the
prices have rallied higher and have formed
‘Higher Top Higher Bottom’ structure on the
daily chart.
The
‘5&20
EMA’s’ on daily charts are
indicating an uptrend in the stock as the
‘5EMA is trading above the ‘20EMA’ and is
showing upside momentum.
The stock had recently consolidated in a
range and formed a ‘Pennant’ pattern. Prices
have given breakout from the mentioned
pattern.
The volumes during the upmove were high
and low during the consolidation which is a
positive sign.
Considering the above technical evidences,
we expect a healthy move in the upward
direction.
Thus, the stock can be bought from current
level to a decline up to `485 for a target of
`548 in coming three months. A stop loss
can be placed at ` 457.
Source: Falcon ( Chart time: 12:30 IST on 30/12/2016 )
December 30, 2016
Stock Info
Tech Mahindra
Growth prospects decent; Brexit - a near term concern: The Management is more optimistic
Sector
IT Software
about the Communications vertical (excluding LCC, where a lot of portfolio rationalization
has taken place). In the near term, the Management feels Brexit could cause temporary
Market cap
46,919
instability and uncertainty; however it is too early to call out any immediate business
implications. We expect a CAGR of 10.6% & 11.5% in USD and INR revenue, respectively,
over FY2016-18E.
Beta
0.9
Deal pipeline healthy: Tech Mahindra remains confident of improving revenue growth,
52 week high/low
564/405
citing healthy deal pipeline along with pick up in discretionary spending, primarily in the
US. The Management sounded confident of demand from BFSI, Healthcare, Manufacturing
and Retail. During 2QFY2017 the company won deals worth TCV of US$325mn. The
Avg. Daily Volume
30,771
pipeline has been healthy and most of the deals won are in newer areas like product
engineering, cloud, IoT and IMS.
Face Value (`)
5.0
Outlook and Valuation: Given the recent acquisitions and healthy order pipeline, the
company is expected to post a healthy US$ and INR CAGR of 10.6% and 11.5%,
respectively, over FY2016-18E. However, the acquisition of LCC will be margin dilutive in
Shareholding Pattern (%)
the near term, leading the FY2016 EBDIT margin to drop to 16.3% from 22.2% in
FY2014.Given the conducive valuation on EV/sales front, where it trades at a significant
discount to its peers, we believe the stock should witness uptrend once the profitability
Promoters
36.3
returns to its mean average. We recommend a Buy rating on the stock.
MF / Banks / Indian Fls
13.3
Company
Sales
OPM PAT EPS Adj. ROE P/E P/BV EV/EBITDA EV/Sales
(` cr)
(%)
(` cr)
(`)
(%)
(x)
(x)
(x)
(x)
FII / NRIs / OCBs
39.2
FY2017E
29,673
15.5
3,173
32.8
19.6
13.2
2.6
7.9
1.2
Indian Public / Others
11.2
FY2018E
32,937
17.0
3,886
39.9
20.7
10.9
2.2
6.1
1.0
December 30, 2016
Research Team Tel: 022 - 3935 7600
DISCLAIMER
Angel Broking Private Limited (hereinafter referred to as “Angel”) is a registered Member of National Stock Exchange of India Limited, Bombay Stock Exchange Limited and Metropolitan
Stock Exchange Limited. It is also registered as a Depository Participant with CDSL and Portfolio Manager with SEBI. It also has registration with AMFI as a Mutual Fund Distributor. Angel
Broking Private Limited is a registered entity with SEBI for Research Analyst in terms of SEBI (Research Analyst) Regulations, 2014 vide registration number INH000000164. Angel or its
associates has not been debarred/ suspended by SEBI or any other regulatory authority for accessing /dealing in securities Market. Angel or its associates/analyst has not received any
compensation / managed or co-managed public offering of securities of the company covered by Analyst during the past twelve months.
This document is solely for the personal information of the recipient, and must not be singularly used as the basis of any investment decision. Nothing in this document should be construed
as investment or financial advice. Each recipient of this document should make such investigations as they deem necessary to arrive at an independent evaluation of an investment in the
securities of the companies referred to in this document (including the merits and risks involved), and should consult their own advisors to determine the merits and risks of such an
investment.
Reports based on technical and derivative analysis center on studying charts of a stock's price movement, outstanding positions and trading volume, as opposed to focusing on a company's
fundamentals and, as such, may not match with a report on a company's fundamentals. Investors are advised to refer the Fundamental and Technical Research Reports available on our
website to evaluate the contrary view, if any.
The information in this document has been printed on the basis of publicly available information, internal data and other reliable sources believed to be true, but we do not represent that it
is accurate or complete and it should not be relied on as such, as this document is for general guidance only. Angel Broking Pvt. Limited or any of its affiliates/ group companies shall not
be in any way responsible for any loss or damage that may arise to any person from any inadvertent error in the information contained in this report. Angel Broking Pvt. Limited has not
independently verified all the information contained within this document. Accordingly, we cannot testify, nor make any representation or warranty, express or implied, to the accuracy,
contents or data contained within this document. While Angel Broking Pvt. Limited endeavors to update on a reasonable basis the information discussed in this material, there may be
regulatory, compliance, or other reasons that prevent us from doing so.
This document is being supplied to you solely for your information, and its contents, information or data may not be reproduced, redistributed or passed on, directly or indirectly.
Neither Angel Broking Pvt. Limited, nor its directors, employees or affiliates shall be liable for any loss or damage that may arise from or in connection with the use of this information.
Disclosure of Interest Statement
Tech Mahindra
1. Financial interest of research analyst or Angel or his Associate or his relative
No
2. Ownership of 1% or more of the stock by research analyst or Angel or associates or relatives
No
3. Served as an officer, director or employee of the company covered under Research
No
4. Broking relationship with company covered under Research
No
December 30, 2016