3QFY2016 Result Update | IT
February 23, 2016
Tech Mahindra
BUY
CMP
`440
Performance Highlights
Target Price
`530
(` cr)
3QFY16
2QFY16
% chg (qoq)
3QFY15
% chg (yoy)
Investment Period
12 Months
Net revenue
6,701
6,616
1.3
5,752
16.5
EBITDA
1,136
1,101
3.2
1,170
(2.9)
Stock Info
EBITDA margin (%)
16.9
16.6
31bp
20.3
(339)bp
Sector
IT
Adj. PAT
759
786
(3.4)
805
(5.7)
Source: Company, Angel Research;
Market Cap (` cr)
42,533
Net Debt (` cr)
(3,833)
For 3QFY2016, Tech Mahindra posted a 0.4% qoq growth in revenues to
Beta
0.5
US$1,015mn V/s an expected US$1,021mn and V/s US$1,011mn in 2QFY2016.
52 Week High / Low
736/416
On constant currency (CC), the company posted a 1.2% qoq revenue growth. On
Avg. Daily Volume
229,545
the operating front, the EBDITA margin came in at 16.9% V/s an expected 17.2%
Face Value (`)
5
and V/s 16.6% in 2QFY2016, a qoq expansion of 70bp. The EBIT margin came
BSE Sensex
23,709
in at 14.3% V/s an expected 14.2% and V/s 13.7% in 2QFY2016. The company
Nifty
7,211
posted a net profit of `759cr V/s an expected `809cr and V/s `786cr in
Reuters Code
TEML.BO
2QFY2016, a qoq de-growth of 3.4%. We remain positive on the stock and
Bloomberg Code
TECHM@IN
recommend a Buy rating with a price target of `530.
Result highlights: For 3QFY2016, the company posted a 0.4% qoq growth in
Shareholding Pattern (%)
revenues to US$1,015mn V/s an expected US$1,021mn and V/s US$1,011mn in
Promoters
36.5
2QFY2016.. In INR terms, the company posted sales of `6,701cr V/s an expected
MF / Banks / Indian Fls
14.2
`6,729cr, a qoq growth of 1.3%. On CC, the company posted a 1.2% qoq
FII / NRIs / OCBs
37.7
revenue growth. The growth was mainly driven by ROW, which constituted around
Indian Public / Others
11.6
23.2% of sales in 3QFY2016 V/s 21.9% of sales in 2QFY2016. USA and Europe
constituted 47.8% (48.9% of sales in 2QFY2016) and 28.9% (29.3% of sales in
2QFY2016) of sales, respectively. In terms of industry, the growth was driven by
Abs.(%)
3m 1yr
3yr
manufacturing. On the operating front, the EBDITA margin came in at 16.9% V/s
Sensex
(8.3)
(19.5)
20.7
an expected 17.2% and V/s 16.6% in 2QFY2016, a qoq expansion of 70bp. The
Tech Mahindra
(17.7)
(37.9)
70.1
EBIT margin came in at 14.3% V/s an expected 14.2% and V/s 13.7% in
2QFY2016. The company posted a net profit of `759cr V/s an expected `809cr
and V/s `786cr in 2QFY2016, a qoq de-growth of 3.4%.
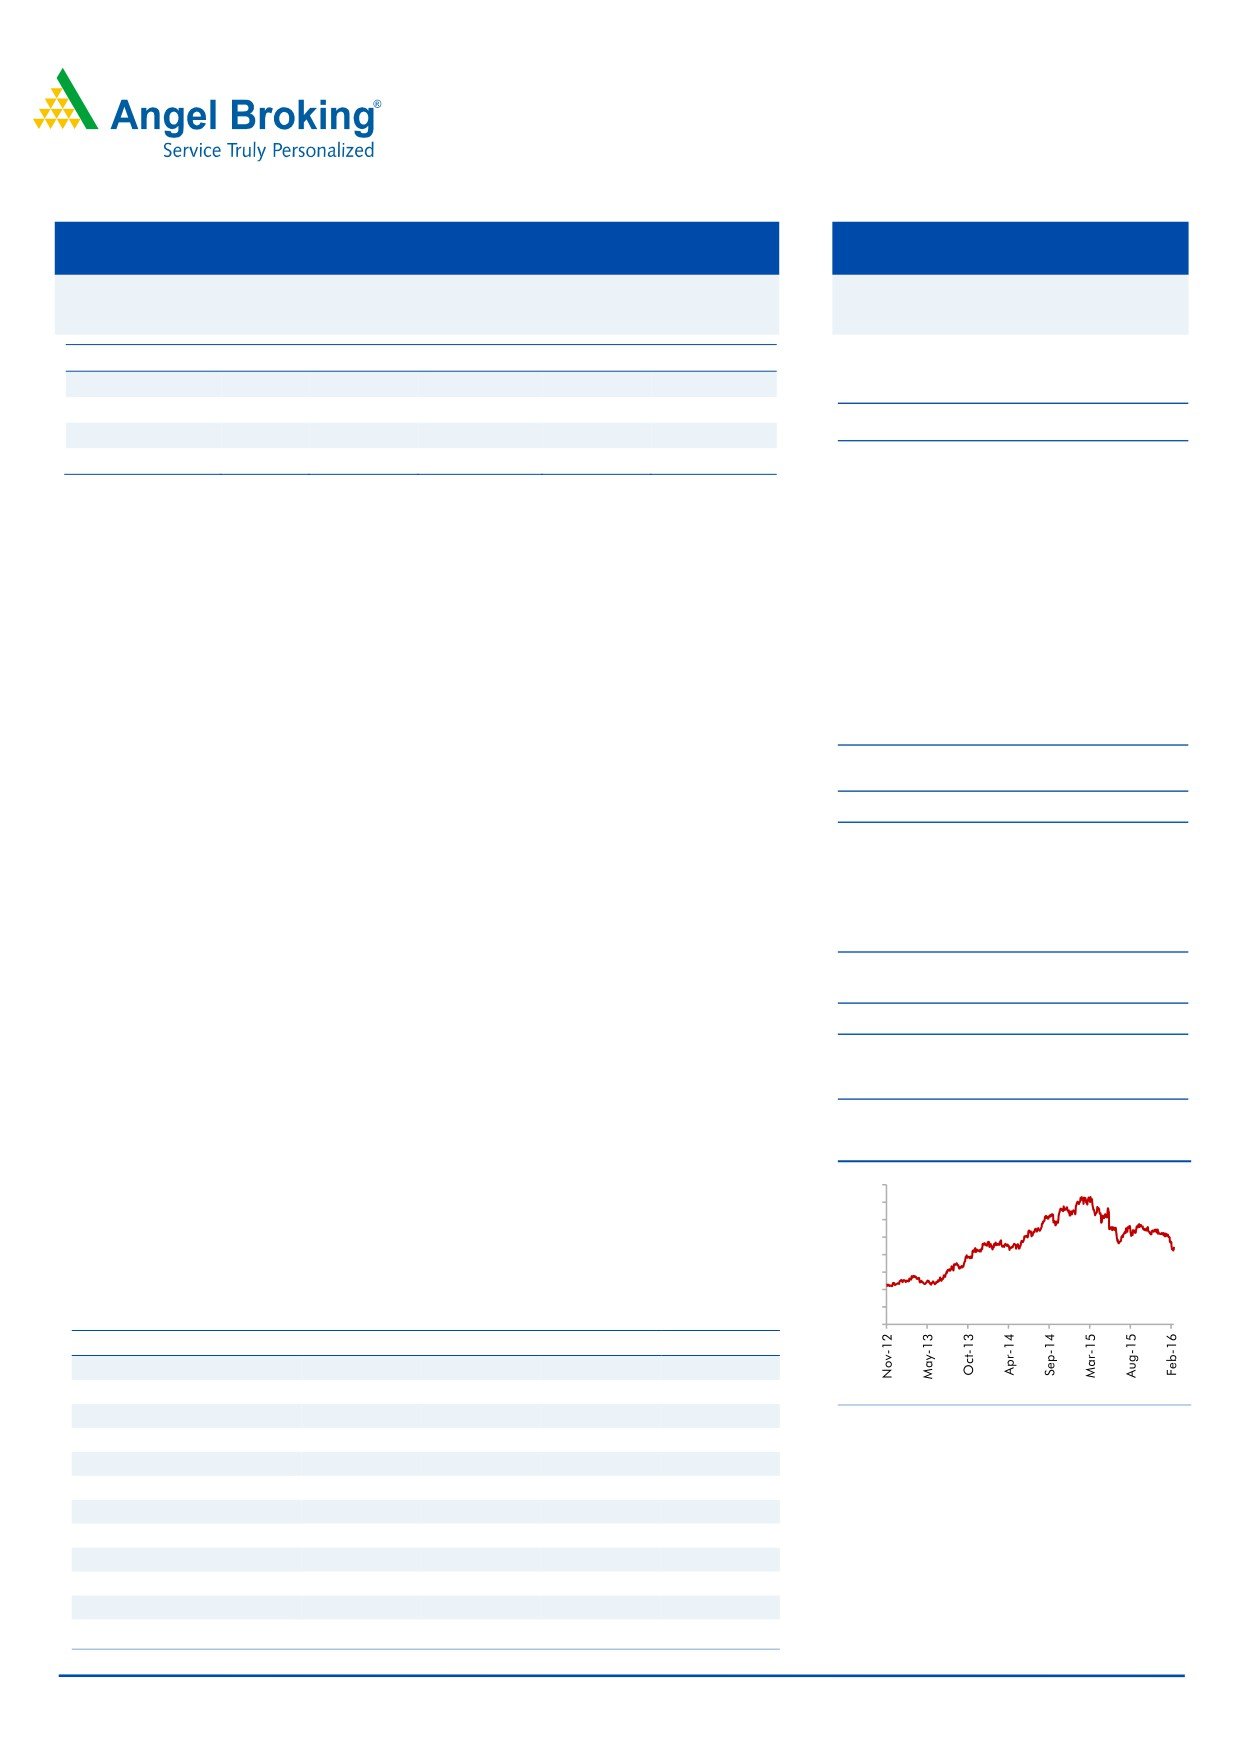
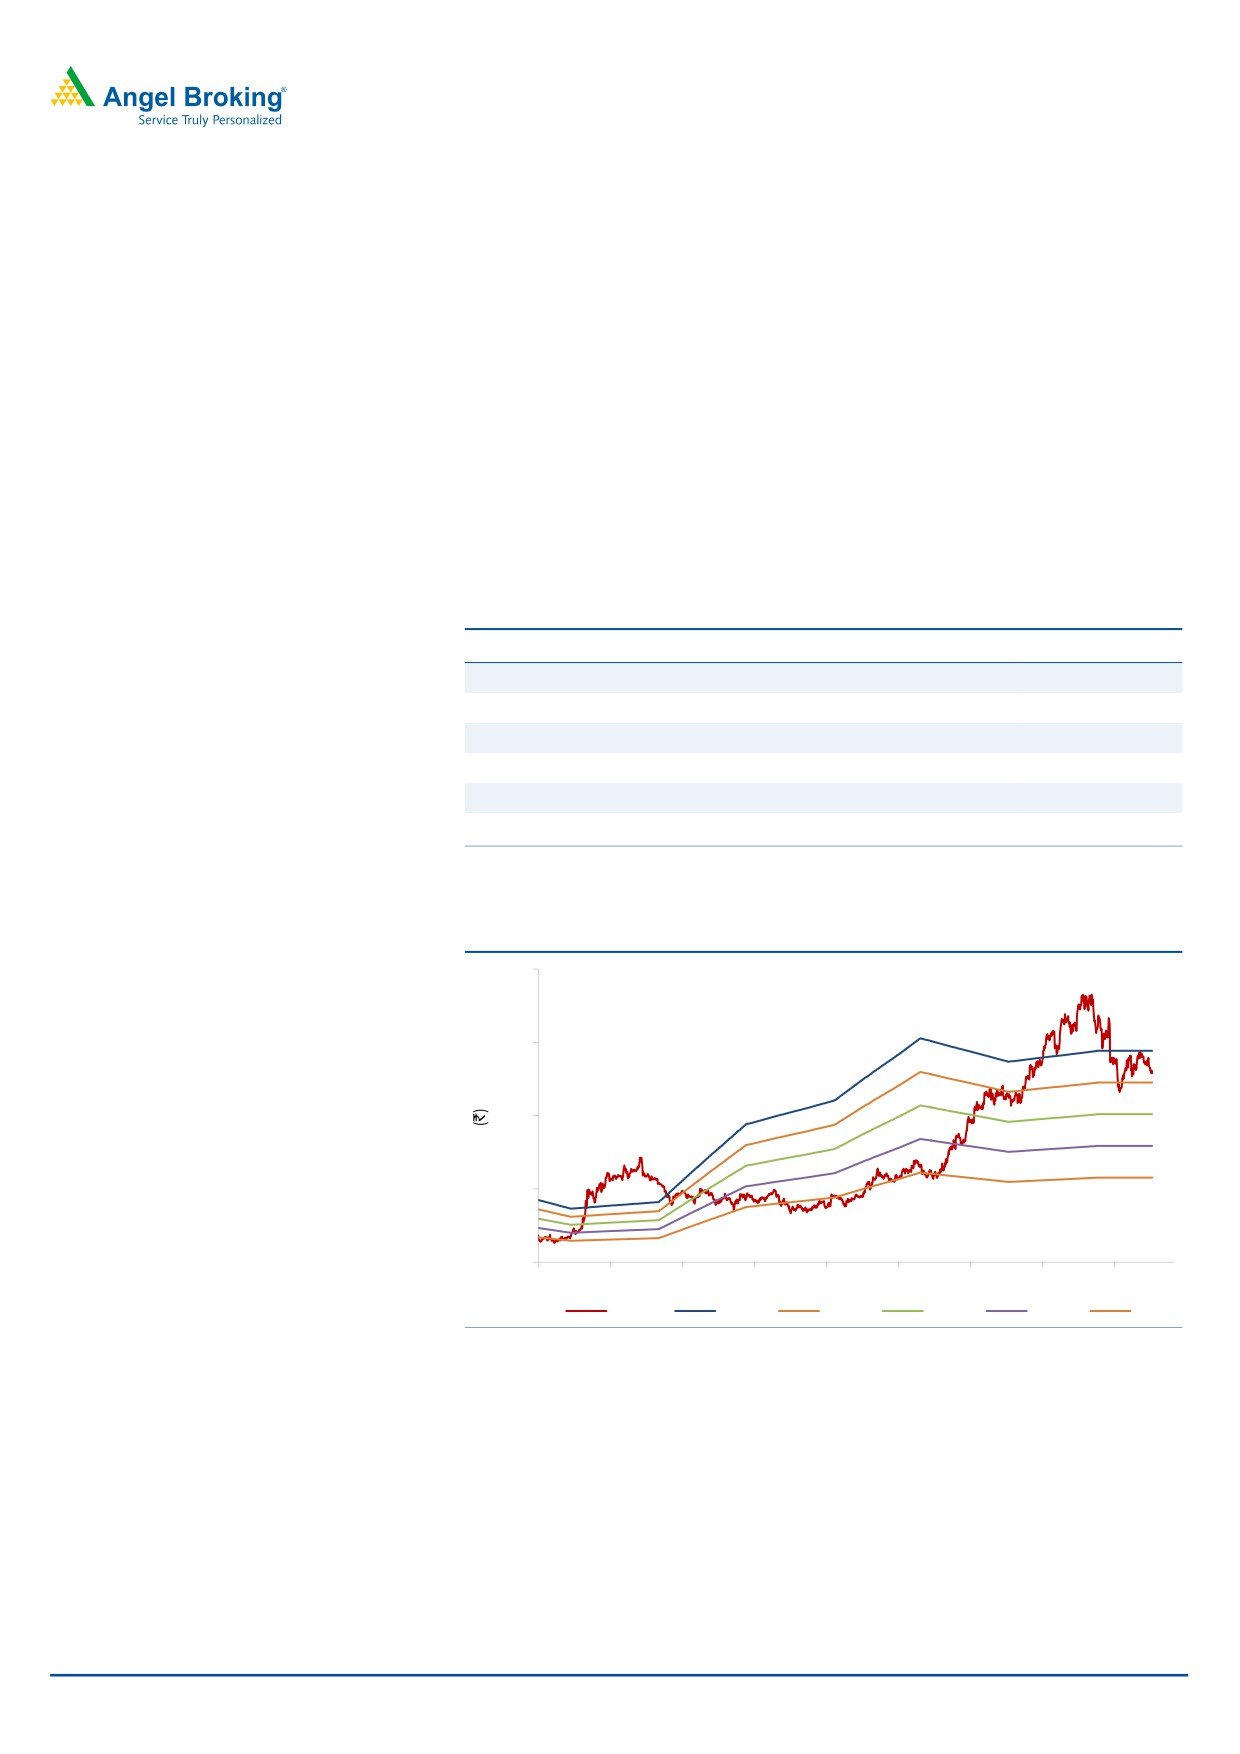
3-year price chart
800
Outlook and valuation: The Management remains confident of reverting back to
700
the original profitability by FY2017-18. We expect a CAGR of 10.3% and 13.6% in USD and
600
500
INR revenue respectively over FY2015-17E, driven by acquisitions. The PAT is expected to
400
300
grow at a CAGR of 10.8% over FY2015-17. We maintain our Buy on the stock.
200
100
Key financials (Consolidated, Indian GAAP)
0
Y/E March (` cr)
FY2014
FY2015
FY2016E
FY2017E
Net sales
18,831
22,621
26,524
29,177
% chg
31.4
20.1
17.3
10.0
Net profit
2,932
2,628
2,771
3,224
Source: Company, Angel Research
% chg
38.6
(10.4)
5.4
16.4
EBITDA margin (%)
29.6
18.4
16.2
17.0
EPS (`)
30.5
27.4
28.8
33.6
P/E (x)
14.4
16.1
15.2
13.1
P/BV (x)
4.6
3.4
2.9
2.5
RoE (%)
31.9
21.5
19.3
19.1
RoCE (%)
43.2
24.0
21.3
21.5
Sarabjit kour Nangra
EV/Sales (x)
2.0
1.8
1.4
1.2
+91 22 3935 7800 Ext: 6806
EV/EBITDA (x)
6.8
9.8
8.9
7.3
Source: Company, Angel Research; Note: CMP as of February 19, 2016
Please refer to important disclosures at the end of this report
1
Tech Mahindra | 3QFY2016 Result Update
Exhibit 1: 3QFY2016 performance (Consolidated, Indian GAAP)
(` cr)
3QFY16
2QFY16
% chg (qoq)
3QFY15
% chg (yoy)
9MFY16
9MFY15
% chg (yoy)
Net revenue
6,701
6,616
1.3
5,752
16.5
19,611
16,504
18.8
Cost of revenue
4,607
4,496
2.5
3,756
22.7
13,544
10,790
25.5
Gross profit
2,095
2,120
(1.2)
1,996
4.9
6,067
5,715
6.2
SG&A expense
959
1,019
(5.9)
826
16.1
2,885
2,459
17.3
EBITDA
1,136
1,101
3.2
1,170
(2.9)
3,181
3,255
(2.3)
Dep. and amortization
174
197
(12.1)
144
20.5
544
439
23.9
EBIT
962
904
6.5
1,026
(6.2)
2,637
2,816
(6.4)
Interest
24
17
41.0
14
78.1
63
43
45.6
Other income
64
166
(61.5)
19
236.3
366
172
113.2
PBT
1,002
1,052
(4.8)
1,031
(2.9)
2,940
2,945
(0.1)
Income taxes
233
260
(10.6)
251
(7.4)
703
775
(9.3)
PAT
769
792
(2.9)
780
(1.4)
2,237
2,170
3.1
Minority interest
10
7
49.2
3
212.9
18
14
27.2
PAT after minority interest
759
786
(3.4)
777
(2.3)
2,220
2,156
3.0
Profit from associates
(0)
0
29
1
-
Exceptional item
-
-
-
-
-
Reported PAT
759
786
(3.4)
805
(5.7)
2,221
2,156
3.0
Adj. PAT
759
786
(3.4)
805
(5.7)
2,221
2,156
3.0
Diluted EPS
7.9
8.2
(3.4)
8.4
(5.7)
23.1
22.4
3.0
Gross margin (%)
31.3
32.0
(79)bp
34.7
(345)bp
30.9
34.6
(369)bp
EBITDA margin (%)
16.9
16.6
31bp
20.3
(339)bp
16.2
19.7
(350)bp
EBIT margin (%)
14.4
13.7
70bp
17.8
(348)bp
13.4
17.1
(362)bp
PAT margin (%)
11.3
11.9
(55)bps
14.0
(267)bp
11.3
13.1
(174)bp
Source: Company, Angel Research
Exhibit 2: 3QFY2016 - Actual vs Angel estimates
(` cr)
Actual
Estimate
Var. (%)
Net revenue
6,701
6,729
(0.4)
EBITDA margin (%)
16.9
17.2
(23)bps
PAT
759
809
(6.2)
Source: Company, Angel Research
Revenue growth led by ROW
For 3QFY2016, the company posted a
0.4% qoq
growth in revenues to
US$1,015mn V/s an expected US$1,021mn and V/s US$1,011mn in 2QFY2016.
In INR terms, the company posted sales of `6,701cr V/s an expected `6,729cr, a
qoq growth of 1.3%. On CC, the company posted a 1.2% qoq revenue growth.
The growth was mainly driven by ROW, which constituted ~23.2% of sales in
3QFY2016 V/s 21.9% of sales in 2QFY2016. USA and Europe constituted 47.8%
(48.9% of sales in 2QFY2016) and 28.9% (29.3% of sales in 2QFY2016) of sales,
respectively. In terms of industry, growth was driven by manufacturing. Its key
domain telecom posted a 2.7% qoq de-growth. The business from the Top 5
players constituted ~28% of sales in 3QFY2016 V/s 32% of sales in 2QFY2016.
Delayed decision making in telecom is expected to continue in the near term. The
pressure on service providers in the voice business, budgetary control and newer
areas of capital projects are likely to continue driving volatility for a couple of
February 23, 2016
2
Tech Mahindra | 3QFY2016 Result Update
quarters. The decline in top 5 customers during the quarter was led by negative
impact of cross-currency movement, furloughs and ramp down in certain accounts.
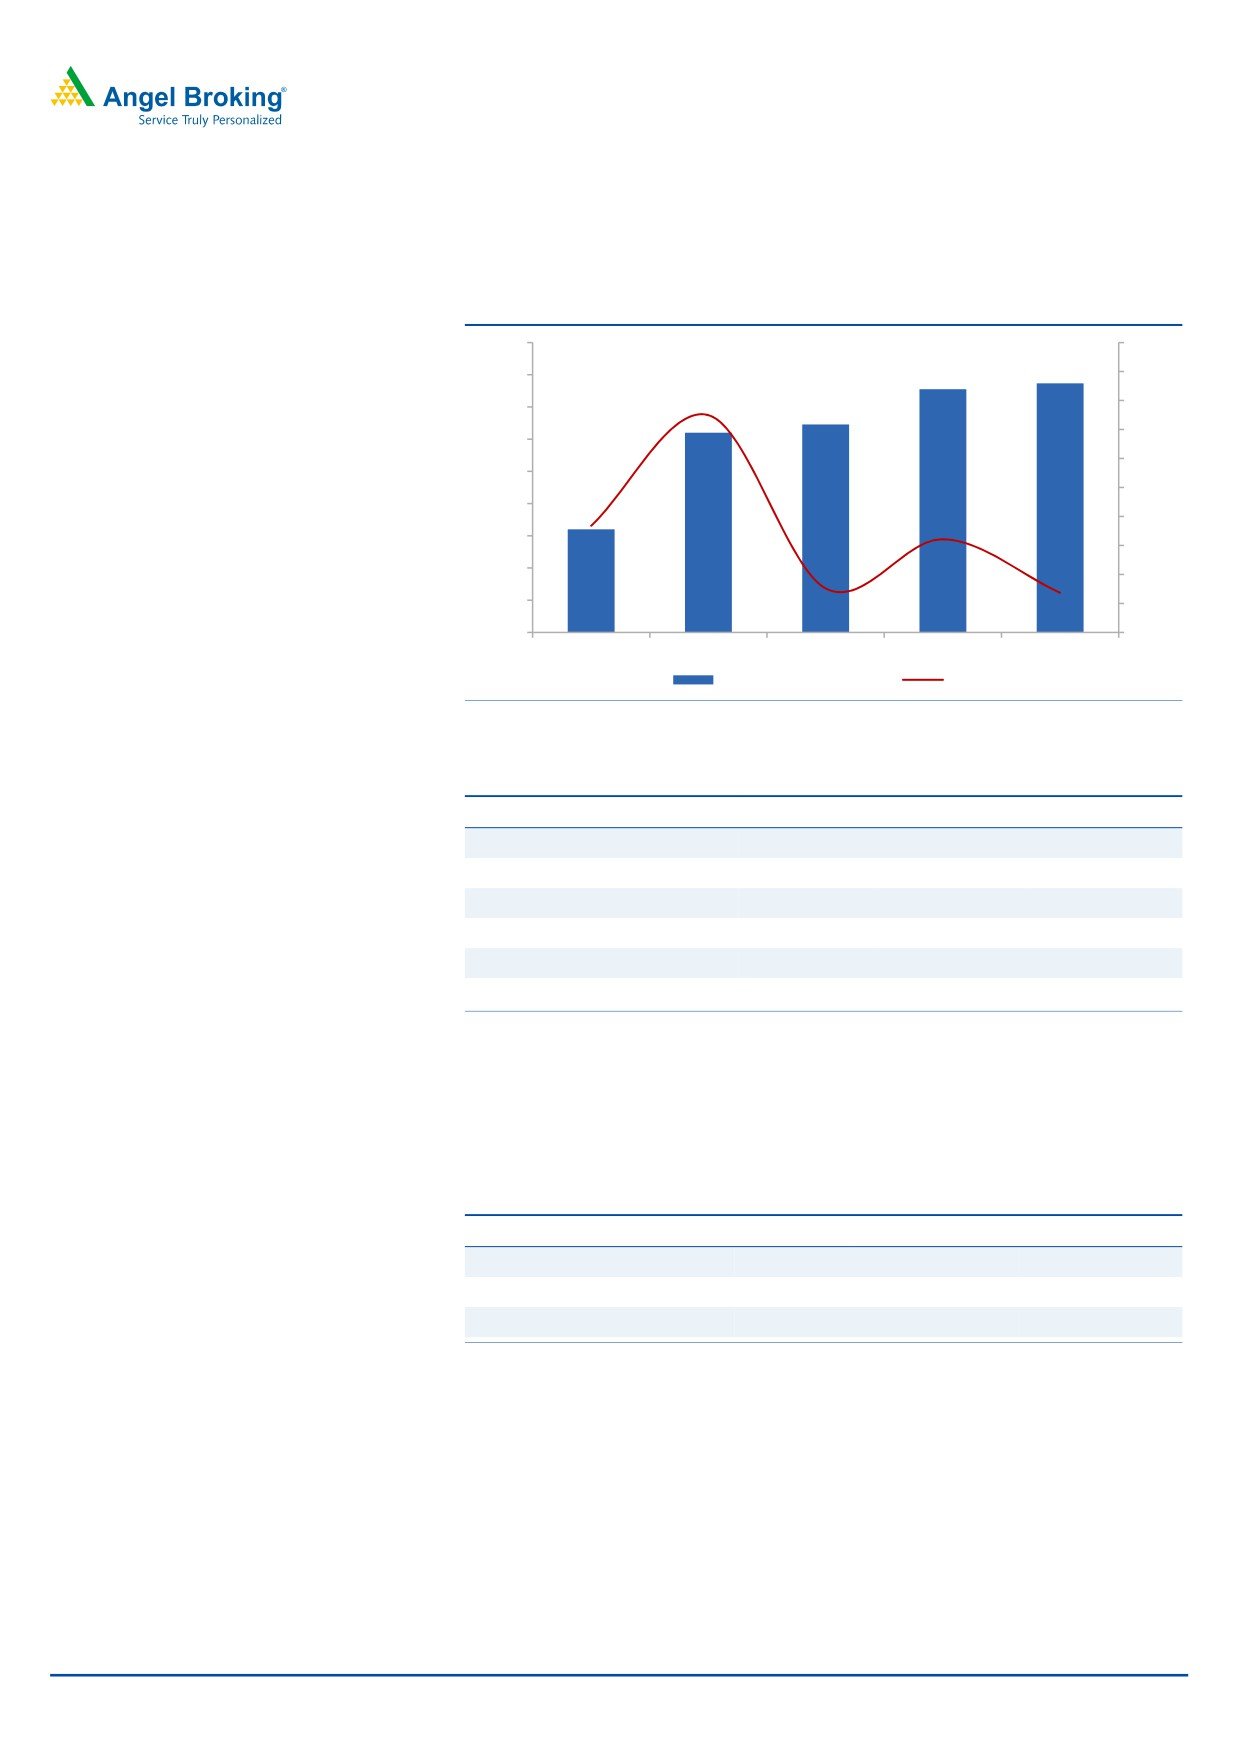
Exhibit 3: Trend in revenue growth
1,040
9.0%
1,020
8.0%
7.0%
1,000
6.5%
6.0%
980
5.0%
960
4.0%
940
3.0%
2.7%
920
2.2%
2.0%
900
1.0%
880
0.4%
0.5%
0.0%
860
-1.0%
3QFY15
4QFY15
1QFY16
2QFY16
3QFY16
Sales ( in US $mn)
qoq (%)
Source: Company, Angel Research
Exhibit 4: Growth in industry segments
Particulars
% to revenue
% growth (qoq)
% growth (yoy)
Telecom
51
(2.7)
10.7
Manufacturing
17
2.8
(4.7)
TME
7
(9.4)
11.3
BFSI
10
2.5
9.8
RTL
7
13.7
16.7
Others
8
15.6
39.1
Source: Company, Angel Research
In terms of geographies, ROW posted a qoq growth of 5.4%. Europe and the US
posted a 1.0% qoq and 1.9% qoq de-growth, respectively.
Exhibit 5: Growth trend in geographies
Particulars
% to revenue
% growth (qoq)
% growth (yoy)
Americas
48
(1.9)
7.6
Europe
29
(1.0)
1.1
RoW
23
5.4
27.6
Source: Company, Angel Research
Hiring and client metrics
During the quarter, the company reported a net addition of 1,902 employees,
taking its overall headcount to 1,07,137. The BPO headcount currently stands at
28,279 and was the only division to witness additions . Attrition (on LTM basis) was
at 20%.
February 23, 2016
3
Tech Mahindra | 3QFY2016 Result Update
Exhibit 6: Employee metrics
Particulars
3QFY15
4QFY15
1QFY16
2QFY16
3QFY16
Software professionals
67,592
72,952
71,997
71,657
71,892
BPO professionals
23,566
22,693
24,394
26,513
28,279
Sales & support
6,851
7,636
7,232
7,065
6,966
Total employees
98,009
1,03,281
1,03,673
1,05,235
1,07,137
Attritions (%)
19
19
19
20
20
Source: Company, Angel Research
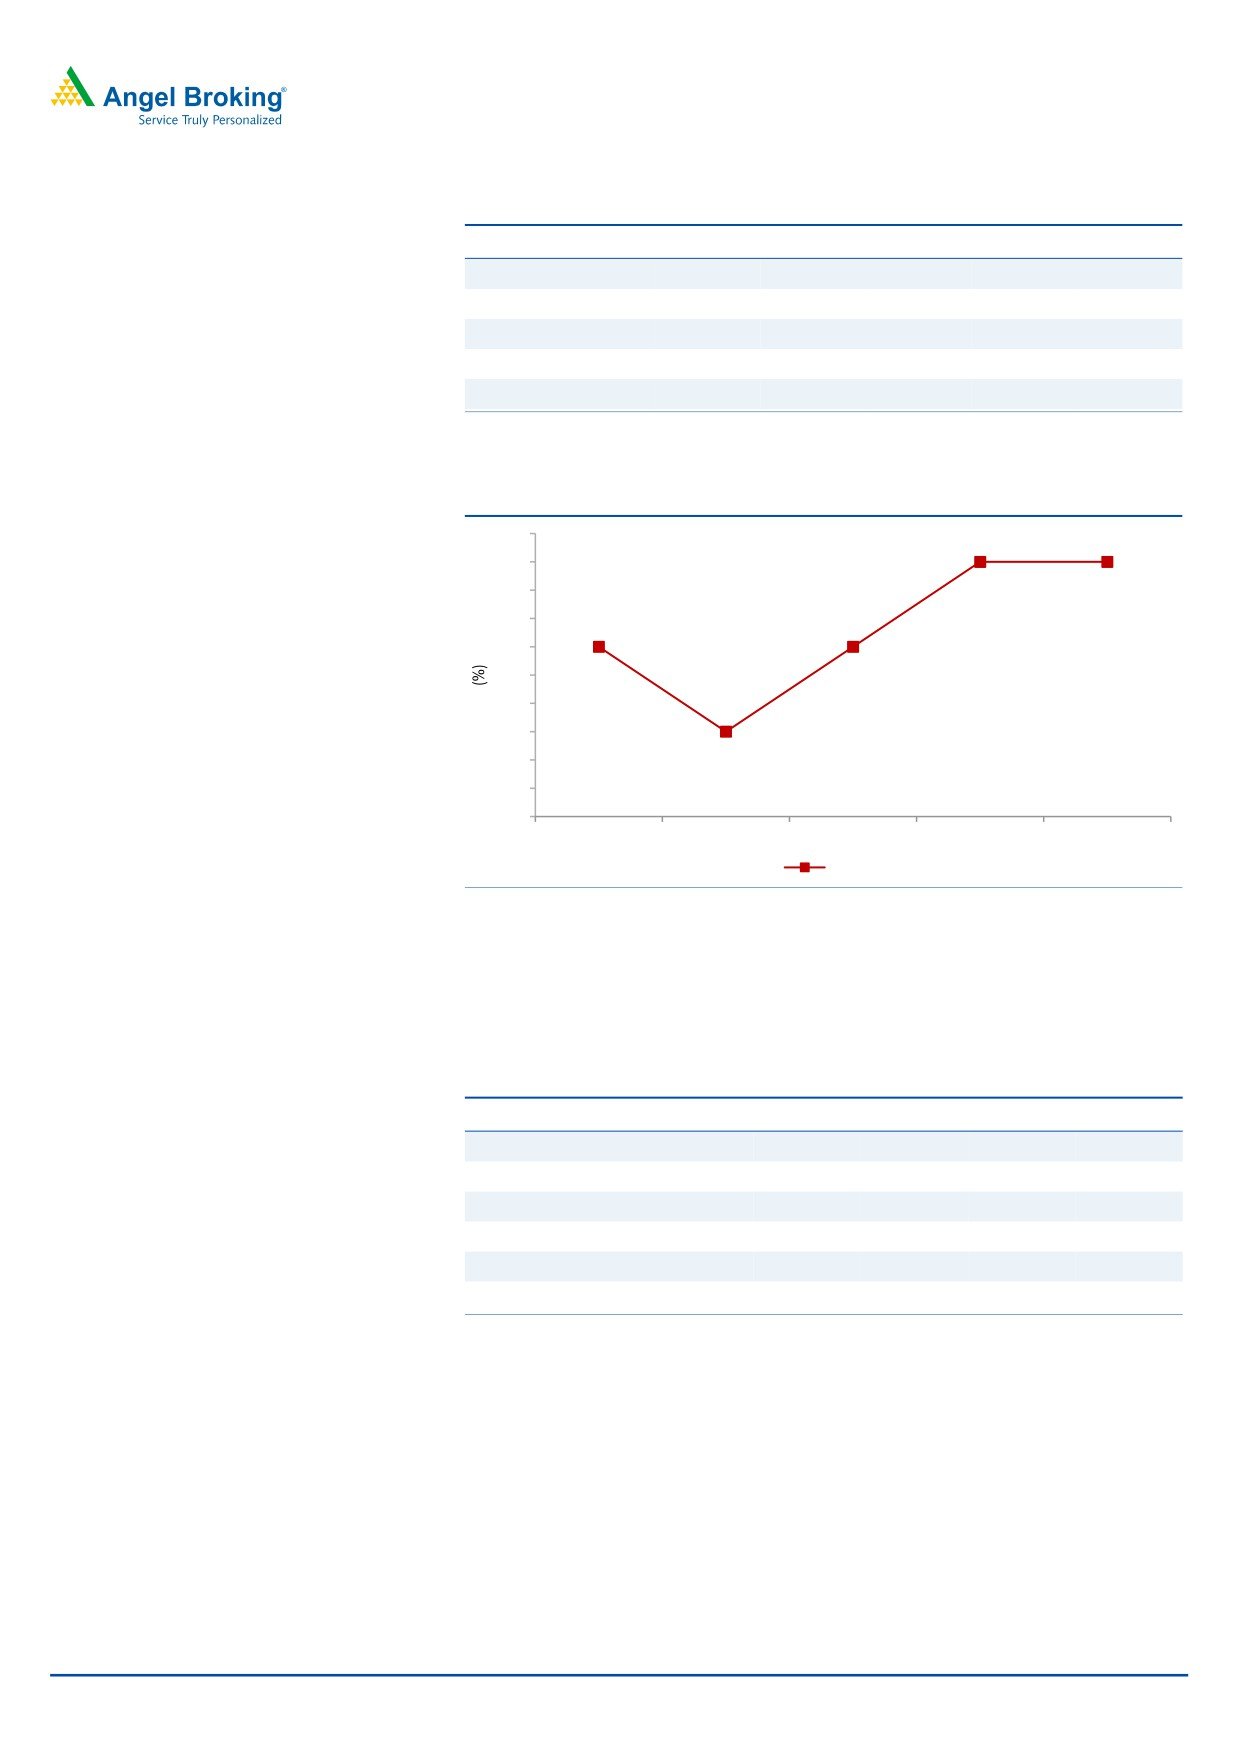
Exhibit 7: Trend in utilization rate
78
77
77
76
77
75
74
73
74
74
72
71
70
71
69
68
3QFY15
4QFY15
1QFY16
2QFY16
3QFY16
Utilization (%)
Source: Company, Angel Research
The company added 13 new clients during the quarter, taking the active client
base to 801 V/s 788 in 2QFY2016, with 1 client added in US$20-50mn+ bracket
and others mainly in the US$1-5mn+ bracket.
Exhibit 8: Client metrics
Particulars
3QFY15
4QFY14
1QFY16
2QFY16
3QFY16
Total active clients
674
767
770
788
801
US$1mn-5mn
166
195
195
196
221
US$5mn-10mn
37
40
41
40
42
US$10mn-20mn
19
21
24
26
26
US$20mn-50mn
19
22
23
22
23
US$50mn+
13
13
13
14
14
Source: Company, Angel Research
Operating margin expands
On the operating front, the EBDITA margin came in at 16.9% V/s an expected
17.2% and V/s 16.6% in 2QFY2016, a qoq expansion of 70bp. The EBIT margin
came in at 14.3% V/s an expected 14.2% and V/s 13.7% in 2QFY2016. During
the quarter, tailwinds of utilization, INR depreciation and SG&A leverage aided
margin expansion.
February 23, 2016
4
Tech Mahindra | 3QFY2016 Result Update
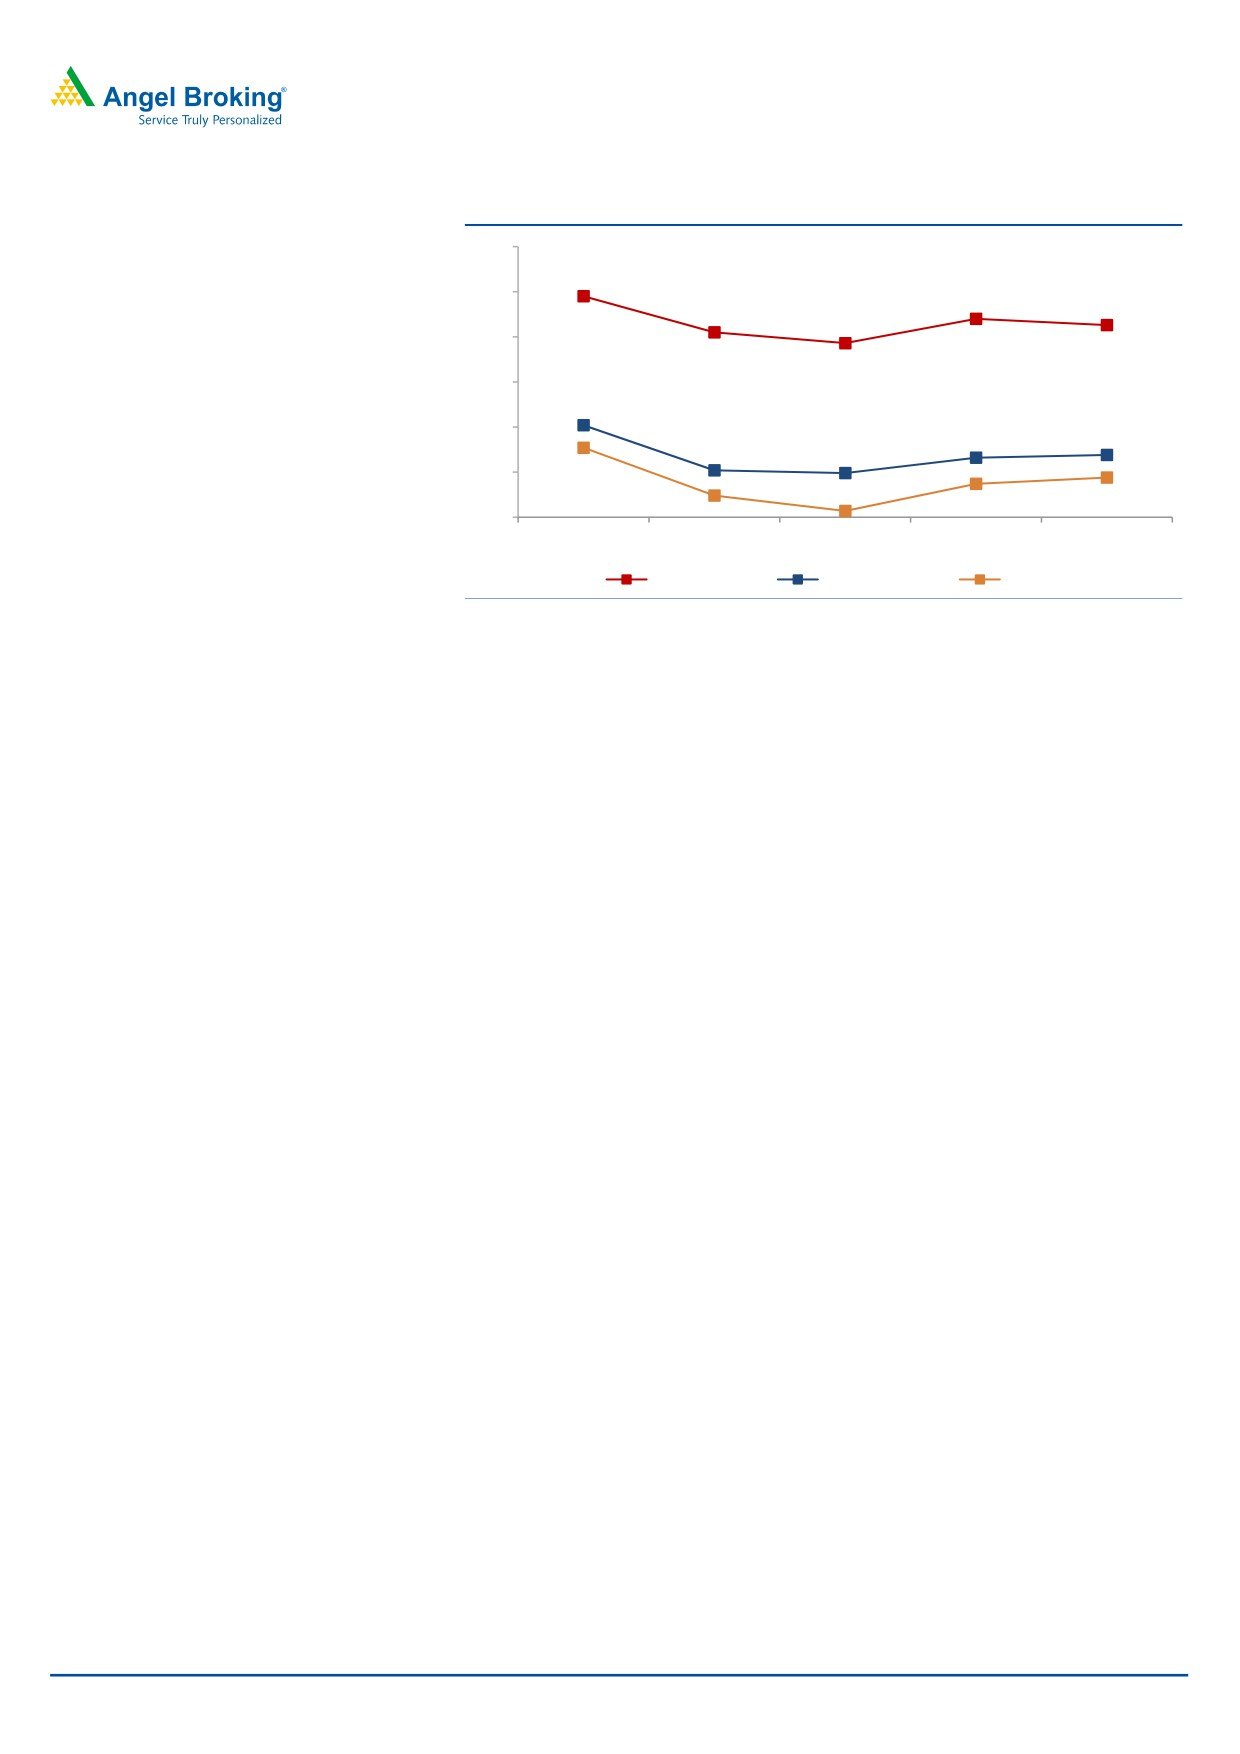
Exhibit 9: Margin trend (%)
40
35
34.5
30
32.0
31.3
30.5
29.3
25
20.2
20
16.6
16.9
15.2
14.9
15
17.7
14.4
10.7
13.7
12.4
10
3QFY15
4QFY15
1QFY16
2QFY16
3QFY16
Gross margin
EBITDA margin
EBIT margin
Source: Company, Angel Research
Investment arguments
Growth prospects robust: The Management indicated that the company remains
confident of growth in the non-BT business with it continuing to see a robust deal
pipeline across geographies. Also, the company, in the recent past, has been
looking at inorganic mode to enhance its presence in the non-telecom segment.
Tech Mahindra has been able to scale up well across verticals through its focused
approach on large deals. We expect a CAGR of 10.3% and 13.6% in USD and
INR revenue, respectively, over FY2015-17E.
Deal pipeline healthy: Tech Mahindra remains confident of improving revenue
growth, citing healthy deal pipeline along with pick up in discretionary spending,
primarily in the US. The Management sounded confident of demand from BFSI,
Healthcare, Manufacturing and Retail. Tech Mahindra is following a two-pronged
strategy to expand its enterprise business; ie providing end-to-end offerings in
leadership areas like Manufacturing, and following a niche offerings-led entry
strategy in areas like BFSI where it is a challenger. Better cross-sell of services can
help grow marquee accounts post-merger. We expect the enterprise segment
growth to be led by broader revival in the markets and deepening of existing
relationships. During 3QFY2016 the company won deals worth TCV of
US$275mn, mainly from the enterprise vertical.
Inorganic growth initiatives to augment well for company: The company has been
active in the M&A space, with it having acquired Satyam a few years back, to
acquiring LCC and Softgen recently. Softgen’s and LCC’s acquisition was
consolidated in 4QFY2015. LCC is one of the world’s largest independent global
providers of network engineering services to the telecommunications industry. LCC
is estimated to have annual revenues of more than US$400mn (CY2014), with
workforce of over 5,700 network professionals across five continents and more
than 50 countries. With this acquisition, Tech Mahindra will also be addressing a
rapidly growing market opportunity as telecommunications companies and
enterprises accelerate their network upgrade cycle.
February 23, 2016
5
Tech Mahindra | 3QFY2016 Result Update
Outlook and valuation
Given the recent acquisitions and healthy order pipeline, the company is expected
to post a healthy US$ and INR CAGR of 10.3% and 13.6%, respectively, over
FY2015-17. However, the acquisition of LCC will be margin dilutive in the near
term, leading the FY2016E EBDIT margin to drop to 16.2% from 22.2% in
FY2014. The company, given its success in turnaround of its earlier acquisition -
Satyam, believes it would be able to do the same with the recent acquisitions and
would be able to get close to achieving the 20.0% EBIT levels in future. The
company is one of the fastest growing IT companies. Given the conducive
valuation on EV/sales front, where it trades at a significant discount to its peers, we
believe the stock should witness uptrend once the profitability returns to its mean
average. We recommend a Buy rating on the stock.
Exhibit 10: Key assumptions
FY2016E
FY2017E
Revenue growth (US$)
10.7
10.0
USD-INR rate (realized)
65.0
65.0
Revenue growth (`)
17.3
10.0
EBITDA margin (%)
16.2
17.0
Tax rate (%)
23.4
23.4
EPS growth (%)
5.4
16.4
Source: Company, Angel Research
Exhibit 11: One-year forward PE (x)
800
600
400
200
0
Nov-08
Sep-09
Jul-10
May-11
Mar-12
Dec-12
Oct-13
Aug-14
Jun-15
Price
20
17
14
11
8
Source: Company, Angel Research. Note: P/E includes profits of Mahindra Satyam from FY2012
February 23, 2016
6
Tech Mahindra | 3QFY2016 Result Update
Exhibit 12: Recommendation summary
Company
Reco
CMP Tgt Price Upside
FY2017E FY2017E
FY2015-17E
FY2017E FY2017E
(`)
(`)
(%)
EBITDA (%)
P/E (x)
EPS CAGR (%)
EV/Sales (x)
RoE (%)
HCL Tech
Buy
850
1,038
22.1
21.5
14.7
6.0
2.0
18.8
Infosys
Buy
1,126
1,347
19.7
27.5
17.1
10.6
2.9
20.1
TCS
Buy
2,320
2,854
23.0
28.5
16.8
11.8
3.3
38.9
Tech Mahindra
Buy
440
530
20.5
17.0
13.1
10.8
1.2
19.1
Wipro
Buy
547
670
22.5
23.8
13.0
9.7
1.7
17.2
Source: Company, Angel Research.
Company Background
Tech Mahindra was founded in 1986 as a joint venture between Mahindra Group
and British Telecom (BT) to service the latter. Later on, the company started
servicing other external clients as well (solely in the telecom industry).In June 2009,
Tech Mahindra acquired a 42.7% stake in erstwhile Satyam Computers (now
Mahindra Satyam) and now the latter is entirely merged with the company.
The company has recently acquired the companies - LCC and Softgen. These two
acquisitions have been consolidated in 4QFY2015. LCC is one of the world’s
largest independent global providers of network engineering services to the
telecommunications industry. LCC is estimated to have annual revenues of more
than US$400mn (CY2014), with workforce of over 5,700 network professionals
across five continents and more than 50 countries.
February 23, 2016
7
Tech Mahindra | 3QFY2016 Result Update
Profit and loss statement (Consolidated, Indian GAAP)
Y/E March (` cr)
FY2013 FY2014E FY2015 FY2016E FY2017E
Net sales
14,332
18,831
22,621
26,524
29,177
Cost of revenues
9,001
10,790
11,914
18,036
19,548
Gross profit
5,331
8,042
10,708
8,488
9,628
% of net sales
37.2
42.7
47.3
32.0
33.0
SG&A expenses
2,268
2,459
6,555
4,191
4,668
% of net sales
15.8
13.1
29.0
15.8
16.0
EBITDA
3,063
5,582
4,153
4,297
4,960
% of net sales
21.4
29.6
18.4
16.2
17.0
Depreciation and amortization
390
522
611
716
788
% of net sales
2.7
2.8
2.7
2.7
2.7
EBIT
2,674
5,060
3,541
3,581
4,172
% of net sales
18.7
26.9
15.7
13.5
14.3
Interest expense
92
43
30
30
30
Other inc., net of forex gain/(loss)
212
113
106
106
106
Profit before tax
2,793
5,130
3,618
3,657
4,249
Provision for tax
648
775
960
856
994
% of PBT
23.2
15.1
26.5
23.4
23.4
PAT
2,146
4,355
2,659
2,802
3,255
Exceptional item
160
120
-
-
-
Minority interest
30
14
31
31
31
Reported PAT
1,955
4,461
2,628
2,771
3,224
Adjusted PAT
2,115
2,932
2,628
2,771
3,224
Fully diluted EPS (`)
22.0
30.5
27.4
28.8
33.6
February 23, 2016
8
Tech Mahindra | 3QFY2016 Result Update
Balance sheet (Consolidated, Indian GAAP)
Y/E March (` cr)
FY2013
FY2014
FY2015
FY2016E
FY2017E
Equity capital
232
234
480
480
480
Preference capital
-
-
-
-
-
Share premium
-
-
-
-
-
Profit and loss
6,621
8,947
11,768
13,864
16,414
Other reserves
-
2
0
0
0
Net worth
6,854
9,182
12,249
14,345
16,894
Secured loans
322
309
621
621
621
Unsecured loans
531
54
54
54
55
Total debt
853
363
675
675
676
Other long term liability
224
376
376
376
377
Long-term provisions
393
414
414
414
415
Minority interest
134
144
160
144
145
Amount pending investigation
1,230
1,230
895
895
895
Total capital employed
9,689
11,709
14,768
16,848
19,401
Gross block
3,611
5,460
7,811
8,811
9,811
Accumulated dep.
(1,379)
(2,866)
(3,477)
(4,193)
(4,981)
Net block
2,232
2,594
4,334
4,618
4,830
Capital WIP
260
266
266
266
267
Total fixed assets
2,491
2,861
4,601
4,884
5,098
Investments
36
36
2,103
2,103
2,103
Long term loans and adv.
743
914
1,306
1,502
1,727
Interest in TML benefit trust
1,207
-
-
-
-
Deferred tax asset, net
348
383
390
390
390
Other non-current assets
120
16
-
-
-
Inventories
11
10
24
11
11
Sundry debtors
3,369
4,349
5,206
5,987
6,885
Cash and cash equv.
3,463
4,756
2,405
4,815
6,907
Loans and advances
1,293
2,616
3,813
2,998
2,999
Current investments
175
-
-
-
-
Unbilled revenue
556
-
-
-
-
Sundry creditors
(858)
(1,549)
(1,654)
(1,903)
(2,188)
Other liabilities
(2,037)
(1,415)
(1,627)
(1,871)
(2,152)
Provision
(1,227)
(1,267)
(1,799)
(2,068)
(2,379)
Working capital
4,744
7,500
6,368
7,969
10,083
Total capital deployed
9,689
11,709
14,768
16,848
19,401
February 23, 2016
9
Tech Mahindra | 3QFY2016 Result Update
Cash flow statement (Consolidated, Indian GAAP)
Y/E March (` cr)
FY2013
FY2014
FY2015
FY2016E
FY2017E
Pre tax profit from operations
2,581
4,355
2,659
2,802
3,255
Depreciation
390
522
611
716
788
Exp. (deffered)/written off/others
-
-
-
-
-
Pre tax cash from operations
2,971
4,877
3,270
3,518
4,042
Other income/prior period ad
182
113
106
106
106
Net cash from operations
3,153
4,990
3,376
3,624
4,149
Tax
(648)
(775)
(960)
(856)
(994)
Cash profits
2,505
4,215
2,417
2,768
3,155
(Inc)/dec in
Sundry Debtors
(647)
(980)
(857)
(781)
(898)
Inventories
4
1
(15)
13
-
Loans and advances
(235)
(1,324)
(1,197)
815
(1)
Sundry creditors
167
692
105
248
285
Others
673
(623)
212
244
281
Net trade working capital
(39)
(2,233)
(1,752)
540
(333)
Cashflow from operating activities
2,466
1,981
665
3,308
2,822
(Inc)/dec in fixed assets
(1,025)
(369)
(1,740)
(284)
(213)
(Inc)/dec in investments
(1)
-
(2,067)
-
-
(Inc)/dec in other non current assets
(611)
104
16
-
-
Cashflow from investing activities
(1,636)
(265)
(3,791)
(284)
(213)
Inc/(dec) in debt
(297)
490
(311)
-
(1)
Inc/(dec) in deferred revenue
(207)
-
-
-
1
Inc/(dec) in equity/premium
1
(2)
1
-
-
Inc/(dec) in minority interest
119
(9)
(16)
16
(1)
Addition to reser. on amalgamation
70
-
-
-
1
Dividends
(149)
(231)
(674)
(674)
(674)
Others
(670)
1,776
44
158
Cashflow from financing activities
(463)
(423)
775
(614)
(516)
Cash generated/(utilised)
367
1,293
(2,351)
2,410
2,092
Cash at start of the year
3,096
3,463
4,756
2,405
4,815
Cash at end of the year
3,463
4,756
2,405
4,815
6,907
February 23, 2016
10
Tech Mahindra | 3QFY2016 Result Update
Key Ratios
Y/E March
FY2013
FY2014
FY2015
FY2016E
FY2017E
Valuation ratio (x)
P/E (on FDEPS)
20.0
14.4
16.1
15.2
13.1
P/CEPS
18.0
8.5
13.0
12.1
10.5
P/BVPS
6.2
4.6
3.4
2.9
2.5
Dividend yield (%)
1.1
1.1
1.1
1.1
1.4
EV/Sales
2.8
2.0
1.8
1.4
1.2
EV/EBITDA
13.0
6.8
9.8
8.9
7.3
EV/Total assets
16.0
13.3
8.9
7.9
7.1
Per share data (`)
EPS
22.0
30.5
27.4
28.8
33.6
Cash EPS
24.4
51.9
33.7
36.3
41.8
Dividend
5.0
5.0
5.0
5.0
6.0
Book value
71.3
95.6
127.5
149.3
175.9
Dupont analysis
Tax retention ratio (PAT/PBT)
0.7
0.9
0.7
0.8
0.8
Cost of debt (PBT/EBIT)
1.0
1.0
1.0
1.0
1.0
EBIT margin (EBIT/Sales)
0.2
0.3
0.2
0.1
0.1
Asset turnover ratio (Sales/Assets)
5.8
6.6
4.9
5.4
5.7
Leverage ratio (Assets/Equity)
0.4
0.3
0.4
0.3
0.3
Operating ROE (%)
28.5
48.6
21.5
19.3
19.1
Return ratios (%)
RoCE (pre-tax)
27.6
43.2
24.0
21.3
21.5
Angel RoIC
46.2
75.7
29.3
30.4
34.1
RoE
30.9
31.9
21.5
19.3
19.1
Turnover ratios( x)
Asset turnover (fixed assets)
5.8
6.6
4.9
5.4
5.7
Receivables days
78
78
92
89
90
Payable days
25
26
29
28
29
February 23, 2016
11
Tech Mahindra | 3QFY2016 Result Update
Research Team Tel: 022 - 39357800
DISCLAIMER
Angel Broking Private Limited (hereinafter referred to as “Angel”) is a registered Member of National Stock Exchange of India Limited,
Bombay Stock Exchange Limited and Metropolitan Stock Exchange of India Limited. It is also registered as a Depository Participant with
CDSL and Portfolio Manager with SEBI. It also has registration with AMFI as a Mutual Fund Distributor. Angel Broking Private Limited is
a registered entity with SEBI for Research Analyst in terms of SEBI (Research Analyst) Regulations, 2014 vide registration number
INH000000164. Angel or its associates has not been debarred/ suspended by SEBI or any other regulatory authority for accessing
/dealing in securities Market. Angel or its associates including its relatives/analyst do not hold any financial interest/beneficial
ownership of more than 1% in the company covered by Analyst. Angel or its associates/analyst has not received any compensation /
managed or co-managed public offering of securities of the company covered by Analyst during the past twelve months. Angel/analyst
has not served as an officer, director or employee of company covered by Analyst and has not been engaged in market making activity
of the company covered by Analyst.
This document is solely for the personal information of the recipient, and must not be singularly used as the basis of any investment
decision. Nothing in this document should be construed as investment or financial advice. Each recipient of this document should
make such investigations as they deem necessary to arrive at an independent evaluation of an investment in the securities of the
companies referred to in this document (including the merits and risks involved), and should consult their own advisors to determine
the merits and risks of such an investment.
Reports based on technical and derivative analysis center on studying charts of a stock's price movement, outstanding positions and
trading volume, as opposed to focusing on a company's fundamentals and, as such, may not match with a report on a company's
fundamentals.
The information in this document has been printed on the basis of publicly available information, internal data and other reliable
sources believed to be true, but we do not represent that it is accurate or complete and it should not be relied on as such, as this
document is for general guidance only. Angel Broking Pvt. Limited or any of its affiliates/ group companies shall not be in any way
responsible for any loss or damage that may arise to any person from any inadvertent error in the information contained in this report.
Angel Broking Pvt. Limited has not independently verified all the information contained within this document. Accordingly, we cannot
testify, nor make any representation or warranty, express or implied, to the accuracy, contents or data contained within this document.
While Angel Broking Pvt. Limited endeavors to update on a reasonable basis the information discussed in this material, there may be
regulatory, compliance, or other reasons that prevent us from doing so.
This document is being supplied to you solely for your information, and its contents, information or data may not be reproduced,
redistributed or passed on, directly or indirectly.
Neither Angel Broking Pvt. Limited, nor its directors, employees or affiliates shall be liable for any loss or damage that may arise from
or in connection with the use of this information.
Note: Please refer to the important ‘Stock Holding Disclosure' report on the Angel website (Research Section). Also, please refer to the
latest update on respective stocks for the disclosure status in respect of those stocks. Angel Broking Pvt. Limited and its affiliates may
have investment positions in the stocks recommended in this report.
Disclosure of Interest Statement
Tech Mahindra
1. Analyst ownership of the stock
No
2. Angel and its Group companies ownership of the stock
No
3. Angel and its Group companies' Directors ownership of the stock
No
4. Broking relationship with company covered
No
Note: We have not considered any Exposure below ` 1 lakh for Angel, its Group companies and Directors
Ratings (Based on expected returns
Buy (> 15%)
Accumulate (5% to 15%)
Neutral (-5 to 5%)
over 12 months investment period):
Reduce (-5% to -15%)
Sell (< -15%)
February 23, 2016
12