2QFY2017 Result Update | IT
November 2, 2016
Tech Mahindra
BUY
CMP
`434
Performance Highlights
Target Price
`600
(` cr)
2QFY17 1QFY17
% chg (QoQ) 2QFY16
% chg (YoY)
Investment Period
12 Months
Net revenue
7,167
6,921
3.6
6,294
13.9
EBITDA
1,070
1,029
4.0
935
14.4
Stock Info
EBITDA margin (%)
14.9
14.6
(22)bps
14.9
(21)bps
Sector
IT
Adj. PAT
645
750
(14.0)
676
(4.6)
Market Cap (` cr)
42,141
Source: Company, Angel Research;
Net Debt (` cr)
(6,370)
Tech Mahindra is expected to post sales of US$107mn (vs. US$106mn expected),
Beta
0.9
registering a qoq growth of 4.0%. In Constant Currency (CC) terms, the company
52 Week High / Low
569/405
posted a qoq growth of 5.0%. The EBIDTA margin came in at 14.9% (vs. 14.6%
Avg. Daily Volume
219,894
expected vs. 14.6% in 1QFY2017). Margins adjusting for one-time restricting
Face Value (`)
5
expenses came in at 16.1%, an expansion of 120bps. Consequently, the PAT
BSE Sensex
27,877
came in at `645cr (vs. `755cr expected vs. `750cr in 1QFY2017), a decline of
Nifty
7,502
14.0% qoq. We maintain our Buy rating on the stock.
Reuters Code
TEML.BO
Bloomberg Code
TECHM@IN
Result highlights: Tech Mahindra is expected to post sales of US$107mn (vs.
US$106mn expected), registering a qoq growth of 4.0%. In Constant Currency
(CC) terms, the company posted a qoq growth of 5.0%. In INR terms, the
Shareholding Pattern (%)
company posted net revenue of `7,167cr (vs. `7,068cr expected vs. `6,921cr in
Promoters
36.3
1QFY2017), a qoq growth of 3.6%. In terms of geography, Europe was the key
MF / Banks / Indian Fls
12.4
driver contributing about 29.7% of sales in 2QFY2017 (vs. 28.3% in 1QFY2017)
FII / NRIs / OCBs
40.1
and in terms of Industry, Manufacturing contributing about 19.2% of sales in
Indian Public / Others
11.2
2QFY2017 (vs. 18.1% in 1QFY2017). The EBIDTA margin came in at 14.9% (vs.
14.6% expected vs. 14.6% in 1QFY2017). Margins adjusting for one-time
restricting expenses came in at 16.1%, an expansion of 120bps. Consequently,
Abs.(%)
3m 1yr
3yr
the PAT came in at `645cr (vs. `755cr expected vs. `750cr in 1QFY2017), a
Sensex
(0.5)
4.6
31.5
decline of 14.0% qoq.
Tech Mahindra
(11.5)
(19.6)
13.7
Outlook and valuation: We expect a CAGR of 10.6% and 11.5% in USD and
INR revenue, respectively, over FY2016-18E. The PAT is expected to grow at a
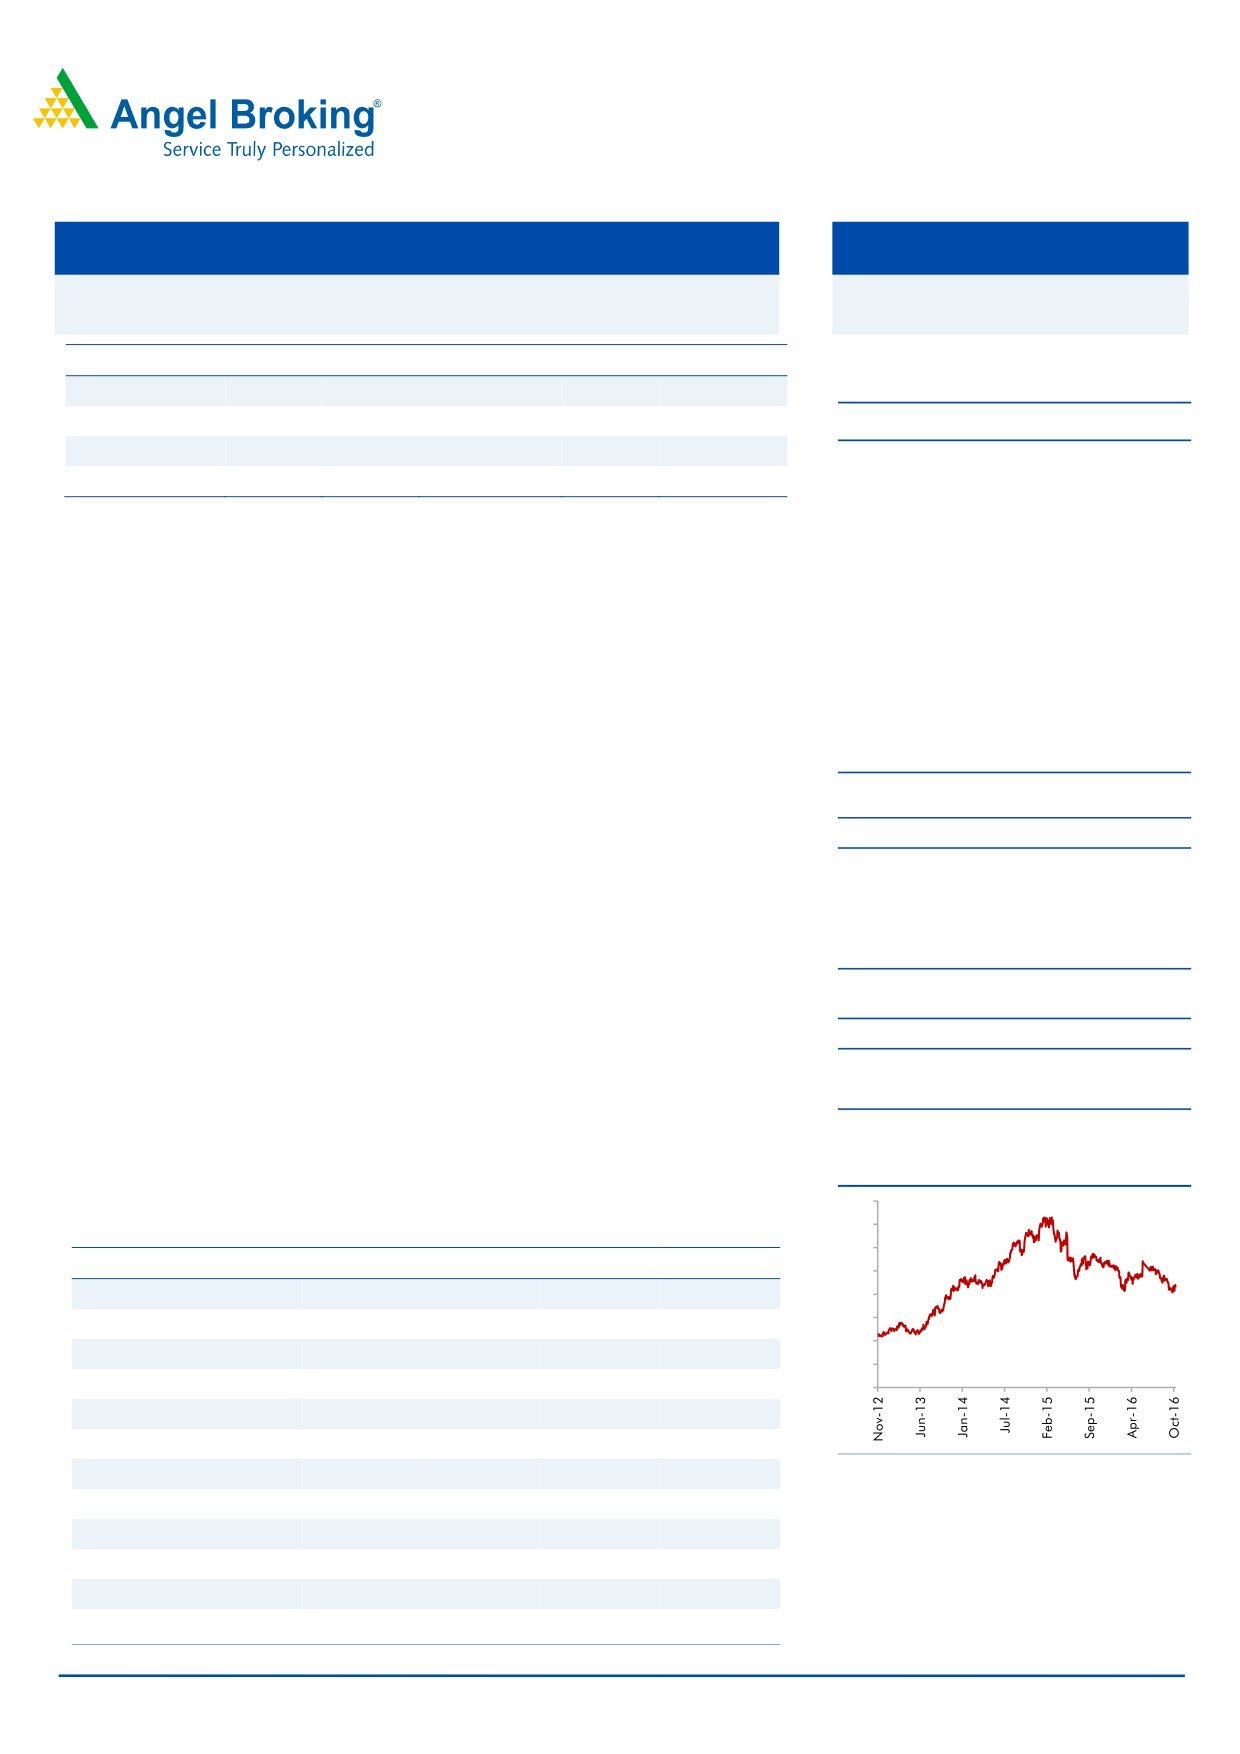
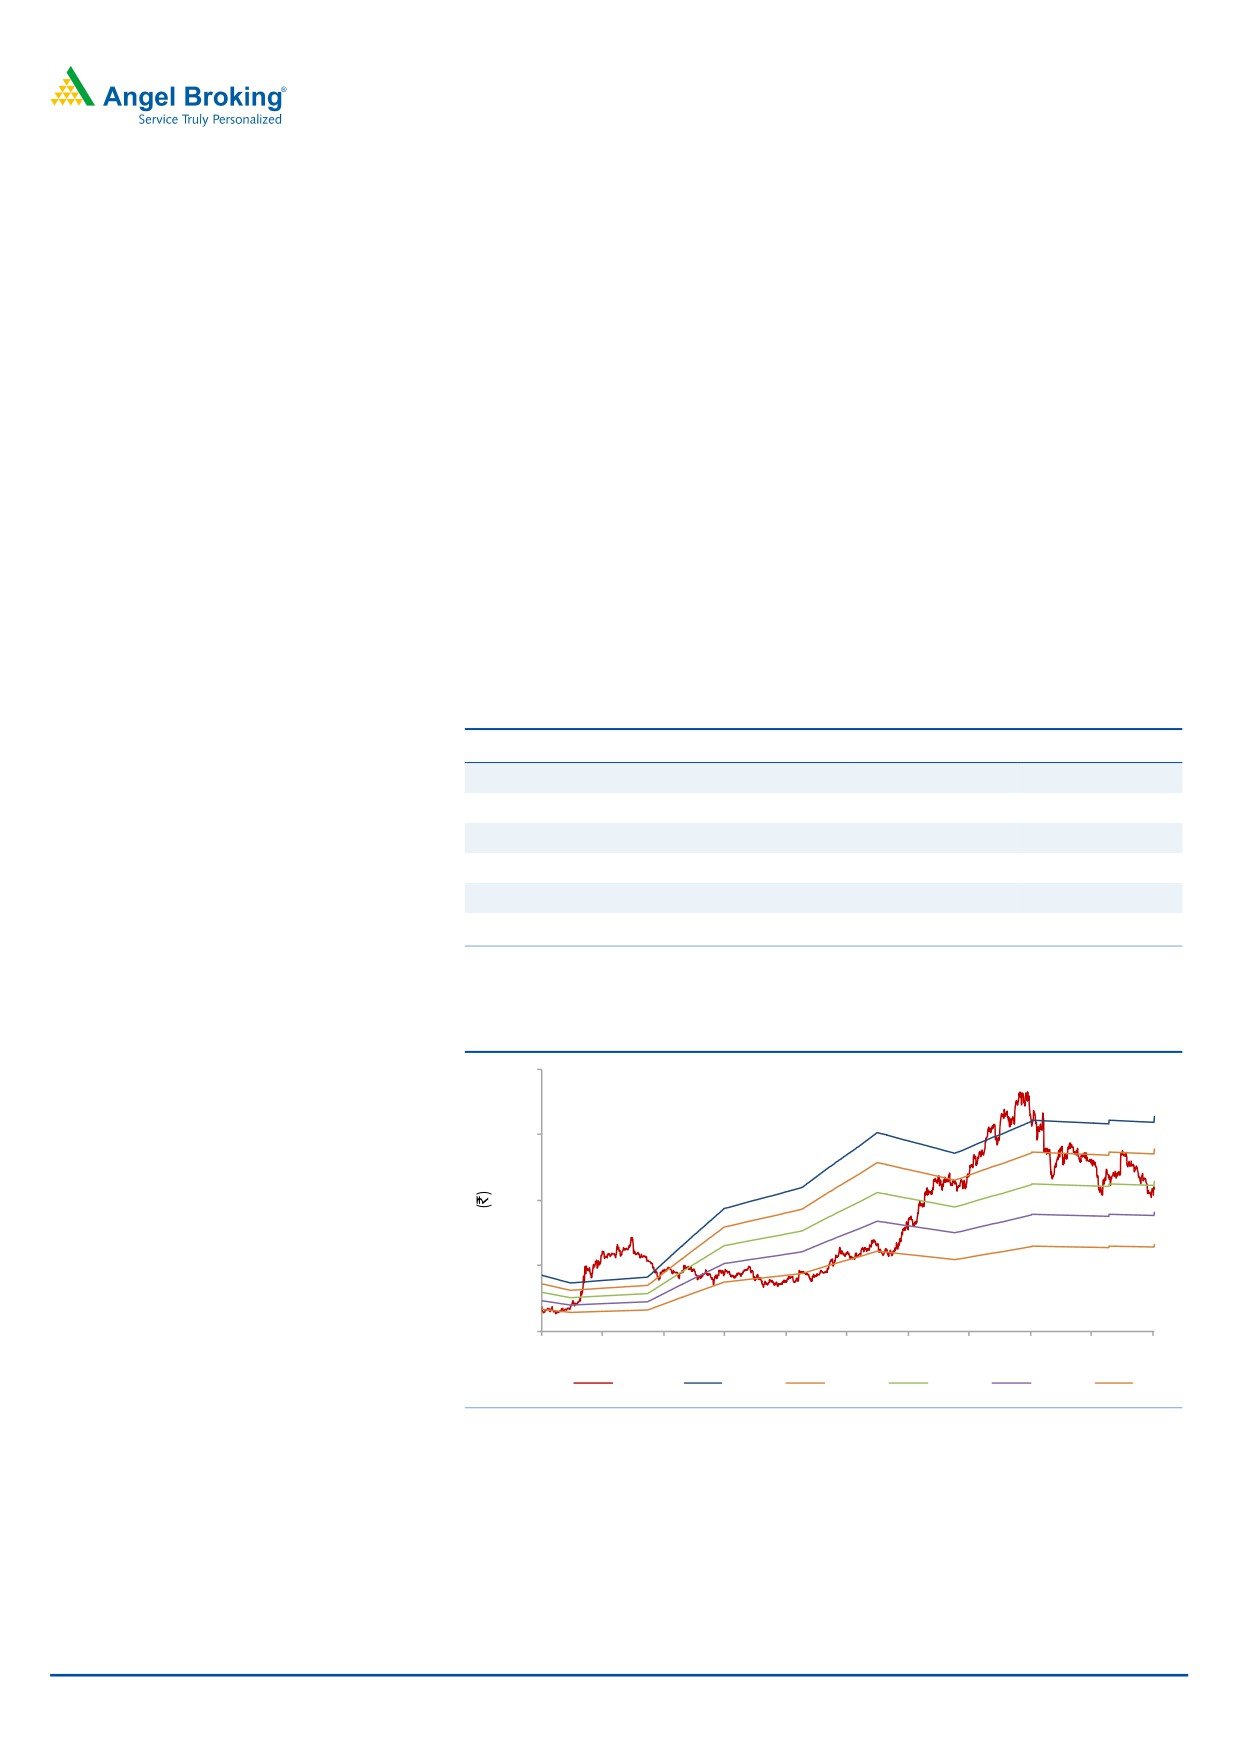
3-year price chart
CAGR of 11.4% over FY2016-18E. We maintain our Buy rating on the stock.
800
700
Key financials (Consolidated, Indian GAAP)
600
Y/E March (` cr)
FY2015
FY2016
FY2017E
FY2018E
500
Net sales
22,621
26,494
29,673
32,937
400
300
% chg
20.1
17.1
12.0
11.0
200
Net profit
2,628
3,118
3,173
3,866
100
% chg
(10.4)
18.7
1.8
21.9
0
EBITDA margin (%)
18.4
16.3
15.5
17.0
EPS (`)
27.1
32.2
32.8
39.9
P/E (x)
16.0
13.5
13.2
10.9
Source: Company, Angel Research
P/BV (x)
3.4
2.9
2.6
2.2
RoE (%)
21.5
21.7
19.6
20.7
RoCE (%)
24.0
20.8
19.8
21.7
Sarabjit kour Nangra
EV/Sales (x)
1.8
1.4
1.2
1.0
+91 22 3935 7800 Ext: 6806
EV/EBITDA (x)
9.7
8.7
7.9
6.1
Source: Company, Angel Research; Note: CMP as of November 1, 2016
Please refer to important disclosures at the end of this report
1
Tech Mahindra | 2QFY2017 Result Update
Exhibit 1: 2QFY2017 performance (Consolidated, Indian GAAP)
(` cr)
2QFY17
1QFY17
% chg (qoq)
2QFY16
% chg (yoy)
1HFY17 1HFY16
% chg (yoy)
Net revenue
7,167
6,921
3.6
6,616
8.3
14,088
12,909
9.1
Cost of revenue
4,972
4,881
1.9
4,500
10.5
9,852
8,944
10.2
Gross profit
2,196
2,040
7.6
2,116
3.8
4,236
3,965
6.8
SG&A expense
1,126
1,011
11.3
1,029
9.4
2,137
1,974
8.3
EBITDA
1,070
1,029
4.0
1,087
(1.5)
2,099
1,991
5.4
Dep. and amortization
245
202
21.2
197
24.2
447
369
21.1
EBIT
825
827
(0.2)
890
(8.6)
1,653
1,622
1.9
Interest
35
27
25.9
18
97.0
62
39
58.7
Other income
139
246
(43.6)
98
42.1
385
222
73.1
PBT
930
1,046
(11.1)
970
(5.5)
1,975
1,806
9.4
Income taxes
286
247
15.9
191
50.1
533
405
31.6
PAT
644
799
(19.4)
779
(18.9)
1,442
1,401
3.0
Minority interest
1
(46)
-
4
(65.8)
-
(3)
PAT after minority interest
645
752
(14.3)
776
(16.9)
1,442
1,403
2.8
Profit from associates
-
(2)
-
(2)
-
Exceptional item
-
-
-
-
-
Reported PAT
645
750
(14.0)
776
(16.9)
1,440
1,403
2.6
Adj. PAT
645
750
(14.0)
776
(16.9)
1,440
1,403
2.6
Diluted EPS
6.7
7.9
(14.5)
8.1
(16.9)
15.0
14.6
2.6
Gross margin (%)
30.6
29.3
138bp
32.0
(135)bps
30.1
30.7
(63)bp
EBITDA margin (%)
14.9
14.6
28bp
16.4
(150)bps
14.9
15.4
(87)bp
EBIT margin (%)
11.5
11.7
(23)bp
13.4
(193)bps
11.7
12.6
(117)bp
PAT margin (%)
9.0
10.7
(168)bps
11.7
(273)bps
10.2
10.9
(110)bp
Source: Company, Angel Research
Exhibit 2: 2QFY2017 - Actual Vs Angel estimates
(` cr)
Actual
Estimate
% Var
Net revenue
7,167
7,068
1.4
EBITDA margin (%)
14.9
14.6
28bps
PAT
645
755
(14.5)
Source: Company, Angel Research
Revenue growth led by Europe
For 2QFY2017, the company posted sales of `7,167cr (vs. `7,068cr expected and
vs. `6,921cr in 1QFY2017), a qoq growth of 3.6%. In US$ terms, the revenue
posted sales of US$107mn (vs. US$106mn expected), registering a qoq growth of
4.0%. In Constant Currency (CC) terms, the company posted a qoq growth of
5.0%. Organic revenue growth was at 2.5% qoq and the contribution from
acquisitions tune to 2.5%.
The top-line growth was driven by Europe, which was 29.7% of sales (vs. 28.3% in
1QFY2017); while ROW was a drag constituting
~22.0% (vs.
22.8% in
1QFY2017). Both these geographies posted qoq growth of 9.1% and 0.3%,
respectively. USA, on other hand had contributed around ~48.3% (vs. ~49.0% in
1QFY2017), registering a qoq growth of 2.5%.
In terms of industries, Manufacturing and BFSI were the key drivers of top-line,
registering a qoq growth of
10.3% and
5.8%, respectively. Manufacturing
constituted ~19.2% of sales (vs. 18.1% in 1QFY2017), while BFSI contributed
~11.5% of sales (vs. 11.3% of sales in 1QFY2017). Retail, Transport and Logistics
November 2, 2016
2
Tech Mahindra | 2QFY2017 Result Update
contributed ~6.8% of sales (vs. 6.5% of sales in 1QFY2017), registering a qoq
growth of 8.8%. Communication, on the other hand, contributed ~48.4% of sales
(vs. 49.4% of sales in 1QFY2017), registering a qoq growth of 2.3%.
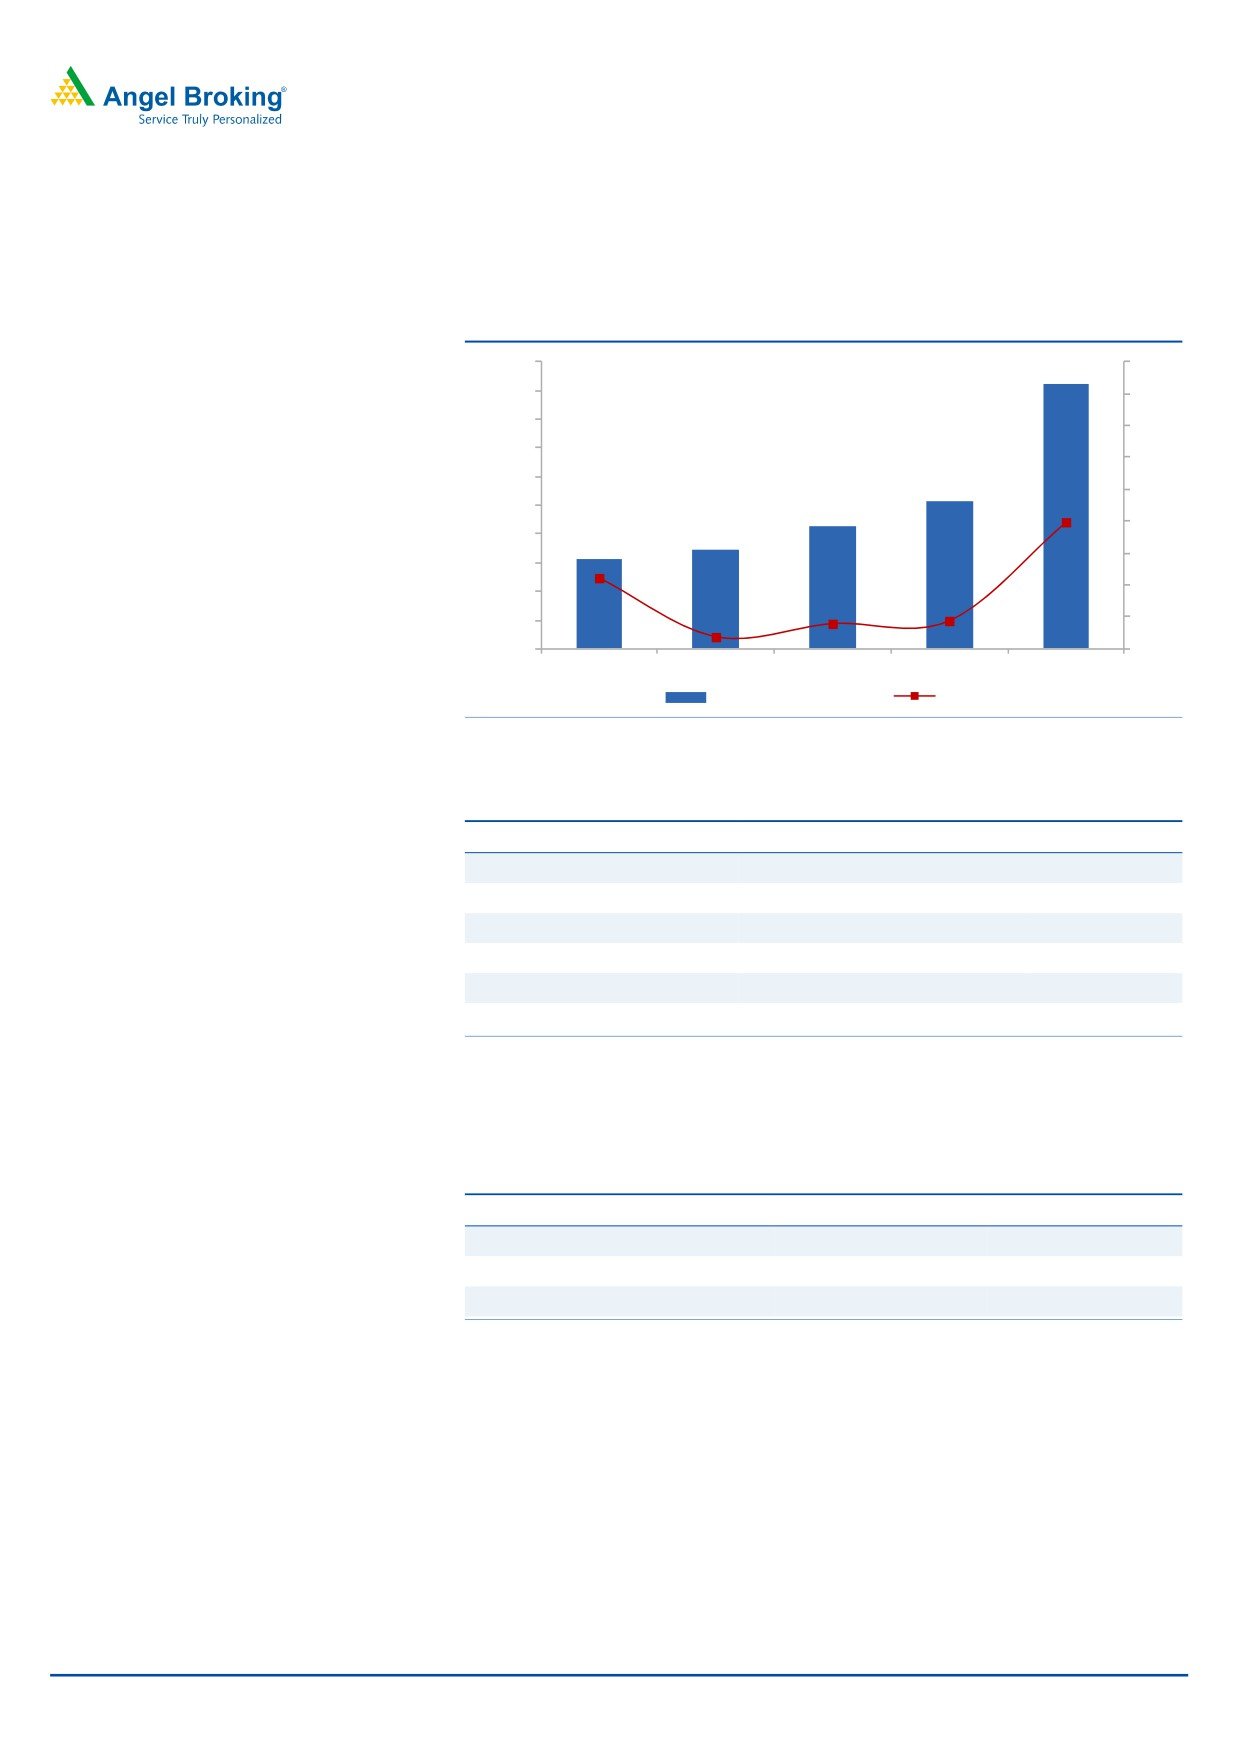
Exhibit 3: Trend in revenue growth
1080.0
1,072
9.0%
1070.0
8.0%
1060.0
7.0%
1050.0
6.0%
1040.0
1,032
5.0%
1030.0
1,023
4.0%
4.0%
1020.0
1,015
1,011
3.0%
1010.0
2.2%
2.0%
1000.0
0.8%
0.9%
1.0%
990.0
0.4%
980.0
0.0%
2QFY16
3QFY16
4QFY16
1QFY17
2QFY17
Sales ( in US $mn)
qoq (%)
Source: Company, Angel Research
Exhibit 4: Growth in industry segments
Particulars
% to revenue
% growth (QoQ)
% growth (YoY)
Telecom
48.4
2.3
(3.0)
Manufacturing
19.2
10.3
22.0
TME
7.2
(0.2)
(6..9)
BFSI
11.5
5.8
27.1
RTL
6.8
8.8
20.2
Others
6.8
(3.2)
9.3
Source: Company, Angel Research
In terms of geographies, ROW posted a growth of 0.3% qoq, while Europe and US
posted a growth of 9.1% and 2.5% qoq, respectively.
Exhibit 5: Growth trend in geographies
Particulars
% to revenue
% growth (QoQ)
% growth (YoY)
Americas
48.3
2.5
4.8
Europe
29.7
9.1
7.5
RoW
22.0
0.3
6.6
Source: Company, Angel Research
November 2, 2016
3
Tech Mahindra | 2QFY2017 Result Update
Hiring and client metrics
During the quarter, the company reported a net addition of 5,670 employees,
taking its overall headcount to 1,12,886. The BPO headcount currently stands at
27, 669 and was the only division to witness additions. Attrition (on LTM basis) was
at 19%.
Exhibit 6: Employee metrics
Particulars
2QFY16
3QFY16
4QFY16
1QFY17
2QFY17
Software professionals
71,657
71,892
72,125
73,590
78,404
BPO professionals
26,513
28,279
27,254
27,326
27,669
Sales & support
7,065
6,966
6,053
6,300
6,813
Total employees
1,05,235
1,07,137
105,432
107,216
112,886
Attritions (%)
20
20
21
21
19
Source: Company, Angel Research
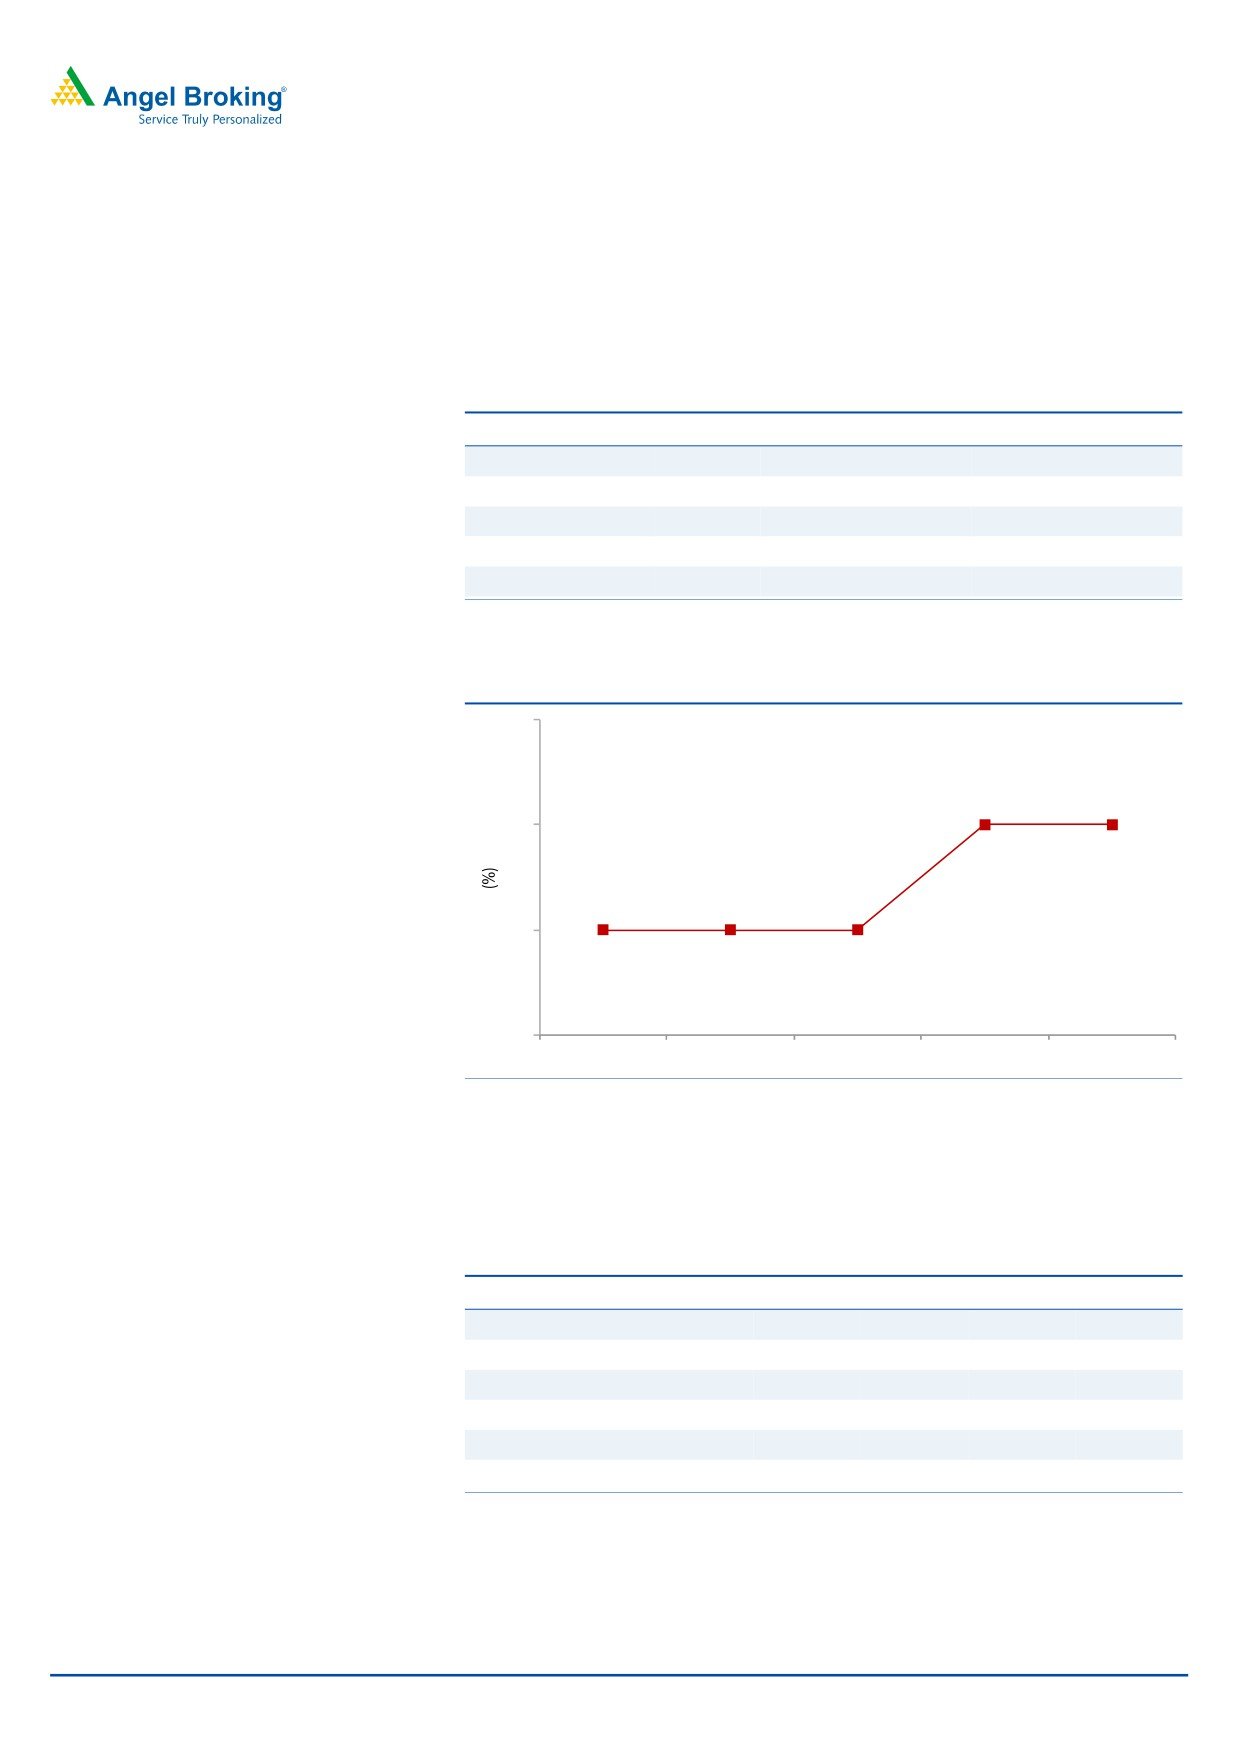
Exhibit 7: Trend in utilization rate
79
78
78
78
77
77
77
77
76
2QFY16
3QFY16
4QFY16
1QFY17
2QFY17
Source: Company, Angel Research
The company added 7 new clients during the quarter, taking the active client base
to 825 (vs. 818 in 1QFY2017), with 4 clients added in US$10mn-20mn+ bracket
and other additions mainly in the US$5mn-10mn+ bracket.
Exhibit 8: Client metrics
Particulars
2QFY16
3QFY16
4QFY16
1QFY17
2QFY17
Total active clients
767
801
807
818
825
US$1mn-5mn
195
221
207
197
221
US$5mn-10mn
40
42
49
56
54
US$10mn-20mn
21
26
23
22
26
US$20mn-50mn
22
23
26
28
26
US$50mn+
13
14
14
14
14
Source: Company, Angel Research
November 2, 2016
4
Tech Mahindra | 2QFY2017 Result Update
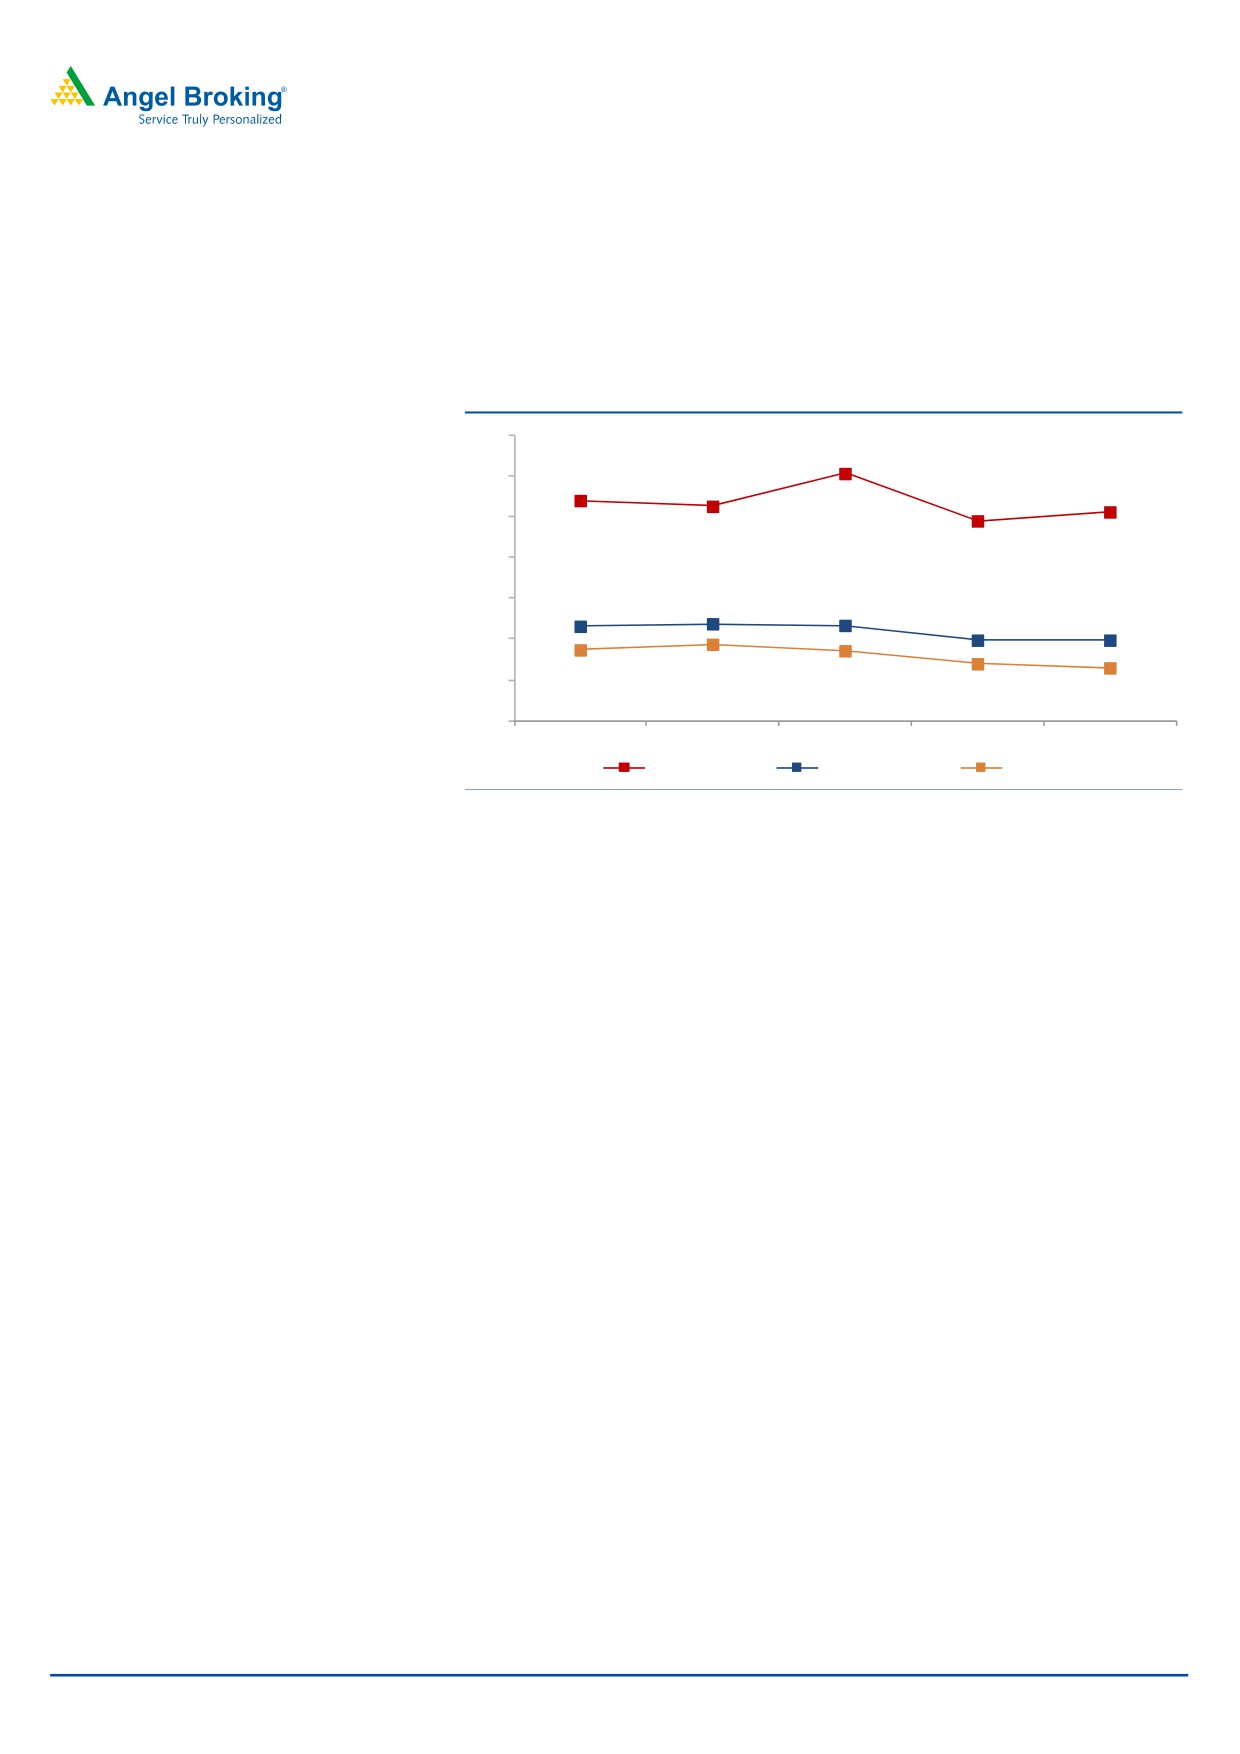
Operating margin expands
On the operating front, the EBDITA margin came in at 14.9%, a qoq expansion of
28bps. The EBIT margin came in at 11.5% (vs. 11.7% in 1QFY2017), while it was
down qoq 23bps. However, adjusting for onetime restructuring expenses the
EBDITA margin was 16.4%.
Exhibit 9: Margin trend (%)
40
35
35.3
30
32.0
31.3
30.6
29.5
25
20
16.6
16.9
16.7
14.9
14.9
15
13.7
14.4
13.6
10
12.0
11.5
5
2QFY16
3QFY16
4QFY16
1QFY17
2QFY17
Gross margin
EBITDA margin
EBIT margin
Source: Company, Angel Research
Investment arguments
Growth prospects decent; Brexit - a near term concern: The Management is more
optimistic about the Communications vertical (excluding LCC, where a lot of
portfolio rationalization has taken place). In the near term, the Management feels
Brexit could cause temporary instability and uncertainty; however it is too early to
call out any immediate business implications. We expect a CAGR of 10.6% and
11.5% in USD and INR revenue, respectively, over FY2016-18E.
Deal pipeline healthy: Tech Mahindra remains confident of improving revenue
growth, citing healthy deal pipeline along with pick up in discretionary spending,
primarily in the US. The Management sounded confident of demand from BFSI,
Healthcare, Manufacturing and Retail. Tech Mahindra is following a two-pronged
strategy to expand its enterprise business i.e., providing end-to-end offerings in
leadership areas like manufacturing and following a niche offerings-led entry
strategy in areas like BFSI, where it is a challenger. Better cross-sell of services can
help grow marquee accounts post the recent acquisitions. We expect the enterprise
segment growth to be led by broader revival in the markets and deepening of
existing relationships. During 2QFY2017 the company won deals worth TCV of
US$325mn. The pipeline has been healthy and most of the deals won are in
newer areas like product engineering, cloud, IoT and IMS.
Inorganic growth initiatives to augment well for company: The company has been
active in the M&A space, with it having acquired Satyam a few years back, to
acquiring LCC and Softgen recently. Softgen’s and LCC’s acquisition was
consolidated in 4QFY2015. LCC is one of the world’s largest independent global
providers of network engineering services to the telecommunications industry with
an estimated annual revenues of more than US$400mn (CY2014), with workforce
November 2, 2016
5
Tech Mahindra | 2QFY2017 Result Update
of over 5,700 network professionals across five continents and more than 50
countries. With this acquisition, Tech Mahindra will also be addressing a rapidly
growing market opportunity as telecommunications companies and enterprises
accelerate their network upgrade cycle.
Outlook and valuation
Given the recent acquisitions and healthy order pipeline, the company is expected
to post a healthy US$ and INR CAGR of 10.6% and 11.5%, respectively, over
FY2016-18E. However, the acquisition of LCC will be margin dilutive in the near
term, leading the FY2016 EBDIT margin to drop to 16.3% from 22.2% in FY2014.
The company, given its success in turnaround of its earlier acquisition - Satyam,
believes it would be able to do the same with the recent acquisitions and would be
able to get close to achieving the 20% EBIT levels in future. Given the conducive
valuation on EV/sales front, where it trades at a significant discount to its peers, we
believe the stock should witness uptrend once the profitability returns to its mean
average. We recommend a Buy rating on the stock.
Exhibit 10: Key assumptions
FY2017E
FY2018E
Revenue growth (US$)
10.3
11.0
USD-INR rate (realized)
66.0
66.0
Revenue growth (`)
12.0
11.0
EBITDA margin (%)
15.5
17.0
Tax rate (%)
23.4
23.4
EPS growth (%)
1.8
21.9
Source: Company, Angel Research
Exhibit 11: One-year forward PE (x)
800
600
400
200
0
Nov-08 Sep-09 Jun-10 Apr-11 Jan-12 Nov-12 Aug-13 Jun-14 Mar-15 Jan-16 Oct-16
Price
20x
17x
14x
11x
8x
Source: Company, Angel Research. Note: P/E includes profits of Mahindra Satyam from FY2012
November 2, 2016
6
Tech Mahindra | 2QFY2017 Result Update
Exhibit 12: Recommendation summary
Company
Reco
CMP Tgt Price Upside
FY2018E FY2018E
FY2016-18E
FY2018E FY2018E
(`)
(`)
(%)
EBITDA (%)
P/E (x)
EPS CAGR (%)
EV/Sales (x)
RoE (%)
HCL Tech
Buy
773
1,000
29.4
20.5
12.1
9.6
1.7
17.9
Infosys
Buy
989
1,249
26.3
27.0
14.2
8.4
2.4
21.6
TCS
Accumulate
2,348
2,620
11.6
27.6
16.1
8.5
3.2
33.1
Tech Mahindra
Buy
434
600
38.9
17.0
10.9
11.4
0.9
20.7
Wipro
Buy
461
590
28.0
18.1
11.6
5.3
1.6
19.3
Source: Company, Angel Research.
Company Background
Tech Mahindra was founded in 1986 as a joint venture between Mahindra Group
and British Telecom (BT) to service the latter. Later on, the company started
servicing other external clients as well (solely in the telecom industry).In June 2009,
Tech Mahindra acquired a 42.7% stake in erstwhile Satyam Computers (now
Mahindra Satyam) and now the latter is entirely merged with the company.
The company has recently acquired the companies - LCC and Softgen. These two
acquisitions have been consolidated in 4QFY2015. LCC is one of the world’s
largest independent global providers of network engineering services to the
telecommunications industry. LCC is estimated to have annual revenues of more
than US$400mn (CY2014), with workforce of over 5,700 network professionals
across five continents and more than 50 countries.
November 2, 2016
7
Tech Mahindra | 2QFY2017 Result Update
Profit and loss statement (Consolidated, Indian GAAP)
Y/E March (` cr)
FY2014 FY2015 FY2016 FY2017E FY2018E
Net sales
18,831
22,621
26,494
29,673
32,937
Cost of revenues
12,427
15,920
18,323
20,177
22,068
Gross profit
6,404
6,701
8,172
9,495
10,869
% of net sales
34.0
29.6
30.8
32.0
33.0
SG&A expenses
2,220
2,549
3,853
4,896
5,270
% of net sales
11.8
11.3
14.5
16.5
16.0
EBITDA
4,184
4,153
4,318
4,599
5,599
% of net sales
22.2
18.4
16.3
15.5
17.0
Depreciation and amortization
522
611
762
861
955
% of net sales
2.8
2.7
2.9
2.9
2.9
EBIT
3,662
3,541
3,556
3,739
4,644
% of net sales
19.4
15.7
13.4
12.6
14.1
Interest expense
80
30
96
96
96
Other inc., net of forex gain/(loss)
233
106
557
557
557
Profit before tax
3,815
3,618
4,017
4,199
5,105
Provision for tax
752
960
860
983
1,194
% of PBT
19.7
26.5
21.4
23.4
23.4
PAT
3,063
2,659
3,157
3,217
3,910
Exceptional item
-
-
-
-
-
Minority interest
34
31
44
44
44
Reported PAT
3,029
2,628
3,118
3,173
3,866
Adjusted PAT
2,933
2,628
3,118
3,173
3,866
Fully diluted EPS (`)
30.3
27.1
32.2
32.8
39.9
November 2, 2016
8
Tech Mahindra | 2QFY2017 Result Update
Balance sheet (Consolidated, Indian GAAP)
Y/E March (` cr)
FY2014
FY2015
FY2016
FY2017E
FY2018E
Equity capital
234
480
484
484
484
Preference capital
-
-
-
-
-
Share premium
-
-
-
-
-
Profit and loss
8,947
11,768
13,882
15,696
18,204
Other reserves
2
0
0
0
-
Net worth
9,182
12,249
14,367
16,181
18,688
Secured loans
309
621
806
806
806
Unsecured loans
54
54
54
55
56
Total debt
363
675
859
860
861
Other long term liability
376
376
376
377
377
Long-term provisions
414
414
414
415
415
Minority interest
144
160
203
145
145
Amount pending investigation
1,230
895
895
895
895
Total capital employed
11,709
14,768
17,114
18,872
21,380
Gross block
5,460
7,811
8,811
9,811
10,811
Accumulated dep.
(2,866)
(3,477)
(4,239)
(5,099)
(6,055)
Net block
2,594
4,334
4,572
4,712
4,757
Capital WIP
266
266
266
267
268
Total fixed assets
2,861
4,601
4,839
4,979
5,025
Investments
36
2,103
2,103
2,103
2,103
Long term loans and adv.
914
1,306
1,502
1,727
1,986
Interest in TML benefit trust
-
-
-
-
-
Deferred tax asset, net
383
390
390
390
390
Other non-current assets
16
-
-
-
-
Inventories
10
24
11
11
11
Sundry debtors
4,349
5,206
5,987
6,896
7,980
Cash and cash equv.
4,756
2,405
5,127
6,486
8,612
Loans and advances
2,616
3,813
2,998
2,999
2,999
Current investments
-
-
-
-
-
Unbilled revenue
-
-
-
-
-
Sundry creditors
(1,549)
(1,654)
(1,903)
(2,188)
(2,516)
Other liabilities
(1,415)
(1,627)
(1,871)
(2,152)
(2,474)
Provision
(1,267)
(1,799)
(2,068)
(2,379)
(2,736)
Working capital
7,500
6,368
8,280
9,673
11,876
Total capital deployed
11,709
14,768
17,114
18,872
21,380
November 2, 2016
9
Tech Mahindra | 2QFY2017 Result Update
Cash flow statement (Consolidated, Indian GAAP)
Y/E March (` cr)
FY2014
FY2015
FY2016
FY2017E
FY2018E
Pre tax profit from operations
3,063
2,659
3,157
3,217
3,910
Depreciation
522
611
762
861
955
Exp. (deffered)/written off/others
-
-
-
-
-
Pre tax cash from operations
3,585
3,270
3,919
4,077
4,865
Other income/prior period ad
233
106
557
557
557
Net cash from operations
3,818
3,376
4,475
4,634
5,422
Tax
(752)
(960)
(860)
(983)
(1,194)
Cash profits
3,066
2,417
3,615
3,651
4,227
Sundry Debtors
Inventories
(980)
(857)
(781)
(909)
(1,085)
Loans and advances
1
(15)
13
-
-
Sundry creditors
(1,324)
(1,197)
815
(1)
-
Others
692
105
248
285
328
Net trade working capital
(623)
212
244
281
323
Cashflow from operating activities
(2,233)
(1,752)
540
(344)
(434)
(Inc)/dec in fixed assets
832
665
4,155
3,307
3,794
(Inc)/dec in investments
(369)
(1,740)
(238)
(140)
(46)
(Inc)/dec in other non current assets
-
(2,067)
-
-
-
Cashflow from investing activities
104
16
-
-
-
Inc/(dec) in debt
(265)
(3,791)
(238)
(140)
(46)
Inc/(dec) in deferred revenue
490
(311)
(185)
(1)
(1)
Inc/(dec) in equity/premium
-
-
-
-
-
Inc/(dec) in minority interest
(2)
1
-
-
0
Addition to reser. on amalgamation
(9)
(16)
(43)
59
-
Dividends
-
-
-
-
-
Others
(231)
(679)
(1,359)
(1,359)
(1,359)
Cashflow from financing activities
479
1,781
392
(507)
(343)
Cash generated/(utilised)
726
775
(1,195)
(1,808)
(1,702)
Cash at start of the year
1,294
(2,351)
2,722
1,359
2,046
Cash at end of the year
3,463
4,756
2,405
5,127
6,308
November 2, 2016
10
Tech Mahindra | 2QFY2017 Result Update
Key Ratios
Y/E March
FY2014
FY2015
FY2016
FY2017E
FY2018E
Valuation ratio (x)
P/E (on FDEPS)
14.3
16.0
13.5
13.2
10.9
P/CEPS
11.8
13.0
10.8
10.4
8.7
P/BVPS
4.6
3.4
2.9
2.6
2.2
Dividend yield (%)
1.2
1.2
2.8
1.4
1.6
EV/Sales
2.0
1.8
1.4
1.2
1.0
EV/EBITDA
8.9
9.7
8.7
7.9
6.1
EV/Total assets
13.1
8.7
7.8
7.3
6.8
Per share data (`)
EPS
30.3
27.1
32.2
32.8
39.9
Cash EPS
36.7
33.5
40.1
41.7
49.8
Dividend
5.0
5.0
12.0
6.0
7.0
Book value
94.9
126.6
148.4
167.2
193.1
Dupont analysis
Tax retention ratio (PAT/PBT)
0.8
0.7
0.8
0.8
0.8
Cost of debt (PBT/EBIT)
1.0
1.0
1.1
1.1
1.1
EBIT margin (EBIT/Sales)
0.2
0.2
0.1
0.1
0.1
Asset turnover ratio (Sales/Assets)
6.6
4.9
5.5
6.0
6.6
Leverage ratio (Assets/Equity)
0.3
0.4
0.3
0.3
0.3
Operating ROE (%)
33.0
21.5
21.7
19.6
20.7
Return ratios (%)
RoCE (pre-tax)
31.3
24.0
20.8
19.8
21.7
Angel RoIC
54.8
29.3
30.3
30.8
37.2
RoE
31.9
21.5
21.7
19.6
20.7
Turnover ratios( x)
Asset turnover (fixed assets)
6.6
4.9
5.5
6.0
6.6
Receivables days
78
92
89
90
93
Payable days
26
29
28
28
29
November 2, 2016
11
Tech Mahindra | 2QFY2017 Result Update
Research Team Tel: 022 - 39357800
DISCLAIMER
Angel Broking Private Limited (hereinafter referred to as “Angel”) is a registered Member of National Stock Exchange of India Limited,
Bombay Stock Exchange Limited and Metropolitan Stock Exchange Limited. It is also registered as a Depository Participant with CDSL
and Portfolio Manager with SEBI. It also has registration with AMFI as a Mutual Fund Distributor. Angel Broking Private Limited is a
registered entity with SEBI for Research Analyst in terms of SEBI (Research Analyst) Regulations, 2014 vide registration number
INH000000164. Angel or its associates has not been debarred/ suspended by SEBI or any other regulatory authority for accessing
/dealing in securities Market. Angel or its associates/analyst has not received any compensation / managed or co-managed public
offering of securities of the company covered by Analyst during the past twelve months.
This document is solely for the personal information of the recipient, and must not be singularly used as the basis of any investment
decision. Nothing in this document should be construed as investment or financial advice. Each recipient of this document should
make such investigations as they deem necessary to arrive at an independent evaluation of an investment in the securities of the
companies referred to in this document (including the merits and risks involved), and should consult their own advisors to determine
the merits and risks of such an investment.
Reports based on technical and derivative analysis center on studying charts of a stock's price movement, outstanding positions and
trading volume, as opposed to focusing on a company's fundamentals and, as such, may not match with a report on a company's
fundamentals. Investors are advised to refer the Fundamental and Technical Research Reports available on our website to evaluate the
contrary view, if any.
The information in this document has been printed on the basis of publicly available information, internal data and other reliable
sources believed to be true, but we do not represent that it is accurate or complete and it should not be relied on as such, as this
document is for general guidance only. Angel Broking Pvt. Limited or any of its affiliates/ group companies shall not be in any way
responsible for any loss or damage that may arise to any person from any inadvertent error in the information contained in this report.
Angel Broking Pvt. Limited has not independently verified all the information contained within this document. Accordingly, we cannot
testify, nor make any representation or warranty, express or implied, to the accuracy, contents or data contained within this document.
While Angel Broking Pvt. Limited endeavors to update on a reasonable basis the information discussed in this material, there may be
regulatory, compliance, or other reasons that prevent us from doing so.
This document is being supplied to you solely for your information, and its contents, information or data may not be reproduced,
redistributed or passed on, directly or indirectly.
Neither Angel Broking Pvt. Limited, nor its directors, employees or affiliates shall be liable for any loss or damage that may arise from
or in connection with the use of this information.
Disclosure of Interest Statement
Tech Mahindra
1. Financial interest of research analyst or Angel or his Associate or his relative
No
2. Ownership of 1% or more of the stock by research analyst or Angel or associates or relatives
No
3. Served as an officer, director or employee of the company covered under Research
No
4. Broking relationship with company covered under Research
No
Ratings (Based on expected returns
Buy (> 15%)
Accumulate (5% to 15%)
Neutral (-5 to 5%)
over 12 months investment period):
Reduce (-5% to -15%)
Sell (< -15)
November 2, 2016
12