IPO Note | HR Services
January 30, 2016
TeamLease Services
NEUTRAL
Issue Open: February 2, 2016
IPO Note - Valuations expensive
Issue Close: February 4, 2016
TeamLease Services Ltd (TSL) is one of India’s leading providers of human
Issue Details
resource services in the organized segment. It’s staffing business accounts for
98.8% of the revenues while HR services accounts for the balance. It has a market
Face Value: `10
share of ~6% in the Indian Flexi-staffing Industry. It delivers staffing services
across industries like banking, manufacturing, retail, telecom, etc. The company
Present Eq. Paid up Capital: `15.3cr
has shown significant growth over FY2011-15, posting a revenue CAGR of 30.7%
Fresh Issue**: 0.18cr Shares
and after posting losses till FY2013, the company has since turned profitable and
reported net profit of ~`30cr in FY2015 vs. a net loss of ~`16cr in FY2012.
Offer for sale: 0.32cr Shares
Lower penetration levels suggest huge growth potential: The flexi-staffing industry in
Post Eq. Paid up Capital: `17.1cr
India as of FY2014 was valued at around `180-220bn and the penetration level of
the industry in India at ~0.4% is lower than in developed regions where the
Market Lot: 15 Shares
penetration level is between 1.5-3.0%. Going forward, as per industry reports, Flexi-
staffing industry is expected to report a CAGR of 25-30% and be around `610-640bn
Fresh Issue (amount): `150cr
by FY2019 and the penetration level is expected to improve to 1.0% over the same
Price Band: `785-850
period on back of increasing number of enterprises turning formal, skill development
Post-issue implied mkt. cap `1,354cr*-
in the country, and regulatory amendments in favour of formal employment.
1,453cr**
Focus on improving operating margins: The HR services business, which commands
Note:*at Lower price band and **Upper price band
higher margin, accounts for a very small portion of company’s overall top-line. HR
services offers recruitment services, regulatory services, skills and development
corporate training, and payroll services. The company is now focusing on such higher
Book Building
margin businesses apart from its regular staffing business. It is also looking for
opportunities in the IT vertical and improving employee productivity.
QIBs
75%
Intense competition and lack of pricing power: The flexi-staffing industry is highly
Non-Institutional
15%
fragmented with intense competition. Almost 70-80% of the industry is unorganized
consisting of smaller players and balance comprising of major players like Adecco,
Retail
10%
Randstad, Quesscorp, etc. TSL faces stiff competition from these companies as well as
other small players, thus leading to lack of pricing power.
Post Issue Shareholding Pattern(%)
Outlook Valuation: TSL being leading staffing company in India and has the potential
to further increase its market share. However, although the company has shown good
Promoters Group
45.6
growth momentum, it operates in an industry characterised by intense competition,
lack of pricing power, low entry barriers and high degree of fragmentation which
MF/Banks/Indian
renders limited scope for margin improvement.
FIs/FIIs/Public & Others
54.4
On the valuation front, at the upper end of the price band, the pre-issue P/E works out
to 60.6x its 1HFY2016E annualised earnings. In comparison, its global peer Adecco is
trading at 12.9x 9MCY2015 annualised earnings and has a better margin and ROE
profile. Further, post the IPO, TSL’s ROE is not expected to improve significantly in the
near term. Considering the above mentioned business concerns and expensive
valuation, we recommend a Neutral on the issue.
Key Financial
Y/E March (` cr)
FY2012
FY2013
FY2014
FY2015
1HFY2016
Net Sales
926
1,251
1,530
2,007
1,210
% chg
34.8
35.1
22.3
31.2
-
Net Profit
(16)
(4)
18
30
11
% chg
-
-
-
66.3
-
OPM (%)
(2.2)
(0.9)
0.8
1.2
0.9
Amarjeet S Maurya
EPS (`)
(10.8)
(2.4)
11.6
19.4
7.2
+91 22 4000 3600 Ext: 6831
P/E (x)
-
-
73.0
43.9
-
P/BV (x)
12.4
12.9
11.0
8.8
8.2
RoE (%)
-
-
15.0
20.0
-
RoCE (%)
-
-
8.5
14.4
-
Milan Desai
EV/Sales (x)
1.3
1.0
0.8
0.6
-
+91 22 4000 3600 Ext: 6846
EV/EBITDA (x)
-
-
101.2
49.4
-
Source: Company, Angel Research; Note: Valuation ratios based on pre-issue outstanding shares
and at upper end of the price band
Please refer to important disclosures at the end of this report
1
TeamLease Services | IPO Note
Company background
TSL is one of India’s leading providers of human resource services in the organized
segment, providing staffing solutions across industry sectors and diverse functional
roles. The company’s operations are classified into Staffing and HR services.
Staffing services account for 98.8% of its total revenues. As of March 31, 2015, the
company has provided employment to ~1.12mn associates (since 2002).
Exhibit 1: Business model
Teamlease
Staffing Operations
HR Services
(98.8%)
(1.2%)
Permanent Recruitment.
Regulatory Compliance Consulting.
Staffing Services.
Retail Learning Solutions.
Institutional Learning Solutions .
Payroll.
Source: Company, Angel Research
TSL operates on an asset-light model with low capital expenditure requirements. As
of November 30, 2015, it had 104,946 associate employees, serving 1,021 clients
and 1,218 full time employees based out of eight offices in India.
It delivers staffing services across various industries including the consumer
durables, chemicals, manufacturing, media and telecom, retail, banking, financial
services and insurance, e-commerce, pharmaceuticals and healthcare sectors. The
majority of TSL’s Associate Employees are engaged in sales, logistics and customer
service functions.
January 30, 2016
2
TeamLease Services | IPO Note
Exhibit 2: Industry wise revenue contribution
Others , 46%
IT/Ites, 7%
Agri-Related, 5%
Consumer
Financial
Goods, 20%
Services, 7%
Telecom Services,
Manufacturing ,
7%
8%
Source: Company, Angel Research
Issue details
The company is raising `150cr through fresh issue of equity shares in the price
band of `785-850. In addition, the issue also consists of offer for sale of 32.2 lakh
shares of which 1.5 lakh shares will be offered by the promoter entities and 30.7
lakh shares by other investors. The fresh issue will constitute 10.3% of the post-
issue paid-up equity share capital of the company assuming the issue is subscribed
at the upper end of the price band.
Exhibit 3: Shareholding pattern
Particulars
Pre-Issue
Post-Issue
No. of shares
(%)
No. of shares
(%)
Promoter group
79,51,971
51.9
77,98,650
45.6
Others
73,80,093
48.1
92,98,120
54.4
Total
1,53,32,064
100.0
1,70,96,770
100.0
Source: Company, Angel Research
Objects of the offer
Funding existing and incremental working capital requirements of the
company amounting to `80cr.
Funding for acquisitions and other strategic initiatives amounting to `25cr.
For upgrading existing IT infrastructure amounting to `15cr.
The balance will be utilized for general corporate purposes.
January 30, 2016
3
TeamLease Services | IPO Note
Investment rationale
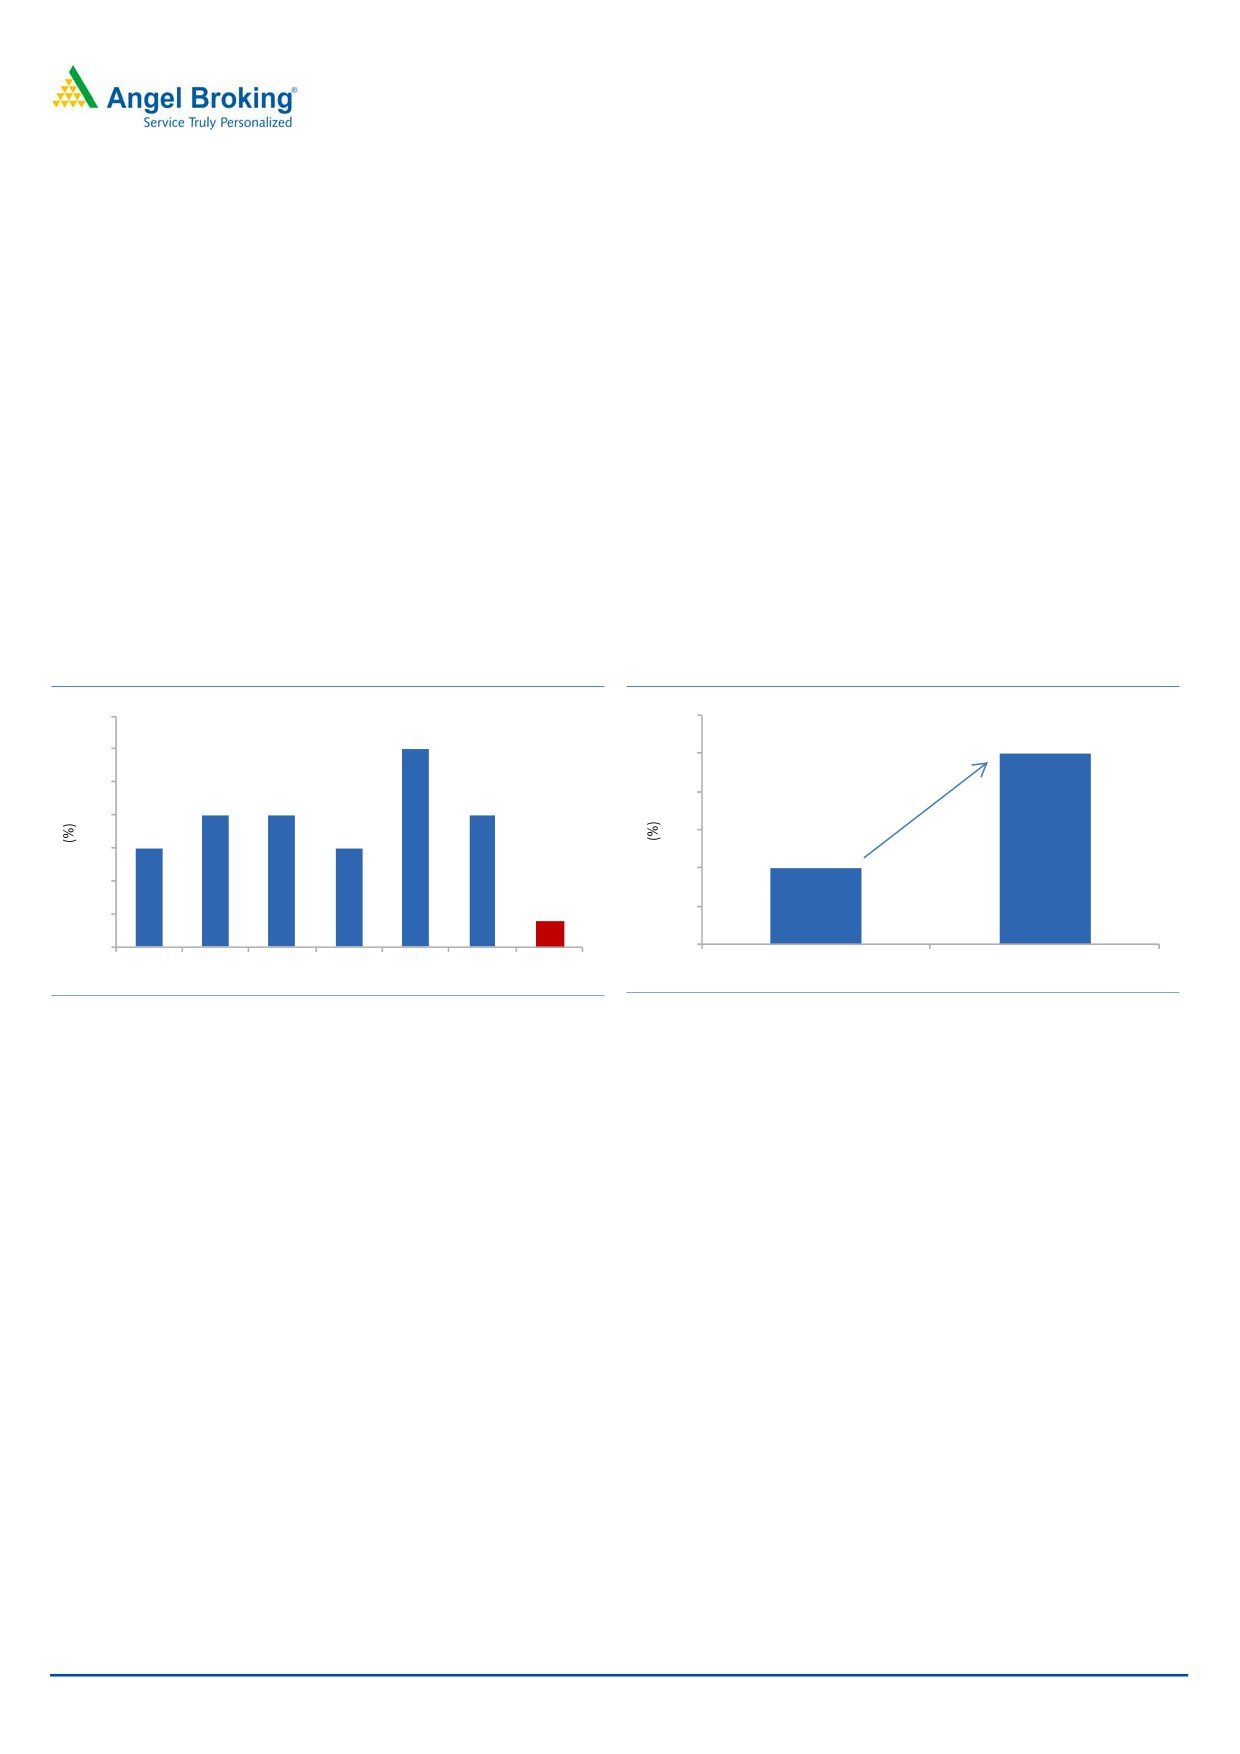
Lower penetration levels suggest huge growth potential
Penetration level of flexi-staffing industry is lower in India as compared to
In India, the penetration level of flexi-
developed regions like UK, USA, Europe, Japan etc. In India, the penetration level
staffing is at ~0.4% compared to 3% in
of flexi-staffing is at ~0.4% compared to 3% in UK, 2% in USA, and 1.5% in Japan
UK, 2% in USA, and 1.5% in Japan as
as stated by the company.
stated by the company
We believe that going forward, penetration of flexi-staffing would increase on back
of increasing number of enterprises turning formal, skill development in the
country, and regulatory amendments in favour of formal and flexi-staffing industry.
The initiatives taken by the flexi-staffing industry, such as training services, are also
likely to add to the industry growth over the long term. The expected growth in
penetration levels to be witnessed in the domestic flexi-staffing industry over the
next five years is largely in line with many global economies.
Exhibit 4: Flexi-staffing penetration levels
Exhibit 5: Expected growth in flexi-staffing industry
3.5
1.2
3.0
1
3.0
1.0
2.5
0.8
2.0
2.0
2.0
2.0
1.5
1.5
0.6
1.5
0.4
0.4
1.0
0.4
0.2
0.5
0.0
0.0
Austria Germany Ireland
Japan
UK
USA
India
FY14
FY19P
Source: RHP, Angel Research
Source: RHP, Angel Research
Domestic flexi-staffing industry expected to post 25-30% CAGR over the
next five years
The flexi-staffing industry in India as of FY2014 was valued at around `180-
220bn. The average wages for flexi-staffing workers is assumed to be around
Over the next five years, the flexi-
`8,000-10,000 per month (reflects weighted average of wages for organized and
staffing industry is expected to post a
unorganized players). Over the next five years, the flexi-staffing industry is
25-30% CAGR to attain a value of
expected to post a 25-30% CAGR to attain a value of around `610-640bn. This
around `610-640bn
growth is owing to various factors, including an increasing number of enterprises
turning formal, skill development in the country, and regulatory amendments in
favour of formal employment.
January 30, 2016
4
TeamLease Services | IPO Note
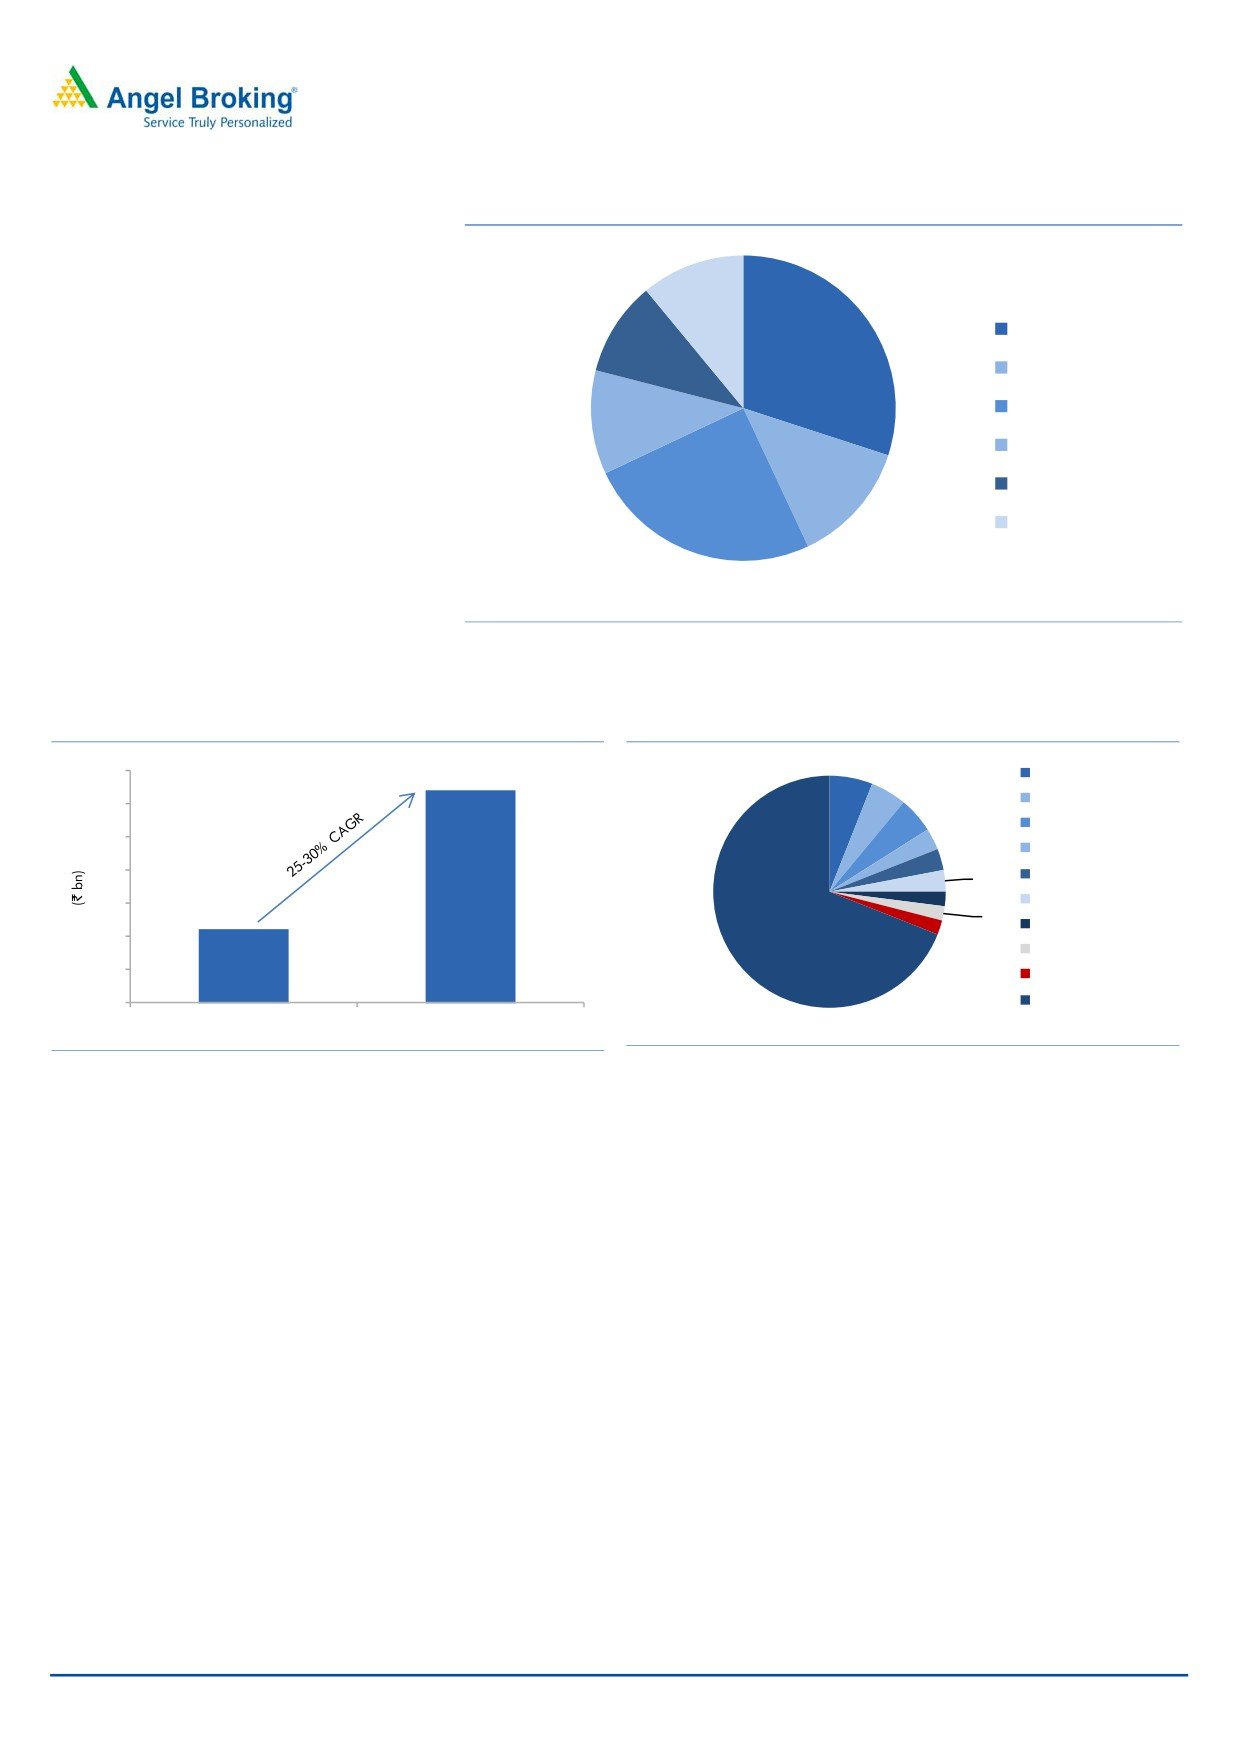
Exhibit 6: Industry-wise demand for flexi-staffing
11%
Manufacturing
30%
10%
BFSI
FMCG/CD/Retail
11%
Logistics/ telecom
13%
IT/Ites
25%
others
Source: CRISIL
Exhibit 7: Flexi-staffing industry size
Exhibit 8: Market Share of TSL
700
Teamlease
6%
Adecco
600
5%
Randstad
5%
3%
500
Quesscorp
3%
400
3%
Genius Consultants
2%
Manpower
300
2%
Global Innov
200
2%
69%
Need Manpower
100
GI Staffing
0
Others
FY2014
FY2019P
Source: RHP, Angel Research
Source: RHP, Angel Research
The unorganized sector constitutes 70-80% of the total industry. At present, TSL is
one of the leading player in the flexi-staffing industry with a market share of ~6%,
Currently, TSL is the largest player in
while Adecco and Randstad have a market share of 5% each, followed by
the flexi-staffing industry with a market
Quesscorp and Genius Consultant Manpower with a combined market share of
share of ~6%
less than 5%. We expect TSL to benefit from increasing demand for manpower
across industries on the back of its strong management, healthy track record, and
with it being the market leader, which would help it to enhance its market share
and increase revenue.
January 30, 2016
5
TeamLease Services | IPO Note
Focus on high-margin business
More than 98% of the company’s revenue comes from its staffing business. The
balance is accounted by recruitment services, regulatory services, skills and
development corporate training, payroll, etc, which earn higher margins than the
TSL is also focusing on recruitment
staffing business. The company is now focusing on such higher margin businesses
services and regulatory services which
apart from its regular staffing business. It is currently looking for opportunities in
are high-margin businesses
the IT vertical through an acquisition. It is also increasingly focusing on achieving
internal cost efficiency. For instance, in the past, a full time employee of the
company was handling 45 associate employees; now an employee handles more
than 95 associate employees while the same is expected to touch 150, going
forward.
Exhibit 9: Operating margin trend
2.0
1.2
0.8
1.0
-
FY2011
FY2012
FY2013
FY2014
FY2015
(1.0)
(2.2)
(0.9)
(2.0)
(3.0)
(4.0)
(5.0)
(5.7)
(6.0)
(7.0)
Source: Company, Angel Research
Strong Management and thought leadership in public policy
initiatives
TSL is a professionally managed company with a high-quality senior Management
team, which thus provides the right balance of experience, expertise and strategic
vision. This is contributing significantly to TLS’ growth.
The company’s Management team is backed by its individual Promoters, who have
an extensive experience in the HR services industry in general and the staffing
segment in particular. The company’s Chairman, Manish Mahendra Sabharwal, is
a well recognized person in the staffing industry and was selected to be a member
of the Planning Commission Committee for labour reforms.
The company’s Promoters are also well versed with labour reforms in the country
and help in creating a market for the company’s services in an otherwise
unorganized sector and in building the TeamLease brand. We believe that the
thought leadership demonstrated by the company’s Promoters to reform India's
labour laws together with focus on regulatory compliance and technology, would
provide the company with significant competitive advantages in any resulting
market size expansion.
January 30, 2016
6
TeamLease Services | IPO Note
Key investment concerns
Intense competition and lack of pricing power
The flexi-staffing industry is highly fragmented with intense competition and lacks a
clear cut leader accounting for dominant share in the employment services market.
Almost 70-80% of the industry is unorganized consisting of small players. Although
TSL is a leading player in the industry, the gap between the top three to five players
(Adecco, Manpower Inc., Randstad, etc) is very small if not miniscule. TSL faces stiff
competition from these companies as well as other small players, thus leading to
lack of pricing power.
Valuation expensive
The company has shown significant growth over FY2011-15, posting a revenue
CAGR of 30.7%. After posting losses till FY2013, the company has since turned
profitable and reported net profit of ~`30cr in FY2015 vs. a net loss of ~`16cr in
FY2012. The company is a leading staffing company in India and has the potential
to further increase its market share. However, although the company has shown
good growth momentum in recent times, it operates in an industry characterised by
intense competition, lack of pricing power, low entry barriers and high degree of
fragmentation which renders limited scope for margin improvement.
On the valuation front, at the upper end of the price band, the pre-issue P/E works
out to 60.6x its 1HFY2016E annualised earnings. In comparison, its global peer
Adecco is trading at 12.9x 9MCY2015 annualised earnings and has a better
margin and ROE profile. Further, post the IPO, TSL’s ROE is not expected to
improve significantly in the near term. Considering the above mentioned business
concerns and expensive valuation, we recommend a Neutral on the issue.
Exhibit 10: Comparative Valuation
P/E
P/BV
ROE EV/Sales
EV/EBITDA
Pre issue valuation^
(x)
(x)
(%)
(x)
(x)
TeamLease*
FY2016
60.6
7.6
12.6
0.5
52.3
Adecco#
FY2015
12.9
2.9
22.4
0.5
9.2
Source: RHP, Bloomberg; Note: *based on 1HFY16 annualised numbers; # based on 9MCY15
annualised numbers; ^based on price at upper band
Risks
Slowdown in economy: Slowdown in economy can restrict TSL’s growth as it
provides temporary staffing solution to the various sectors like manufacturing,
logistic, telecom, hospitality, IT/ITes etc. which are dependent on economic growth.
Upcoming Smart Cities could be a trigger for flexi staffing industry: Upcoming
Smart cities projects are expected to create huge job opportunities in flexi-staffing
industry which could be an upside risk to our recommendation.
January 30, 2016
7
TeamLease Services | IPO Note
Profit & Loss (consolidated)
Y/E March (` cr)
FY2012
FY2013
FY2014
FY2015
1HFY16
Total operating income
926
1,251
1,530
2,007
1,210
% chg
34.8
35.1
22.3
31.2
-
Total Expenditure
947
1,262
1,518
1,983
1,198
Personnel Expenses
903
1,216
1,484
1,944
1,179
Others Expenses
43
45
34
39
19
EBITDA
(21)
(11)
12
24
11
% chg
-
-
-
99.7
-
(% of Net Sales)
(2.2)
(0.9)
0.8
1.2
0.9
Depreciation& Amortisation
4
4
2
3
1
EBIT
(24)
(15)
10
21
10
% chg
-
-
-
110.8
-
(% of Net Sales)
(2.6)
(1.2)
0.7
1.1
0.9
Interest & other Charges
0
1
0
0
0
Other Income
8
11
8
11
6
Share in profit of Associates
-
-
-
-
-
Recurring PBT
(17)
(4)
18
33
16
% chg
-
-
-
83.4
-
Prior Period & Extraord.Exp./(Inc.)
-
-
-
-
-
PBT (reported)
(17)
(4)
18
33
16
Tax
-
-
-
2
6
(% of PBT)
-
-
-
5.5
34.7
PAT before Adjustments
(17)
(4)
18
31
11
Adjustments
(0)
(1)
(0)
1
(0)
Less: Minority interest (MI)
-
-
-
-
-
PAT after MI & Adj. (reported)
(16)
(4)
18
30
11
ADJ. PAT
(16)
(4)
18
30
11
% chg
-
-
-
66.3
-
(% of Net Sales)
(1.8)
(0.3)
1.2
1.5
0.9
Basic EPS (`)
(10.8)
(2.4)
11.6
19.4
7.2
Fully Diluted EPS (`)
(10.8)
(2.4)
11.6
19.4
7.2
January 30, 2016
8
TeamLease Services | IPO Note
Balance Sheet (consolidated)
Y/E March (` cr)
FY2012
FY2013
FY2014
FY2015
1HFY16
SOURCES OF FUNDS
Equity Share Capital
1
1
1
1
15
Reserves& Surplus
104
100
118
148
144
Shareholders’ Funds
105
101
119
149
160
Minority Interest
-
-
-
-
-
Total Loans
8
12
1
-
-
Other long term liabilities
4.7
5.4
5.8
5.2
5.1
Long-term provisions
6.4
9.1
13.0
17.6
25.2
Deferred Tax Liability
-
-
-
-
-
Total Liabilities
124
128
138
171
190
APPLICATION OF FUNDS
Gross Block
36
26
25
26
30
Less: Acc. Depreciation
19
17
17
19
20
Net Block
17
8
8
7
10
Goodwill
2
2
2
2
2
Investments
0
0
0
0
0
Current Assets
150
173
192
275
357
Inventories
1
1
0
0
0
Sundry Debtors
54
62
59
80
119
Cash
82
78
85
115
122
Loans & Advances
8
8
26
8
12
Other Assets
5
25
22
72
105
Current liabilities
73
97
105
179
269
Net Current Assets
77
76
88
96
88
Long term loans and adv.
21.0
30.9
25.5
43.6
54.2
Other Non Current Assets
6.6
9.4
14.6
16.7
27.8
Deferred Tax Asset
-
-
-
6
7
Mis. Exp. not written off
-
-
-
-
-
Total Assets
124
128
138
171
190
January 30, 2016
9
TeamLease Services | IPO Note
Cash flow statement (consolidated)
Y/E March (` cr)
FY2012
FY2013
FY2014
FY2015
1HFY16
Profit before tax
(16)
(4)
18
32
17
Depreciation
4
4
2
3
1
Change in Working Capital
(16)
(2)
6
5
10
Interest / Dividend (Net)
(8)
(6)
(7)
(10)
(5)
Direct taxes paid
(10)
(9)
(8)
2
(13)
Others
7
8
6
4
2
Cash Flow from Operations
(40)
(9)
16
34
11
(Inc.)/ Dec. in Fixed Assets
(4)
(1)
(3)
(4)
(4)
(Inc.)/ Dec. in Investments
(26)
8
(32)
(21)
6
Cash Flow from Investing
(31)
7
(35)
(24)
3
Issue of Equity
99
-
-
-
-
Inc./(Dec.) in loans
5
4
(11)
(1)
-
Dividend Paid (Incl. Tax)
-
-
-
-
-
Interest / Dividend (Net)
(0)
(1)
(0)
(0)
(0)
Cash Flow from Financing
104
4
(11)
(1)
(0)
Inc./(Dec.) in Cash
33
1
(30)
9
14
Opening Cash balances
9
42
43
13
22
Closing Cash balances
42
43
13
22
35
January 30, 2016
10
TeamLease Services | IPO Note
Key Ratios
Y/E March
FY2012
FY2013
FY2014
FY2015
Valuation Ratio (x)
P/E (on FDEPS)
-
-
73.0
43.9
P/CEPS
-
-
66.2
38.9
P/BV
12.4
12.9
11.0
8.8
Dividend yield (%)
0.0
0.0
0.0
0.0
EV/Sales
1.3
1.0
0.8
0.6
EV/EBITDA
-
-
101.2
49.4
EV / Total Assets
6.2
5.5
5.0
3.4
Per Share Data (`)
EPS (Basic)
(10.8)
(2.4)
11.6
19.4
EPS (fully diluted)
(10.8)
(2.4)
11.6
19.4
Cash EPS
(8.3)
(0.4)
12.8
21.8
DPS
0.0
0.0
0.0
0.0
Book Value
68.3
65.9
77.5
96.9
Returns (%)
ROCE
-
-
8.5
14.4
ROE
-
-
15.0
20.0
Turnover ratios (x)
Asset Turnover (Gross Block)
25.6
48.4
60.6
76.5
Inventory / Sales (days)
0
0
0
0
Receivables (days)
21
18
14
15
Payables (days)
1
0
2
1
WC cycle (ex-cash) (days)
21
18
13
13
Note: Valuation ratios based on pre-issue outstanding shares and at upper end of the price band
January 30, 2016
11
TeamLease Services | IPO Note
Research Team Tel: 022 - 39357800
DISCLAIMER
Angel Broking Private Limited (hereinafter referred to as “Angel”) is a registered Member of National Stock Exchange of India Limited,
Bombay Stock Exchange Limited and Metropolitan Stock Exchange of India Limited. It is also registered as a Depository Participant with
CDSL and Portfolio Manager with SEBI. It also has registration with AMFI as a Mutual Fund Distributor. Angel Broking Private Limited is
a registered entity with SEBI for Research Analyst in terms of SEBI (Research Analyst) Regulations, 2014 vide registration number
INH000000164. Angel or its associates has not been debarred/ suspended by SEBI or any other regulatory authority for accessing
/dealing in securities Market. Angel or its associates including its relatives/analyst do not hold any financial interest/beneficial
ownership of more than 1% in the company covered by Analyst. Angel or its associates/analyst has not received any compensation /
managed or co-managed public offering of securities of the company covered by Analyst during the past twelve months. Angel/analyst
has not served as an officer, director or employee of company covered by Analyst and has not been engaged in market making activity
of the company covered by Analyst.
This document is solely for the personal information of the recipient, and must not be singularly used as the basis of any investment
decision. Nothing in this document should be construed as investment or financial advice. Each recipient of this document should
make such investigations as they deem necessary to arrive at an independent evaluation of an investment in the securities of the
companies referred to in this document (including the merits and risks involved), and should consult their own advisors to determine
the merits and risks of such an investment.
Reports based on technical and derivative analysis center on studying charts of a stock's price movement, outstanding positions and
trading volume, as opposed to focusing on a company's fundamentals and, as such, may not match with a report on a company's
fundamentals.
The information in this document has been printed on the basis of publicly available information, internal data and other reliable
sources believed to be true, but we do not represent that it is accurate or complete and it should not be relied on as such, as this
document is for general guidance only. Angel Broking Pvt. Limited or any of its affiliates/ group companies shall not be in any way
responsible for any loss or damage that may arise to any person from any inadvertent error in the information contained in this report.
Angel Broking Pvt. Limited has not independently verified all the information contained within this document. Accordingly, we cannot
testify, nor make any representation or warranty, express or implied, to the accuracy, contents or data contained within this document.
While Angel Broking Pvt. Limited endeavors to update on a reasonable basis the information discussed in this material, there may be
regulatory, compliance, or other reasons that prevent us from doing so.
This document is being supplied to you solely for your information, and its contents, information or data may not be reproduced,
redistributed or passed on, directly or indirectly.
Neither Angel Broking Pvt. Limited, nor its directors, employees or affiliates shall be liable for any loss or damage that may arise from
or in connection with the use of this information.
Note: Please refer to the important ‘Stock Holding Disclosure' report on the Angel website (Research Section). Also, please refer to the
latest update on respective stocks for the disclosure status in respect of those stocks. Angel Broking Pvt. Limited and its affiliates may
have investment positions in the stocks recommended in this report.
January 30, 2016
12