2QFY2016 Result Update | Automobile
November 16, 2015
Tata Motors
NEUTRAL
CMP
`400
Performance Highlights
Target Price
-
Y/E March (` cr)
2QFY16 2QFY15
% chg (yoy)
1QFY16
% chg (qoq)
Investment Period
-
Net Sales
61,318
60,641
1.1
61,302
0.0
EBITDA
6,880
9,569
(28.1)
9,109
(24.5)
Stock Info
EBITDA Margin (%)
11.2
15.8
(460 bp)
14.9
(370 bp)
Sector
Automobile
Adj. PAT
2,223
3,273
(32.1)
2,847
(21.9)
Market Cap (` cr)
115,039
Source: Company, Angel Research
Net Debt (`
cr)
41,495
Operating results below estimates: Tata Motors’ 2QFY2016 results have come in
Beta
1.3
below our estimates on the operating front. Consolidated revenues grew
52 Week High / Low
605/279
marginally by 1% yoy to `61,318cr (coming slightly ahead of our estimates of
Avg. Daily Volume
884,305
`57,484cr). Growth was subdued, mainly due to flattish top-line at JLR. JLR’s
volumes grew a healthy 12% yoy during the quarter but an adverse product
Face Value (`)
2
(higher sales of relatively lower priced cars in the company’s product portfolio)
BSE Sensex
25,760
and regional mix (lower China sales) led to lower realization, thus dragging the
Nifty
7,807
top-line. The consolidated operating margin at 11.2% was below our estimate of
Reuters Code
TAMO.BO
13.4%. JLR’s EBIDTA margin at 12.2% was significantly below our estimate of
Bloomberg Code
TTMT@IN
15%. JLR’s margins were impacted by lower China sales, adverse product mix
and higher launch expenses. During the quarter, Tata Motors reported a loss at
the net level due to a one-off charge of `2,493cr related to damage caused by fire
Shareholding Pattern (%)
explosions caused at the China port location, which affected JLR vehicles. However,
Promoters
33.0
Tata Motors had a tax credit to the tune of `704cr which resulted in the Adj profit
MF / Banks / Indian Fls
17.8
coming in at `2,223cr for the quarter (better than our estimate of `2,041cr).
FII / NRIs / OCBs
21.9
Outlook and valuation: JLR’s volumes are likely to recover from 2HFY2016 on
Indian Public / Others
27.3
back of new product introductions, tapping of new segments, and production
ramp up at the China JV. We expect JLR’s volumes to grow at 13% CAGR over the
FY2015-2017 period. JLR aims to widen its presence across product segments
Abs. (%)
3m 1yr 3yr
and is poised to become a stronger luxury car player in the next four to five years.
Sensex
(8.2)
(8.2)
40.7
Also, the standalone business is expected to turn profitable at the operating level
TAMO
12.6
(22.8)
52.6
in FY2016 on back of pick up in the commercial as well as passenger vehicle
segments and with gradual reduction in discounts. However, JLR margins are
likely to remain under pressure as the company enters new segments which would
3-Year Daily Price Chart
lead to direct competition with established luxury players viz BMW, Audi and
700
Mercedes. We expect JLR margins to be in 14-15% range as against 18% range
600
in the last two years. Also, the stock currently trades at 28.9x its FY2016 and
500
14.9x its FY2017 adjusted earnings respectively, leaving limited scope of upside
400
from current levels. Thus, we have a Neutral view on the stock.
300
Key financials (Consolidated)
200
Y/E March (` cr)
FY2014
FY2015 FY2016E
FY2017E
100
Net Sales
232,834
262,796
255,254
301,772
0
% chg
23.3
12.9
(2.9)
18.2
Adj Net Profit*
11,790
10,544
4,698
9,098
% chg
41.0
(10.6)
(55.4)
93.7
EBITDA (%)
15.0
14.9
12.9
13.4
Source: Company, Angel Research
Adj EPS* (`)
36.6
32.8
13.8
26.8
P/E (x)
10.9
12.2
28.9
14.9
P/BV (x)
2.0
2.3
2.0
1.7
RoE (%)
18.0
18.7
7.4
12.1
RoCE (%)
18.8
19.0
12.3
14.5
Bharat Gianani
EV/Sales (x)
0.7
0.6
0.8
0.7
022-3935 7800 Ext: 6817
EV/EBITDA (x)
4.6
4.3
6.1
5.2
Source: Company, Angel Research; *Adj for deficient R&D
Please refer to important disclosures at the end of this report
1
Tata Motors | 2QFY2016 Result Update
Exhibit 1: Quarterly financial performance (Consolidated)
Y/E March (` cr)
2QFY16
2QFY15
% chg (yoy)
1QFY16
% chg (qoq)
1HFY16
1HFY15
% chg (yoy)
Net Sales
61,318
60,641
1.1
61,302
0.0
122,620
125,324
(2.2)
Consumption of RM
37,275
36,968
0.8
35,063
6.3
72,338
76,704
(5.7)
(% of Sales)
60.8
61.0
57.2
59.0
61.2
Staff Costs
7,012
6,231
12.5
6,979
0.5
13,991
12,054
16.1
(% of Sales)
11.4
10.3
11.4
11.4
9.6
Other Expenses
10,152
7,873
28.9
10,151
0.0
20,303
15,855
28.1
(% of Sales)
16.6
13.0
16.6
16.6
12.7
Total Expenditure
54,438
51,072
6.6
52,193
4.3
106,631
104,612
1.9
Operating Profit
6,880
9,569
(28.1)
9,109
(24.5)
15,989
20,711
(22.8)
OPM (%)
11.2
15.8
14.9
13.0
16.5
Interest
1,159
930
24.7
1,117
3.8
2,277
1,875
21.4
Depreciation
4,428
3,213
37.8
3,823
15.8
8,251
6,193
33.2
Other Income
245
218
12.3
307
(20.2)
552
432
28.0
Minority interest
19
16
20
38
31
PBT
1,520
5,628
(73.0)
4,456
(65.9)
5,975
13,044
(54.2)
(% of Sales)
2.5
9.3
7.3
4.9
10.4
Provision for Taxation
(704)
2,364
(129.8)
1,570
(144.8)
867
4,479
(80.6)
(% of PBT)
(46.3)
42.0
35.2
14.5
34.3
PAT before exceptional
2,223
3,264
(31.9)
2,886
(23.0)
5,109
8,565
(40.4)
Exceptional items
(2,653)
26
(117)
(2,770)
120
Reported PAT
(430)
3,291
2,769
2,339
8,685
Adj PAT
2,223
3,273
(32.1)
2,847
(21.9)
5,070
8,605
(41.1)
Adj. PATM
3.6
5.4
4.6
4.1
6.9
Equity capital (cr)
679.2
643.8
679.2
679.2
643.8
Adjusted EPS (`)
6.5
10.2
(35.6)
8.4
(21.9)
14.9
26.7
(44.2)
Source: Company, Angel Research
Exhibit 2: 2QFY2016 - Actual vs Angel Estimates
Y/E March (` cr)
Actual
Estimates
Variation (%)
Net Sales
61,318
57,484
6.7
EBITDA
6,880
7,695
(10.6)
EBITDA margin (%)
11.2
13.4
(220 bp)
Adj. PAT
2,223
2,042
8.9
Source: Company, Angel Research
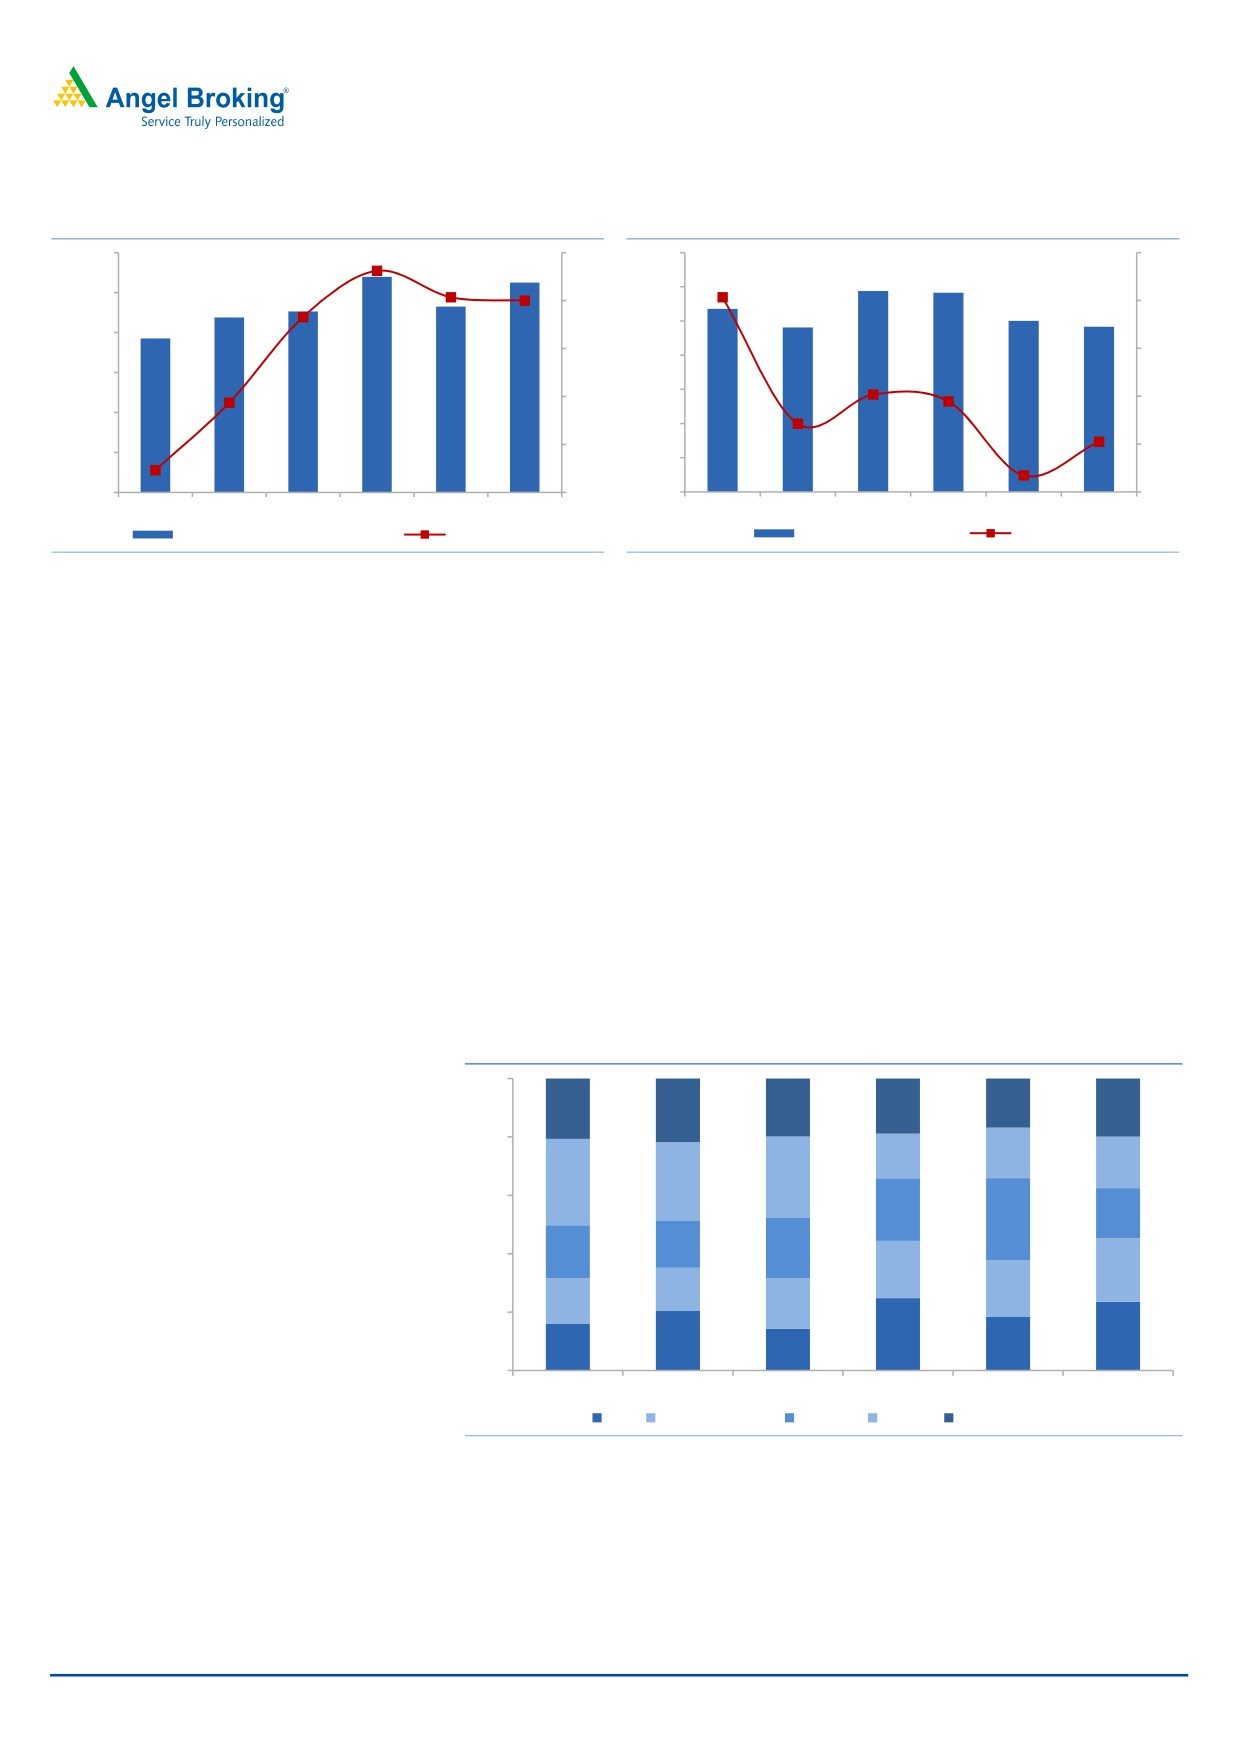
Tata Motors’ standalone revenues continued to recover, reporting the fourth
consecutive quarter of double-digit growth. In 2QFY2016, the standalone top-
line grew a healthy 20% yoy to `10,501cr. While the volumes were flat yoy,
the realization/vehicle grew by 20% yoy led by a better product mix (higher
proportion of MHCV) and price hikes.
JLR reported flat revenues in 2QFY2016. While volume growth was healthy at
12% yoy, realization/vehicle dipped sharply by 11% yoy on account of adverse
product and regional mix. Higher proportion of low priced models (Jaguar XE,
Land Rover Defender and Discover Sport) and lower proportion of China sales
impacted the realization.
November 16, 2015
2
Tata Motors | 2QFY2016 Result Update
Exhibit 3: Standalone revenues recover
Exhibit 4: JLR revenues under pressure
12,000
30
7,000
40
6,000
10,000
20
30
5,000
8,000
10
20
4,000
6,000
3,000
0
10
4,000
2,000
(10)
0
2,000
1,000
0
(20)
0
(10)
1QFY15
2QFY15
3QFY15
4QFY15
1QFY16
2QFY16
1QFY15
2QFY15
3QFY15
4QFY15
1QFY16
2QFY16
Standalone revenues (` cr)
Growth (%)
JLR revenues (GBP Mn)
Growth (%)
Source: Company, Angel Research
Source: Company, Angel Research
JLR’s regional mix has undergone a huge change in the last one year. Given
the slowdown in China, its share in JLR volumes has gone down from 27% in
2QFY2015 to 17.6% in 2QFY2016. Also, given the slowdown in oil producing
and commodity nations such as Russia, Brazil and Middle East countries, the
share of other regions has fallen from 22% in 2QFY2015 to 20% in
2QFY2016. The share of developed nations such as US and UK to overall
volumes increased by 7% and 3% respectively.
Jaguar XE sales have started to pick up and currently constitute about 57% of
the overall Jaguar volumes. Launch of the new XF and XJ has led to fall in the
volumes of the current model. Share of Land Rover Evoque has fallen from
32% in 2QFY2015 to 24% now due to slowdown in the key market - China.
Successful launch of Discovery Sport which replaces Freelander has gone up
from 15% in 2QFY2015 to 24% of overall Land Rover volumes.
Exhibit 5: JLR regional sales mix
100
20.7
21.8
19.9
18.9
16.8
19.9
80
15.3
17.3
17.6
29.5
27.0
27.9
60
21.5
17.1
28.1
16.0
20.7
40
18.1
19.6
21.8
14.8
19.3
15.7
17.2
20
24.8
23.6
20.4
18.5
15.9
14.3
0
1QFY15
2QFY15
3QFY15
4QFY15
1QFY16
2QFY16
UK North America Europe China Other markets
Source: Company, Angel Research
November 16, 2015
3
Tata Motors | 2QFY2016 Result Update
Exhibit 6: Jaguar sales mix
Exhibit 7: Land Rover mix
6.2
21.4
0.2
13.0
14.3
7.3
57.0
11.9
22.6
24.0
22.2
Discovery Sport
Discovery
New Range Rover Sport
XE XF XJ XK F TYPE
Range Rover Evoque
New Range Rover
Others
Source: Company, Angel Research
Source: Company, Angel Research
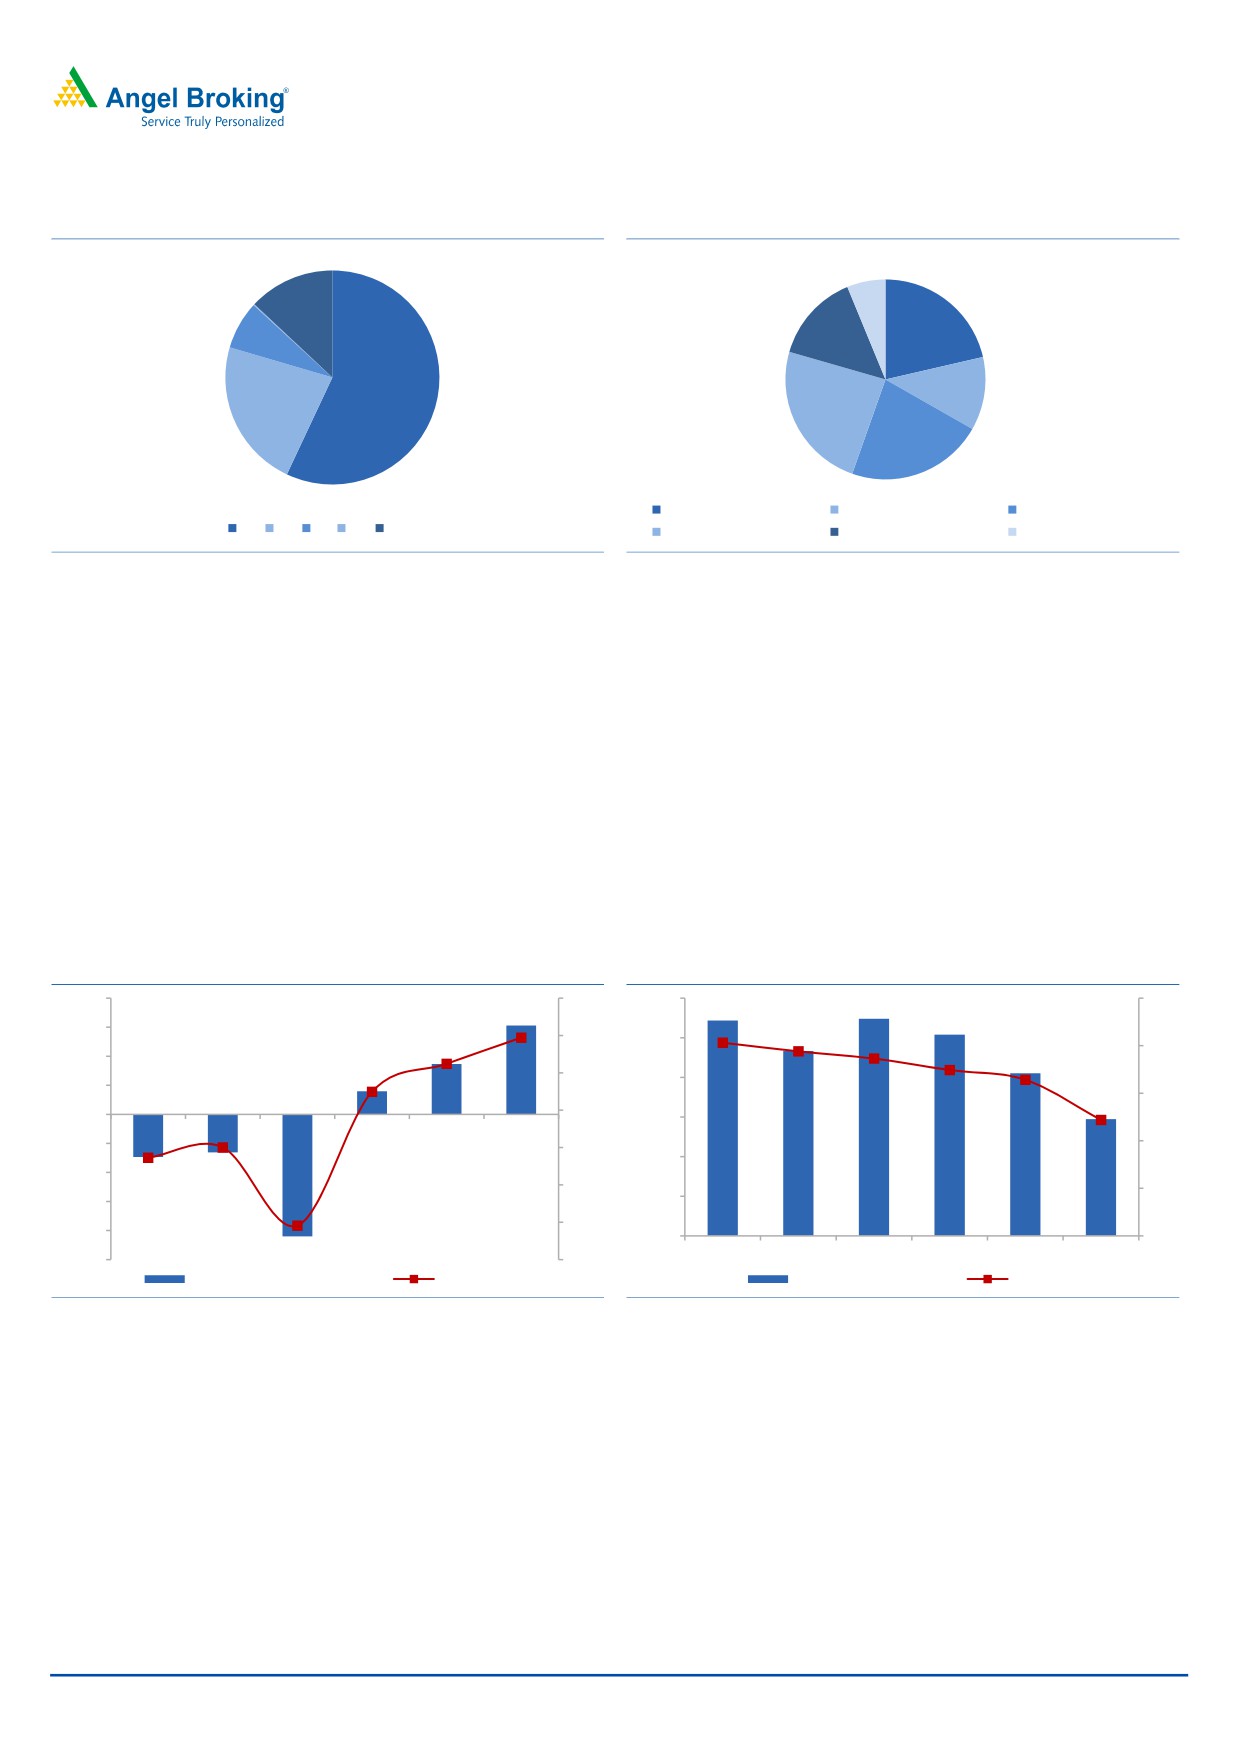
Standalone EBIDTA margins continued to recover, reporting a third
consecutive quarter of positive margins. In 2QFY2016, standalone margins
stood at 5.8% as against -3% in corresponding quarter last year. Robust
revenue growth (20% yoy) coupled with cost control initiatives led to a steep
margin improvement.
JLR margins continued to remain under pressure declining steeply by 720bp
yoy to 12.2%. Adverse product and regional mix, higher marketing expenses
and new product launches (new model and engine upgrades) dented margins.
Further, forex loss of 40mn Euros on commodity hedges also impacted the
margins.
Exhibit 8: Standalone margins continue to recover
Exhibit 9: JLR Margins under pressure
800
9
1,200
25
600
6
1,000
20
400
3
800
200
15
0
0
600
1QFY15
2QFY15
3QFY15
4QFY15
1QFY16
2QFY16
(200)
10
(3)
400
(400)
(6)
5
(600)
200
(9)
(800)
0
0
(1000)
(12)
1QFY15
2QFY15
3QFY15
4QFY15
1QFY16
2QFY16
Standalone Ebidta (` cr)
Margin (%)
JLR Ebidta (GBP mn)
Margin (%)
Source: Company, Angel Research
Source: Company, Angel Research
November 16, 2015
4
Tata Motors | 2QFY2016 Result Update
Conference call - Key highlights
JLR’s margins in the quarter at 12.2% were lower by 720bp yoy and by 420bp
on a sequential basis. The margins were impacted by adverse product and
geographical mix, higher launch expenses (upgrades and new engine
variants) and a forex charge of Euro 40mn on Euro payables.
JLR is ramping production at the China JV. Apart from ramp up of Evoque, it
plans to commence production of Discovery Sport in JV. The loss in the JV in
2QFY2016 stood at GBP 1mn.
JLR has a strong product pipeline which would drive the growth ahead. JLR
recently launched new XF and is scheduled to launch new XJ which would
boost the respective models’ sales. Further it aims to enter the crossover
segment with the launch of the Jaguar F-pace in CY2016.
Given the new product launches and capacity expansion, the capex is likely to
remain at elevated levels. JLR has guided for a capex of more than GBP 3.5
bn for FY2016.
The standalone commercial vehicle business is likely to recover in 2HFY2016.
Tata Motors reported robust double-digit growth in the MHCV segment due to
improved economic growth and pent up demand from fleet operators along
with recovery in the LCV segment on account of pick up in MHCVs and
economic recovery.
The standalone passenger vehicle segment would continue with its strong
growth on back of strong product pipeline. Tata Motors has planned to
introduce two new products in the passenger vehicle space every year till
2020.
Investment arguments
New product launches and entry into new segments to drive growth at JLR: JLR
volumes are likely to grow at a healthy 13% CAGR over FY2015-17 period on
back of new product launches viz Jaguar XJ and XF which would boost the
respective model sales. Also the launch of Land Rover Evoque 16 MY would
also lift sales. Further, JLR’s entry sedan (Jaguar XE) has opened up a new
segment and the company is ramping sales by entering new geographies viz
North America, China and other global markets. Further, JLR will also enter
the crossover segment with the launch of Jaguar F pace in 2016. We believe
the new product launches coupled with entry into new segments would help
maintain double digit volume growth momentum for JLR.
Standalone business performance to improve: After three consecutive years of
double-digit volume decline, the standalone business (comprising of
commercial and passenger vehicles) returned to the growth path in
1HFY2016. The recovery was led by the passenger vehicle segment (forms
about 30% of volumes) which grew 16% yoy. New product launches (Zest and
Bolt) helped bolster sales, leading to market share gains. Also, with a sharp
recovery in the MHCV segment due to revival in the economy, the commercial
vehicle segment’s volumes also recovered. The commercial vehicle segment’s
November 16, 2015
5
Tata Motors | 2QFY2016 Result Update
volume decline moderated to 4% in 1HFY2016 as against a 16% decline in
FY2015.
Tata Motors has lined up new launches in the passenger vehicle segment
which would enable it to further gain market share. Also, the commercial
vehicle segment would continue to recover given the improving MHCV
volumes, on back of better economic growth and due to low base of the
previous year. Further, the LCV segment is also expected to recover from
4QFY2016 due to pick up in MHCV volumes, improving rural consumption
and low base of the previous years. We expect the passenger and the
commercial vehicle segment to grow by 21% and 7%, respectively, in FY2016.
We estimate the company to report profits at the operating level; we estimate
margins at 4.6% in FY2016 as against an operating loss in FY2015.
Outlook and valuation
JLR’s volumes are likely to recover from 2HFY2016 on back of new product
introductions, tapping of new segments, and production ramp up at the China JV.
We expect JLR’s volumes to grow at 13% CAGR over the FY2015-2017 period. JLR
aims to widen its presence across product segments and is poised to become a
stronger luxury car player in the next four to five years. Also, the standalone
business is expected to turn profitable at the operating level in FY2016 on back of
pick up in the commercial as well as passenger vehicle segments and with gradual
reduction in discounts. However, JLR margins are likely to remain under pressure
as the company enters new segments which would lead to direct competition with
established luxury players viz BMW, Audi and Mercedes. We expect JLR margins to
be in 14-15% range as against 18% levels in the last two years. Also, the stock
currently trades at 28.9x its FY2016 and 14.9x its FY2017 adjusted earnings
respectively, leaving limited scope of upside from current levels. Thus, we have a
Neutral view on the stock.
R&D treatment adopted by JLR
We have analysed the R&D expenses recognized by JLR in the profit and loss
statement. We have benchmarked the same with other global peers such as
Volkswagen and BMW and have found that the R&D expenses recognized by JLR
are at 3.6% of sales as against above-5.7% and 5.1% recognized by Volkswagen
and BMW, respectively.
November 16, 2015
6
Tata Motors | 2QFY2016 Result Update
Exhibit 10: R&D Treatment
CY2014
Volkswagen
BMW
JLR*
Revenues
202,458
80,401
21,866
R&D Costs
13120
4566
1411
R&D expensed to P&L… (a)
8519
3067
253
Capitalised R&D expenses
4601
1499
1158
Capitalised %/R&D
35%
33%
82%
Overall R&D exps/sales
6.5%
5.7%
6.5%
Depn exps (Amortisation of Capitailsed
3026
1068
526
Devp cost)… (b)
Gross Block (Capitalised prod devp and
27837
9341
5226
prod development in progress)
Overall Gross Block
241158
95213
12713
Overall P&L exps (R&D chg+Amortisation)..(a+b)
11545
4135
779
% of sales
5.7%
5.1%
3.6%
Source: *JLR nos are for FY2015, Company, Angel Research
Company background
Tata Motors (TTMT) is the largest commercial vehicle manufacturer in India with a
domestic market share of ~55% and ~43% in the MHCV and LCV segments,
respectively. The company also has a domestic market share of ~6% in the
passenger vehicle segment. The company operates from its plants in Jamshedpur,
Pune, Lucknow, Sanand, Pantnagar and Dharwad. TTMT acquired UK based
luxury car manufacturer Jaguar Land Rover (JLR) in June 2008; it now accounts for
~80% of its consolidated revenue.
November 16, 2015
7
Tata Motors | 2QFY2016 Result Update
Profit & Loss Statement (Consolidated)
Y/E March (` cr)
FY2012
FY2013
FY2014
FY2015
FY2016E
FY2017E
Total operating income
165,654
188,818
232,834
262,796
255,254
301,772
% chg
35.6
14.0
23.3
12.9
(2.9)
18.2
Total Expenditure
143,343
164,270
197,980
223,558
222,326
261,274
Net Raw Materials
109,468
120,321
143,586
159,920
154,939
184,383
Personnel
12,298
16,584
21,556
25,549
25,270
28,065
Other
21,577
27,365
32,837
38,089
42,117
48,827
EBITDA
22,311
24,547
34,853
39,239
32,928
40,498
% chg
32.7
10.0
42.0
12.6
(16.1)
23.0
(% of Net Sales)
13.5
13.0
15.0
14.9
12.9
13.4
Depreciation & Amort.
5,625
7,569
11,078
13,389
17,099
20,130
EBIT
17,348
17,790
24,604
26,749
16,862
21,608
% chg
37.8
2.5
38.3
8.7
(37.0)
28.1
(% of Net Sales)
10.5
9.4
10.6
10.2
6.6
7.2
Interest & other Charges
2,982
3,553
4,749
4,861
4,340
4,216
Other Income
662
812
829
899
1,034
1,240
PBT (recurring)
14,365
14,236
19,854
21,887
12,522
17,392
% chg
40.8
(0.9)
39.5
10.2
(42.8)
38.9
Tax
(40)
3,771
4,765
7,643
3,506
4,870
(% of PBT)
(0.3)
26.5
24.0
34.9
28.0
28.0
Minority interest
107
197
6
100
118
143
Exceptional items
(832)
(603)
(985)
(185)
(2,770)
-
PAT (reported)
13,517
9,893
13,991
13,986
6,164
12,425
ADJ. PAT*
11,894
8,362
11,790
10,544
4,698
9,098
% chg
52.4
(29.7)
41.0
(10.6)
(55.4)
93.7
(% of Net Sales)
7.2
4.5
5.1
4.0
1.9
3.0
Basic EPS (`)
44.3
32.3
45.5
43.8
23.7
37.3
Adj EPS* (`)
37.5
26.2
36.6
32.8
13.8
26.8
% chg
54.3
(27.2)
41.0
(3.7)
(45.9)
57.4
*Adjusted for deficient R&D
November 16, 2015
8
Tata Motors | 2QFY2016 Result Update
Balance sheet statement
Y/E March (` cr)
FY2012 FY2013 FY2014 FY2015 FY2016E FY2017E
SOURCES OF FUNDS
Equity Share Capital
635
638
644
644
644
644
Reserves& Surplus
32,064
36,999
64,960
55,618
62,927
74,859
Shareholders Funds
32,699
37,637
65,603
56,262
63,571
75,503
Total Loans
47,149
53,716
60,642
73,610
62,000
62,000
Minority interest
307
370
421
433
533
653
Deferred tax liab
2,165
2,048
1,572
1,343
1,343
1,343
Other long term liab
2,298
3,284
2,597
9,142
9,142
9,142
Total Liabilities
84,617
97,056
130,836
140,791
136,590
148,642
APPLICATION OF FUNDS
Gross Block
89,779
103,132
132,928
158,207
196,207
240,207
Less: Acc. Dep.
49,512
51,723
68,815
74,424
91,523
111,653
Net Block
40,267
51,409
64,113
83,783
104,684
128,554
Capital WIP
15,946
18,454
33,263
28,640
28,640
28,640
Investments
8,918
8,765
10,687
15,337
9,200
9,200
Other long term asset
575
1,024
5,068
858
858
858
Current Assets
70,593
82,195
99,542
102,610
78,361
83,978
Cash
18,238
21,115
29,712
32,116
6,255
56
Other
52,355
61,081
69,830
70,495
72,107
83,922
Current liabilities
60,314
73,322
89,163
97,867
92,584
110,019
Net Current Assets
10,279
8,873
10,379
4,743
(14,222)
(26,040)
Total Assets
84,617
97,056
130,836
140,791
136,590
148,642
November 16, 2015
9
Tata Motors | 2QFY2016 Result Update
Cash flow statement
Y/E March (` cr)
FY2012
FY2013
FY2014
FY2015
FY2016E FY2017E
Profit before tax
13,537
13,727
19,854
21,887
12,522
17,392
Depreciation
9,814
2,210
17,093
5,609
17,099
20,130
Change in Working Capital
(2,852)
(4,283)
(7,091)
(8,040)
6,895
(5,619)
Others
(3,090)
(3,694)
Direct taxes paid
4
(377)
(476)
(764)
(351)
(487)
Cash Flow from Operations
17,412
7,583
29,380
18,692
36,166
31,416
(Inc.)/ Dec. in Fixed Assets
(22,805)
(15,861)
(44,605)
(20,656)
(38,000)
(44,000)
(Inc.)/ Dec. in Investments
(6,373)
153
(1,922)
(4,650)
6,137
0
Cash Flow from Investing
(29,179)
(15,708)
(46,527)
(25,306)
(31,863)
(44,000)
Issue of Equity
(3)
3
6
0
0
0
Inc./(Dec.) in loans
14,338
6,567
6,927
12,968
(11,610)
0
Dividend Paid (Incl. Tax)
(1,481)
(741)
(748)
(748)
(748)
(748)
Others
-
-
-
-
Cash Flow from Financing
12,855
5,829
6,184
12,220
(12,358)
(748)
Inc./(Dec.) in Cash
6,829
2,877
8,597
2,404
(25,861)
(6,199)
Opening Cash balances
11,410
18,238
21,115
29,712
32,116
6,255
Closing Cash balances
18,238
21,115
29,712
32,116
6,255
56
November 16, 2015
10
Tata Motors | 2QFY2016 Result Update
Key ratios
Y/E March
FY2012
FY2013
FY2014
FY2015
FY2016E
FY2017E
Valuation Ratio (x)
P/E (on FDEPS)
9.0
12.4
8.8
9.1
16.9
10.7
P/E (on Adj EPS)
10.7
15.3
10.9
12.2
28.9
14.9
P/CEPS
7.2
8.0
5.6
5.4
5.9
4.4
P/BV
4.0
3.4
2.0
2.3
2.0
1.7
Dividend yield (%)
1.0
1.0
0.5
0.5
0.5
0.5
EV/Sales
0.9
0.8
0.7
0.6
0.8
0.7
EV/EBITDA
7.0
6.5
4.6
4.3
6.1
5.2
EV / Total Assets
1.8
1.7
1.2
1.2
1.5
1.4
Per Share Data (`)
EPS (Basic)
44.3
32.3
45.5
43.8
23.7
37.3
Adj EPS*
37.5
26.2
36.6
32.8
13.8
26.8
Cash EPS
55.2
49.9
71.0
74.4
67.7
90.8
DPS
4.0
4.0
2.0
2.0
2.0
2.0
Book Value
101.0
116.0
201.8
172.8
195.5
232.6
Dupont Analysis
EBIT margin
10.5
9.4
10.6
10.2
6.6
7.2
Tax retention ratio
1.0
0.7
0.8
0.7
0.7
0.7
Asset turnover (x)
2.5
2.5
2.3
2.4
2.0
2.0
ROIC (Post-tax)
26.2
17.2
18.5
16.0
9.3
10.5
Cost of Debt (Post Tax)
6.3
4.9
6.0
4.3
5.0
4.9
Leverage (x)
0.9
0.9
0.5
0.7
0.9
0.8
Operating ROE
43.8
27.9
24.4
24.7
13.1
15.0
Returns (%)
ROCE (Pre-tax)
20.5
18.3
18.8
19.0
12.3
14.5
Angel ROIC (Pre-tax)
26.1
23.4
24.3
24.6
12.9
14.5
ROE
36.4
22.2
18.0
18.7
7.4
12.1
Turnover ratios (x)
Asset Turnover (Gross Block)
1.8
1.8
1.8
1.7
1.3
1.3
Inventory / Sales (days)
40
41
43
41
41
41
Receivables (days)
18
21
17
17
18
18
Payables (days)
10
11
11
11
10
10
WC cycle (ex-cash) (days)
(18)
(24)
(30)
(38)
(29)
(32)
Solvency ratios (x)
Net debt to equity
0.9
0.9
0.5
0.7
0.9
0.8
Net debt to EBITDA
1.3
1.3
0.9
1.1
1.7
1.5
Interest Coverage (EBIT / Int.)
5.8
5.0
5.2
5.5
3.9
5.1
*Adjusted for deficient R&D
November 16, 2015
11
Tata Motors | 2QFY2016 Result Update
Research Team Tel: 022 - 39357800
DISCLAIMER
Angel Broking Private Limited (hereinafter referred to as “Angel”) is a registered Member of National Stock Exchange of India Limited,
Bombay Stock Exchange Limited and Metropolitan Stock Exchange of India Limited. It is also registered as a Depository Participant with
CDSL and Portfolio Manager with SEBI. It also has registration with AMFI as a Mutual Fund Distributor. Angel Broking Private Limited is
a registered entity with SEBI for Research Analyst in terms of SEBI (Research Analyst) Regulations, 2014 vide registration number
INH000000164. Angel or its associates has not been debarred/ suspended by SEBI or any other regulatory authority for accessing
/dealing in securities Market. Angel or its associates including its relatives/analyst do not hold any financial interest/beneficial
ownership of more than 1% in the company covered by Analyst. Angel or its associates/analyst has not received any compensation /
managed or co-managed public offering of securities of the company covered by Analyst during the past twelve months. Angel/analyst
has not served as an officer, director or employee of company covered by Analyst and has not been engaged in market making activity
of the company covered by Analyst.
This document is solely for the personal information of the recipient, and must not be singularly used as the basis of any investment
decision. Nothing in this document should be construed as investment or financial advice. Each recipient of this document should
make such investigations as they deem necessary to arrive at an independent evaluation of an investment in the securities of the
companies referred to in this document (including the merits and risks involved), and should consult their own advisors to determine
the merits and risks of such an investment.
Reports based on technical and derivative analysis center on studying charts of a stock's price movement, outstanding positions and
trading volume, as opposed to focusing on a company's fundamentals and, as such, may not match with a report on a company's
fundamentals.
The information in this document has been printed on the basis of publicly available information, internal data and other reliable
sources believed to be true, but we do not represent that it is accurate or complete and it should not be relied on as such, as this
document is for general guidance only. Angel Broking Pvt. Limited or any of its affiliates/ group companies shall not be in any way
responsible for any loss or damage that may arise to any person from any inadvertent error in the information contained in this report.
Angel Broking Pvt. Limited has not independently verified all the information contained within this document. Accordingly, we cannot
testify, nor make any representation or warranty, express or implied, to the accuracy, contents or data contained within this document.
While Angel Broking Pvt. Limited endeavors to update on a reasonable basis the information discussed in this material, there may be
regulatory, compliance, or other reasons that prevent us from doing so.
This document is being supplied to you solely for your information, and its contents, information or data may not be reproduced,
redistributed or passed on, directly or indirectly.
Neither Angel Broking Pvt. Limited, nor its directors, employees or affiliates shall be liable for any loss or damage that may arise from
or in connection with the use of this information.
Note: Please refer to the important ‘Stock Holding Disclosure' report on the Angel website (Research Section). Also, please refer to the
latest update on respective stocks for the disclosure status in respect of those stocks. Angel Broking Pvt. Limited and its affiliates may
have investment positions in the stocks recommended in this report.
Disclosure of Interest Statement
Tata Motors
1. Analyst ownership of the stock
No
2. Angel and its Group companies ownership of the stock
No
3. Angel and its Group companies' Directors ownership of the stock
No
4. Broking relationship with company covered
No
Note: We have not considered any Exposure below ` 1 lakh for Angel, its Group companies and Directors
Ratings (Based on expected returns
Buy (> 15%)
Accumulate (5% to 15%)
Neutral (-5 to 5%)
over 12 months investment period):
Reduce (-5% to -15%)
Sell (< -15)
November 16, 2015
12