4QFY2016 Result Update | Tyres
May 18, 2016
TVS Srichakra
BUY
CMP
`2,419
Performance Update
Target Price
`2,932
Y/E March (` cr)
4QFY2016
4QFY2015
% chg (yoy) 3QFY2016
% chg (qoq)
Investment Period
12 Months
Total Income
525
465
13.0
509
3.2
EBITDA
76
64
18.5
81
(6.2)
Stock Info
EBITDA margin (%)
14.5
13.8
68bp
15.9
(145)bp
Adj PAT
44
34
28.2
48
(9.4)
Sector
Tyres
Source: Company, Angel Research
Market Cap (` cr)
1,852
TVS Srichakra (TVSSL) reported a good set of numbers for 4QFY2016. Its
Beta
1.1
top-line grew by 13.0% yoy to `525cr. On the operating front, the raw material
Net debt (` cr)
57
cost came down significantly, ie by 805bp yoy to 48.1% of sales. Still, the EBITDA
52 Week High / Low
3,249 / 1,600
margin expanded by a marginal 68bp yoy to 14.5% as raw material cost savings
Avg. Daily Volume
3,954
were offset by higher employee and other expenses. The depreciation expense
Face Value (`)
10
declined by 36.1% on a yoy basis owing to higher depreciation in 4QFY2015
BSE Sensex
25,774
(adjustments in accounting policy in the previous year). The other income increased to
Nifty
7,891
`18cr (against `3cr in 4QFY2015) which we believe was owing to profits from sale of its
subsidiary. Adjusting for the higher other income, the profit grew by 28.2% yoy to `44cr.
Reuters Code
TVSC.BO
Bloomberg Code
SRTY IN
Leadership position in 2W OEM segment and growing share in aftermarket
segment: TVSSL has been able to maintain its leadership position in the 2W OEM
segment and grow further in the aftermarket space which has enabled it to post
Shareholding Pattern (%)
good growth in the past year despite of fall in realizations. Going forward, we
Promoters
45.4
believe the company will be able to maintain growth on the top-line front given
MF / Banks / Indian Fls
1.4
the encouraging outlook for the 2W industry. The company continues to invest in
brand building and promotions to compete better in the aftermarket space.
FII / NRIs / OCBs
0.5
Indian Public / Others
52.8
Outlook and valuation: TVVSL has been outperforming the tyre industry over the
past two years which has resulted in it posting good growth on the top-line front
despite of declining realizations. While rubber prices have surged recently, we
Abs.(%)
3m 1yr
3yr
believe that TVVSL will be able to pass on the increase in RM cost in the OEM
segment. Additionally, the outlook on the 2W industry is favorable which augurs
Sensex
(6.3)
(14.3)
25.3
well for the company as it is predominantly a 2W tyre manufacturer. We expect
TVSSL
(7.7)
54.5
914.8
the company to post revenue CAGR of 12.6% over FY2016-18E to `2,614cr. With
higher RM prices, we expect margins to contract by 182bp over FY2016-18E to
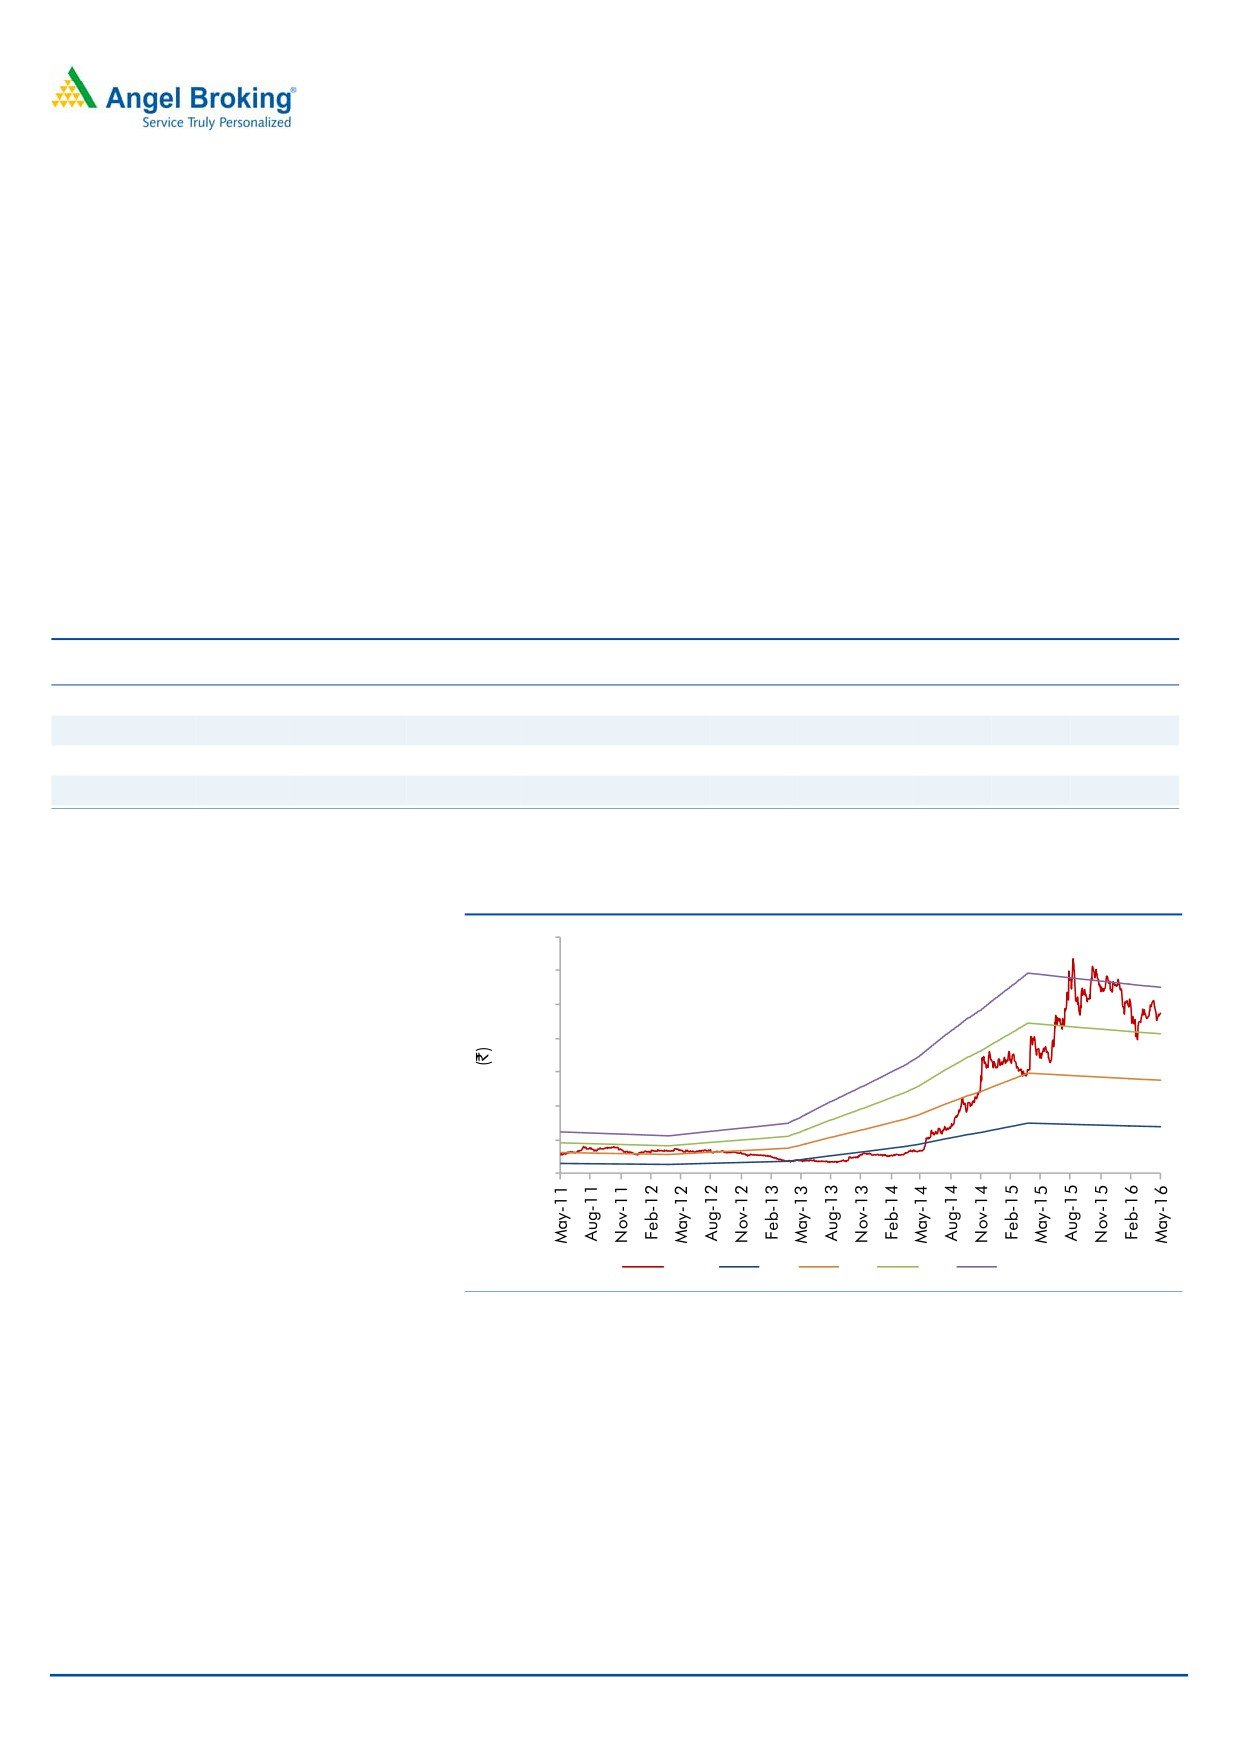
3 year price chart
13.8%. The company has increased its capacity and plans to invest in further
3,500
capacity expansion which will increase the depreciation expense going forward.
3,000
Consequently the bottom-line is expected to improve to `204cr in FY2018E. At the
2,500
current market price, the stock trades at 9.1x its FY2018E earnings. We have a
2,000
Buy rating on the stock with a revised target price of `2,932 based on a target PE
1,500
of 11.0x for FY2018E earnings.
1,000
Key financials
500
Y/E March (` cr)
FY2014
FY2015
FY2016
FY2017E
FY2018E
-
Net sales
1,671
1,896
2,060
2,304
2,614
% chg
13.2
13.5
8.6
11.9
13.4
Net profit
47
104
189
177
204
% chg
33.0
118.8
82.2
(6.4)
15.3
Source: Company, Angel Research
EBITDA margin (%)
7.2
11.5
15.6
13.7
13.8
EPS (`)
61.9
135.5
247.0
231.1
266.6
P/E (x)
39.1
17.8
9.8
10.5
9.1
P/BV (x)
9.1
6.7
4.4
3.4
2.7
RoE (%)
23.3
37.6
45.2
32.3
29.3
RoCE (%)
17.7
33.7
40.3
33.0
32.0
Milan Desai
EV/Sales (x)
1.3
1.1
0.9
0.8
0.7
39357800 ext: 6846
EV/EBITDA (x)
17.8
9.3
5.9
5.8
4.9
Source: Company, Angel Research; Note: CMP as of May 17, 2016
Please refer to important disclosures at the end of this report
1
TVS Srichakra | 4QFY2016 Result Update
Exhibit 1: 4QFY2016 performance
Y/E March (` cr)
4QFY2016
4QFY2015
% chg (yoy)
3QFY2016
% chg (qoq)
FY2016
FY2015
% chg
Net Sales
525
465
13.0
509
3.2
2,060
1,896
8.6
Net raw material
252
261
(3.2)
258
(2.1)
1,040
1,123
(7.4)
(% of Sales)
48.1
56.1
(805)bp
50.7
(265)bp
50.5
59.3
(877)bp
Staff Costs
57
43
33.4
48
19.0
202
164
22.9
(% of Sales)
10.8
9.2
166bp
9.4
144bp
9.8
8.7
114bp
Other Expenses
140
97
43.8
122
14.7
496
391
26.9
(% of Sales)
26.6
20.9
571bp
23.9
266bp
24.1
20.6
346bp
Total Expenditure
449
401
12.1
428
5.0
1,738
1,678
3.5
Operating Profit
76
64
18.5
81
(6.2)
322
218
48.1
OPM
14.5
13.8
68bp
15.9
(145)bp
15.6
11.5
417bp
Interest
3
4
(30.3)
3
(7.1)
15
30
(50.6)
Depreciation
12
19
(36.1)
10
19.4
42
40
6.2
Other Income
18
3
573.0
0
5487.9
22
4
496.5
Exceptional Item
-
-
-
-
(12)
PBT
80
44
80.9
68
16.7
287
140
105.9
(% of Sales)
15.2
9.5
13.4
14.0
7.4
Tax
28
10
179.6
20
38.8
90
36
152.1
(% of PBT)
35.1
22.7
29.5
31.4
25.6
Reported PAT
52
34
52.0
48
7.4
197
104
90.0
Adjusted PAT
44
34
48
189
104
82.2
PATM
8.3
7.3
9.5
9.2
5.5
Equity capital (cr)
8
8
8
8
8
EPS (`)
56.9
44.4
28.2
62.8
(9.4)
247.0
135.5
90.0
Source: Company, Angel Research
Exhibit 2: Actual vs. Angel estimate (4QFY2016)
(` cr)
Actual (` cr)
Estimate (` cr)
% variation
Total Income
525
502
4.6
EBIDTA
76
77
(1.0)
EBIDTA margin
14.5
15.3
(82)bp
Adj. PAT
44
45
(2.7)
Source: Company, Angel Research
Top-line beats estimates, overall numbers in-line.
TVSSL reported a good set of numbers for 4QFY2016. The top-line grew by an
impressive 13.0% yoy to `525cr which is ahead of our expectation of `502cr. The
company has been outperforming the industry in the past two years with it having
gained market share in the aftermarket segment and maintained its leadership
position in the OEM segment. The company has increased its capacity from 2.0mn
tyres per month as at the end of FY2015 to 2.3mn in December 2015; the
Management stated that the company’s average production for FY2016 was of
2.2mn tyres per month.
May 18, 2016
2
TVS Srichakra | 4QFY2016 Result Update
Exhibit 3: Top-line maintaining good growth
Exhibit 4: Lower RM cost led to margin expansion
20.0
17.9
18.5
18.0
61.9
70.0
500
17.2
61.4
15.7
15.9
18.0
57.6
16.0
56.1
60.0
16.0
51.216.5
14.5
400
14.0
14.0
50.0
1
3.0
11.7
12.0
13.8
52.0
12.0
50.7
40.0
300
12.8
10.0
48.1
8.0
10.0
30.0
200
6.5
6.0
8.0
20.0
8.9
10.3
4.0
4.0
100
6.0
10.0
1.8
2.0
-
-
4.0
-
Revenue (LHS)
yoy growth (RHS)
EBITDA margin (LHS)
RM cost/sales (RHS)
Source: Company, Angel Research
Source: Company, Angel Research
On the operating front, the raw material cost as a percentage of sales declined by
805bp yoy to 48.1%; however, the EBITDA margin expanded only by 68bp yoy to
14.5% (vs our estimate of 15.3%) on account of higher employee and other
expenses. The company has been aggressive in terms of promotion over the past
few quarters which resulted in other expenses for 4QFY2016 increasing by 571bp
yoy to 26.6% of sales. The employee expense too increased by 166bp yoy to
10.8% of sales.
The interest expense declined by 30.3% yoy to `3cr while depreciation was lower
on a yoy basis by 36.1% (on account of higher depreciation in the corresponding
quarter of the previous year due to change in accounting policy).
The other income increased to `18cr (against `3cr in 4QFY2015) which we
estimate to be on account of profits from the recent sale of its subsidiary. Adjusting
for this, the net profit grew by 28.2% yoy to `44cr, which is in-line with our
estimate of `45cr.
Exhibit 5: Declining interest cost
Exhibit 6: Profits growth yoy
60
183.7
200.0
12
10.0
50
150.0
10
8.5
7.3
40
8
86.9
100.0
81.9
30
43.6
5.2
28
.2
6
50.0
4.1
15.1
3.6
20
4
3.1
2.9
(28.3)
-
10
2
-
(50.0)
-
PAT (LHS)
yoy growth (RHS)
Source: Company, Angel Research
Source: Company, Angel Research
May 18, 2016
3
TVS Srichakra | 4QFY2016 Result Update
Investment rationale
Higher share in Aftermarket segment to aid growth
The company’s outperformance to the industry in FY2016 is mainly on back of its
increasing share in the aftermarket segment. The company ranks third in terms of
market share in the aftermarket space and has been aggressive in promotions and
advertisements to attain higher brand recall, which should enable it to sustain if
not grow its market share. As we had reported in the past, Chinese tyres do not
cover a significant market share in the aftermarket segment for two-wheelers and
therefore are not much of a threat to the company.
Leadership position in 2W OEM and better outlook on the
industry to aid growth
After a stellar 9.3% growth in 2W sales in FY2015, the segment reported a muted
growth of 2.6% for FY2016 on account of stressed rural economy. Despite of
muted numbers posted by the 2W industry in FY2016, TVSSL numbers suggest that
it was able to maintain its share with key clients like HMSI which posted flattish
volumes and especially its group company TVS Motor which reported sales volume
growth of 5.6% in FY2016. Within the 2W space, the scooter segment has
performed well with sales growing by 12.6% in FY2016 against flattish growth in
the motorcycle segment. Both HMSI and TVS Motor reported strong growth rates of
12.1% yoy and 6.2% yoy respectively in the scooter segment.
Exhibit 7: 2W/3W growth (yoy)
Exhibit 8: 2W sales growth by manufacturer (yoy)
2-wheeler
3-wheeler
40.0
Bajaj
HMCL
HMSIL
TVS
35.0
27.9
25.0
18.7
20.0
11.8
15.0
20.0
12.6
9.3
15.0
7.0
12.9
7.4
0.9
2.3
0.0
5.0
3.2
(0.4)
(2.1)
3.6
1.4
1.6
(3.4)
(5.0)
0.1
(3.0)
(20.0)
(7.7)
(15.0)
4QFY14
2QFY15
4QFY15
2QFY16
4QFY16
Source: Company, Angel Research
Source: Company, Angel Research
Exhibit 9: Key Clients Sales (Domestic +Exports) Growth
HMSI
TVS Motor
(Units)
FY2015
FY2016
yoy (%)
FY2015
FY2016
yoy (%)
Scooters
25,80,161
28,92,779
12.1
14,60,290
15,51,074
6.2
Motorcycles
18,59,820
15,91,056
(14.5)
9,52,242
10,16,807
6.8
Source: SIAM, Angel Research
May 18, 2016
4
TVS Srichakra | 4QFY2016 Result Update
Going forward, 2W sales are expected to improve on account of increased rural
allocation in the Union Budget 2016-17, expectations of a favorable monsoon,
and positive impact of the Seventh Pay Commission. The scooter segment is
expected to maintain its growth rate and HMSI is likely to post robust numbers as it
is expected to commence a second production line at its Gujarat facility in order to
bring down the waiting period for Activa from near six months.
Given its leadership position in the 2W OEM segment, and positive outlook on the
2W industry, we expect TVSSL to maintain its performance on the top-line front.
Agreement with Michelin adds to revenue visibility
TVSSL has an agreement with French tyre major Michelin to manufacture 2W bias
tyres designed by Michelin at its Madurai facility. As per the agreement, TVSSL
would contract manufacture 2W bias tyres under the Michelin brand name and it
will also be manufacturing some tyres from its own range of 2W tyres. The
agreement is encouraging as it not only provides revenue visibility but also speaks
volumes about trust in TVSSL’s technological and manufacturing capabilities.
May 18, 2016
5
TVS Srichakra | 4QFY2016 Result Update
Financial performance
The company is estimated to have posted good volume growth in the range of 11-
12% in FY2016 while realizations were down which resulted in 8.6% yoy growth in
top-line for the year. As for realizations from the OEM segment, escalations in raw
material prices are passed on and this should protect the company from the recent
rebound in natural rubber prices in the domestic market which have jumped by
~31.4% in 1QFY2017 to `131/Kg. On account of higher realizations coupled with
improvement in volumes, we expect the company to post revenue CAGR of 12.6%
over FY2016-18E to `2,614cr.
Exhibit 10: Revenue to grow at 12.6% CAGR
Exhibit 11: EBITDA Margin to witness contraction
EBITDA (LHS)
EBITDA margin (RHS)
Revenue (LHS)
Revenue growth (RHS)
400
18.0
2,800
16.0
13.5
350
16.0
2,400
13.
4
14.0
11.9
15.6
13
.8
13.2
13.7
14.0
12.0
300
11.5
2,000
12.0
8.6
10.0
250
1,600
10.0
8.0
200
7.2
1,200
5.7
8.0
6.0
150
5.1
6.0
800
4.0
100
4.0
400
2.0
50
2.0
-
-
-
-
FY2013
FY2014
FY2015
FY2016
FY2017E FY2018E
FY2013
FY2014
FY2015
FY2016
FY2017E FY2018E
Source: Company, Angel Research
Source: Company, Angel Research
We have revised our natural rubber cost per Kg upwards from our flattish estimate
of `118/kg to `130/Kg for FY2017E and expect rubber prices to rise up to
~`140/kg in FY2018E. As a result, we expect margins to come under pressure
and expect 182bp contraction in EBITDA margin over FY2016-18E to 13.8%. The
company is estimated to have incurred capex of ~`160cr in FY2016 to increase its
capacity to 2.3mn tyres/month. The company will be scaling it up to 2.5mn
tyres/month in FY2017E and we estimate it to further expand the capacity by
similar quantum in FY2018E which will result in higher depreciation expense. As a
result, the net profit is expected to be at `204cr in FY2018E.
Exhibit 12: Net profit trend
140.0
200
120.0
118.8
100.0
150
82.2
80.0
60.0
100
40.0
33.0
20.0
50
15.3
-
(6.4)
(10.3)
-
(20.0)
FY2013
FY2014
FY2015
FY2016
FY2017E FY2018E
PAT (LHS)
PAT growth (RHS)
Source: Company, Angel Research
May 18, 2016
6
TVS Srichakra | 4QFY2016 Result Update
Outlook and valuation
TVVSL has been outperforming the tyre industry over the past two years which has
resulted in it posting good growth on the top-line front despite of declining
realizations. While rubber prices have surged recently, we believe that TVVSL will
be able to pass on the increase in RM cost in the OEM segment. Additionally, the
outlook on the 2W industry is favorable which augurs well for the company as it is
predominantly a 2W tyre manufacturer. We expect the company to post revenue
CAGR of 12.6% over FY2016-18E to `2,614cr. With higher RM prices, we expect
margins to contract by 182bp over FY2016-18E to 13.8%. The company has
increased its capacity and plans to invest in further capacity expansion which will
increase the depreciation expense going forward. Consequently the bottom-line is
expected to improve to `204cr in FY2018E. At the current market price, the stock
trades at 9.1x its FY2018E earnings. We have a Buy rating on the stock with a
revised target price of `2,932 based on a target PE of 11.0x for FY2018E
earnings.
Exhibit 11: Relative valuation
Mcap
Sales
OPM
PAT
EPS
ROE
P/E
P/BV
EV/
Company
Year
(` cr)
(` cr)
(%)
(` cr)
(`)
(%)
(x)
(x)
Sales (x)
TVSSL
FY2018E
1,852
2,614
13.8
204
266.6
29.3
9.1
2.7
0.7
CEAT
FY2018E
4,066
7,116
13.0
498
122.9
18.1
8.2
1.4
0.6
Apollo tyres
FY2018E
7,819
14,731
15.2
1,108
21.8
14.5
7.0
1.0
0.6
MRF
FY2018E
13,920
16,985
20.1
1,733
4,015.0
19.0
8.2
1.5
0.8
Source: Company, Angel Research, Bloomberg
Exhibit 12: One-year forward PE band
3,500
3,000
2,500
2,000
1,500
1,000
500
-
Price
3x
6x
9x
12x
Source: Company, Angel Research
Key downside risks to our recommendation: Any rise in rubber prices, increase in
inflation, increasing competition, slowdown in 2W and 3W industry and lower-
than-expected demand in the replacement market will have an adverse impact on
the company’s performance. The import duty on natural rubber has been
increased from 20% or `30/kg to 25% or `30/kg. Further upward revision in the
duty will have an adverse impact on TVSSL’s profitability.
May 18, 2016
7
TVS Srichakra | 4QFY2016 Result Update
The Company
TVSSL is a part of the TVS Group. The company is a leading manufacturer of
two-wheeler and three-wheeler tyres. The company manufactures a complete
range of two-wheeler and three-wheeler tyres for the domestic market. For the
export market, the company manufactures industrial pneumatic tyres, farm and
implements tyres, skid steer tyres, multipurpose tyres and floatation tyres, among
others. TVSSL’s manufacturing units are located at Madurai, Tamil Nadu and
Pantnagar, Uttarakhand. With a network of over 2,400 dealers and 34 depots
across the country, the company is a major supplier to TVS Motors, Hero
MotoCorp, HMSI, Bajaj Auto, LML, Piaggio, Atul Auto Ltd., Mahindra 2Wheelers
and India Yamaha Motor. The company also exports to the US, Europe, South
America, Africa and Australia.
May 18, 2016
8
TVS Srichakra | 4QFY2016 Result Update
Profit & Loss Statement (Standalone)
Y/E March (` cr)
FY2014
FY2015
FY2016
FY2017E
FY2018E
Total operating income
1,671
1,896
2,060
2,304
2,614
% chg
13.2
13.5
8.6
11.9
13.4
Net Raw Materials
1104
1123
1040
1225
1408
% chg
9.2
1.7
(7.4)
17.8
14.9
Personnel
125
164
202
220
242
% chg
10.5
31.5
22.9
8.9
10.1
Other
322
391
496
543
603
% chg
20.6
21.3
26.9
9.5
11.0
Total Expenditure
1551
1678
1738
1987
2252
EBITDA
120
218
322
317
362
% chg
41.1
81.7
48.1
(1.8)
14.2
(% of Net Sales)
7.2
11.5
15.6
13.7
13.8
Depreciation& Amortisation
24
40
42
57
72
EBIT
96
178
280
260
290
% chg
58.5
85.0
57.5
(7.2)
11.6
(% of Net Sales)
5.8
9.4
13.7
11.4
11.2
Interest & other Charges
42
30
15
14
10
Other Income
1
4
22
7
12
(% of Net Sales)
0.1
0.2
0.2
0.0
0.0
Recurring PBT
55
148
265
246
279
% chg
1477.9
171.2
79.4
(7.3)
13.6
Exceptional Item
-
(12)
-
-
-
PBT (reported)
56
140
287
253
291
Tax
8
36
90
76
87
(% of PBT)
15.2
25.6
31.4
30.0
30.0
PAT (reported)
47
104
197
177
204
Extraordinary Expense/(Inc.)
-
-
8
-
-
ADJ. PAT
47
104
189
177
204
% chg
33.0
118.8
82.2
(6.4)
15.3
(% of Net Sales)
2.9
5.5
9.3
7.8
7.9
Basic EPS (`)
61.9
135.5
247.0
231.1
266.6
Fully Diluted EPS (`)
61.9
135.5
247.0
231.1
266.6
May 18, 2016
9
TVS Srichakra | 4QFY2016 Result Update
Balance Sheet (Standalone)
Y/E March (` cr)
FY2014
FY2015
FY2016E
FY2017E
FY2018E
SOURCES OF FUNDS
Equity Share Capital
8
8
8
8
8
Reserves& Surplus
196
269
411
540
689
Shareholders’ Funds
204
276
419
548
696
Total Loans
304
205
156
119
91
Other Long Term Liabilities
10
15
88
88
88
Long Term Provisions
3
8
4
4
4
Deferred Tax Liability
22
23
28
28
28
Total Liabilities
541
527
694
786
907
APPLICATION OF FUNDS
Gross Block
370
446
536
670
844
Less: Acc. Depreciation
141
179
222
279
350
Net Block
229
267
314
391
493
Capital Work-in-Progress
20
18
92
80
40
Goodwill
-
-
-
-
-
Investments
19
32
87
87
87
Long Term Loans and adv.
53
65
35
35
35
Other Non-current asset
12
7
1
1
1
Current Assets
505
411
429
499
598
Cash
8
9
12
36
72
Loans & Advances
24
25
38
43
49
Inventory
207
210
208
232
263
Debtors
266
167
171
189
214
Other current assets
-
-
-
-
-
Current liabilities
297
274
264
307
348
Net Current Assets
207
137
165
192
250
Misc. Exp. not written off
-
-
-
-
-
Total Assets
541
527
694
786
907
May 18, 2016
10
TVS Srichakra | 4QFY2016 Result Update
Cash Flow Statement (Standalone)
Y/E March (` cr)
FY2014
FY2015
FY2016
FY2017E FY2018E
Profit before tax
56
140
287
253
291
Depreciation
24
40
42
57
72
Change in Working Capital
(81)
72
(26)
(3)
(21)
Direct taxes paid
(8)
(37)
(85)
(76)
(87)
Others
25
27
(22)
(7)
(12)
Cash Flow from Operations
15
242
197
224
242
(Inc.)/Dec. in Fixed Assets
(57)
(74)
(163)
(122)
(134)
(Inc.)/Dec. in Investments
0
(13)
(55)
-
-
(Incr)/Decr In LT loans & adv.
(7)
(7)
36
-
-
Others
(7)
(1)
22
7
12
Cash Flow from Investing
(70)
(95)
(159)
(115)
(122)
Issue of Equity
0
-
-
-
-
Inc./(Dec.) in loans
71
(88)
20
(37)
(28)
Dividend Paid (Incl. Tax)
(14)
(31)
(55)
(48)
(55)
Others
(38)
(26)
-
-
-
Cash Flow from Financing
19
(145)
(35)
(85)
(84)
Inc./(Dec.) in Cash
(37)
1
3
24
37
Opening Cash balances
45
8
9
12
36
Closing Cash balances
8
9
12
36
72
May 18, 2016
11
TVS Srichakra | 4QFY2016 Result Update
Key Ratios (Standalone)
Y/E March
FY2014
FY2015
FY2016
FY2017E
FY2018E
Valuation Ratio (x)
P/E (on FDEPS)
39.1
17.8
9.8
10.5
9.1
P/CEPS
26.1
12.9
8.0
7.9
6.7
P/BV
9.1
6.7
4.4
3.4
2.7
Dividend yield (%)
0.7
1.4
2.5
2.1
2.5
EV/Net sales
1.3
1.1
0.9
0.8
0.7
EV/EBITDA
17.8
9.3
5.9
5.8
4.9
EV / Total Assets
3.9
3.8
2.8
2.4
2.0
Per Share Data (`)
EPS (Basic)
61.9
135.5
247.0
231.1
266.6
EPS (fully diluted)
61.9
135.5
247.0
231.1
266.6
Cash EPS
92.9
187.6
312.9
305.5
360.2
DPS
16.0
33.8
60.0
52.0
60.0
Book Value
266.0
360.8
546.6
715.1
909.5
DuPont Analysis
EBIT margin
5.8
9.4
13.7
11.4
11.2
Tax retention ratio
0.8
0.7
0.7
0.7
0.7
Asset turnover (x)
3.4
4.0
4.1
3.9
3.7
ROIC (Post-tax)
16.5
28.3
38.2
31.2
28.7
Cost of Debt (Post Tax)
11.6
10.8
6.5
8.1
8.1
Leverage (x)
1.2
1.0
0.4
0.1
-0.1
Operating ROE
22.2
45.3
49.7
32.7
27.6
Returns (%)
ROCE (Pre-tax)
17.7
33.7
40.3
33.0
32.0
Angel ROIC (Pre-tax)
19.5
38.1
55.6
44.5
41.0
ROE
23.3
37.6
45.2
32.3
29.3
Turnover ratios (x)
Asset TO (Gross Block)
4.9
4.6
4.2
3.8
3.4
Inventory / Net sales (days)
51
40
37
35
35
Receivables (days)
50
42
30
30
30
Payables (days)
77
62
56
56
56
WC cycle (ex-cash) (days)
44
25
27
25
25
Solvency ratios (x)
Net debt to equity
1.5
0.7
0.3
0.2
0.0
Net debt to EBITDA
2.3
0.8
0.2
(0.0)
(0.2)
Int. Coverage (EBIT/ Int.)
2.3
5.9
18.9
18.9
27.6
May 18, 2016
12
TVS Srichakra | 4QFY2016 Result Update
Research Team Tel: 022 - 39357800
DISCLAIMER
Angel Broking Private Limited (hereinafter referred to as “Angel”) is a registered Member of National Stock Exchange of India Limited,
Bombay Stock Exchange Limited and Metropolitan Stock Exchange of India Limited. It is also registered as a Depository Participant with
CDSL and Portfolio Manager with SEBI. It also has registration with AMFI as a Mutual Fund Distributor. Angel Broking Private Limited is
a registered entity with SEBI for Research Analyst in terms of SEBI (Research Analyst) Regulations, 2014 vide registration number
INH000000164. Angel or its associates has not been debarred/ suspended by SEBI or any other regulatory authority for accessing
/dealing in securities Market. Angel or its associates including its relatives/analyst do not hold any financial interest/beneficial
ownership of more than 1% in the company covered by Analyst. Angel or its associates/analyst has not received any compensation /
managed or co-managed public offering of securities of the company covered by Analyst during the past twelve months. Angel/analyst
has not served as an officer, director or employee of company covered by Analyst and has not been engaged in market making activity
of the company covered by Analyst.
This document is solely for the personal information of the recipient, and must not be singularly used as the basis of any investment
decision. Nothing in this document should be construed as investment or financial advice. Each recipient of this document should
make such investigations as they deem necessary to arrive at an independent evaluation of an investment in the securities of the
companies referred to in this document (including the merits and risks involved), and should consult their own advisors to determine
the merits and risks of such an investment.
Reports based on technical and derivative analysis center on studying charts of a stock's price movement, outstanding positions and
trading volume, as opposed to focusing on a company's fundamentals and, as such, may not match with a report on a company's
fundamentals.
The information in this document has been printed on the basis of publicly available information, internal data and other reliable
sources believed to be true, but we do not represent that it is accurate or complete and it should not be relied on as such, as this
document is for general guidance only. Angel Broking Pvt. Limited or any of its affiliates/ group companies shall not be in any way
responsible for any loss or damage that may arise to any person from any inadvertent error in the information contained in this report.
Angel Broking Pvt. Limited has not independently verified all the information contained within this document. Accordingly, we cannot
testify, nor make any representation or warranty, express or implied, to the accuracy, contents or data contained within this document.
While Angel Broking Pvt. Limited endeavors to update on a reasonable basis the information discussed in this material, there may be
regulatory, compliance, or other reasons that prevent us from doing so.
This document is being supplied to you solely for your information, and its contents, information or data may not be reproduced,
redistributed or passed on, directly or indirectly.
Neither Angel Broking Pvt. Limited, nor its directors, employees or affiliates shall be liable for any loss or damage that may arise from
or in connection with the use of this information.
Note: Please refer to the important ‘Stock Holding Disclosure' report on the Angel website (Research Section). Also, please refer to the
latest update on respective stocks for the disclosure status in respect of those stocks. Angel Broking Pvt. Limited and its affiliates may
have investment positions in the stocks recommended in this report.
Disclosure of Interest Statement
TVS Srichakra
1. Analyst ownership of the stock
No
2. Angel and its Group companies ownership of the stock
No
3. Angel and its Group companies' Directors ownership of the stock
No
4. Broking relationship with company covered
No
Note: We have not considered any Exposure below ` 1 lakh for Angel, its Group companies and Directors
Ratings (Based on expected returns
Buy (> 15%)
Accumulate (5% to 15%)
Neutral (-5 to 5%)
over 12 months investment period):
Reduce (-5% to -15%)
Sell (< -15)
May 18, 2016
13