3QFY2016 Result Update | Tyres
February 8, 2016
TVS Srichakra
BUY
CMP
`2,528
Performance Update
Target Price
`3,217
Y/E March (` cr)
3QFY2016
3QFY2015
% chg (yoy) 2QFY2016
% chg (qoq)
Investment Period
12 Months
Total Income
509
489
4.0
522
(2.6)
EBITDA
81
63
29.3
82
(1.2)
Stock Info
EBITDA margin (%)
15.9
12.8
313
15.7
22
Sector
Tyres
Adj PAT
48
26
81.9
49
(1.1)
Market Cap (` cr)
1,936
Source: Company, Angel Research
Beta
1.1
TVS Srichakra (TVSSL) reported a good set of numbers for 3QFY2016. The
Net debt (` cr)
164
top-line grew by 4.0% yoy to `509cr. The EBITDA margin expanded by 313bp yoy
52 Week High / Low
3,249 / 1,408
to 15.7%, mainly due to a 689bp yoy decline in raw material cost as a
Avg. Daily Volume
3,954
percentage of sales as domestic rubber prices declined by ~10.0% on a yoy basis
Face Value (`)
10
and ~8.0% on a qoq basis. As a result, the EBITDA grew by 29.3% yoy to `81cr.
BSE Sensex
24,287
The company has reduced its debt in the current fiscal. Lower debt level (~`37cr
Nifty
7,387
as on 1HFY2016 excluding current maturities) has resulted in interest expense
Reuters Code
TVSC.BO
declining by 57.7% yoy to `3cr for 3QFY2016. Owing to a better operational
Bloomberg Code
SRTY IN
performance and lower interest outgo, the net profit nearly doubled to `48cr from
`26cr in the same quarter of the previous year.
Shareholding Pattern (%)
Leadership position in 2W OEM segment and growing share in aftermarket
Promoters
45.4
segment: TVSSL is the largest 2W/3W tyre manufacturer with a leadership
position in the 2W OEM segment. It is currently the third largest player in the
MF / Banks / Indian Fls
9.7
aftermarket segment. Although motorcycle sales have declined in recent times
FII / NRIs / OCBs
0.9
owing to poor rural economy, scooter sales remain strong thus resulting in lower
Indian Public / Others
44.1
decline for overall 2W segment. TVSSL’s key clients who have a higher share in
the scooter segment, namely, Honda Motorcycle and Scooter India (HMSI) and
TVS Motor are faring better than completion, thus aiding growth for the company.
Abs.(%)
3m 1yr
3yr
Going forward, the outlook on the overall 2W industry remains positive and given
Sensex
(6.3)
(14.3)
25.3
the capacity addition by HMSI, we expect TVSSL to maintain its performance on
TVSSL
(7.7)
54.5
914.8
the top-line front. As for the aftermarket segment, the company is continuously
increasing its presence in the space which has enabled it in reporting a top-line
growth and in improving its profitability.
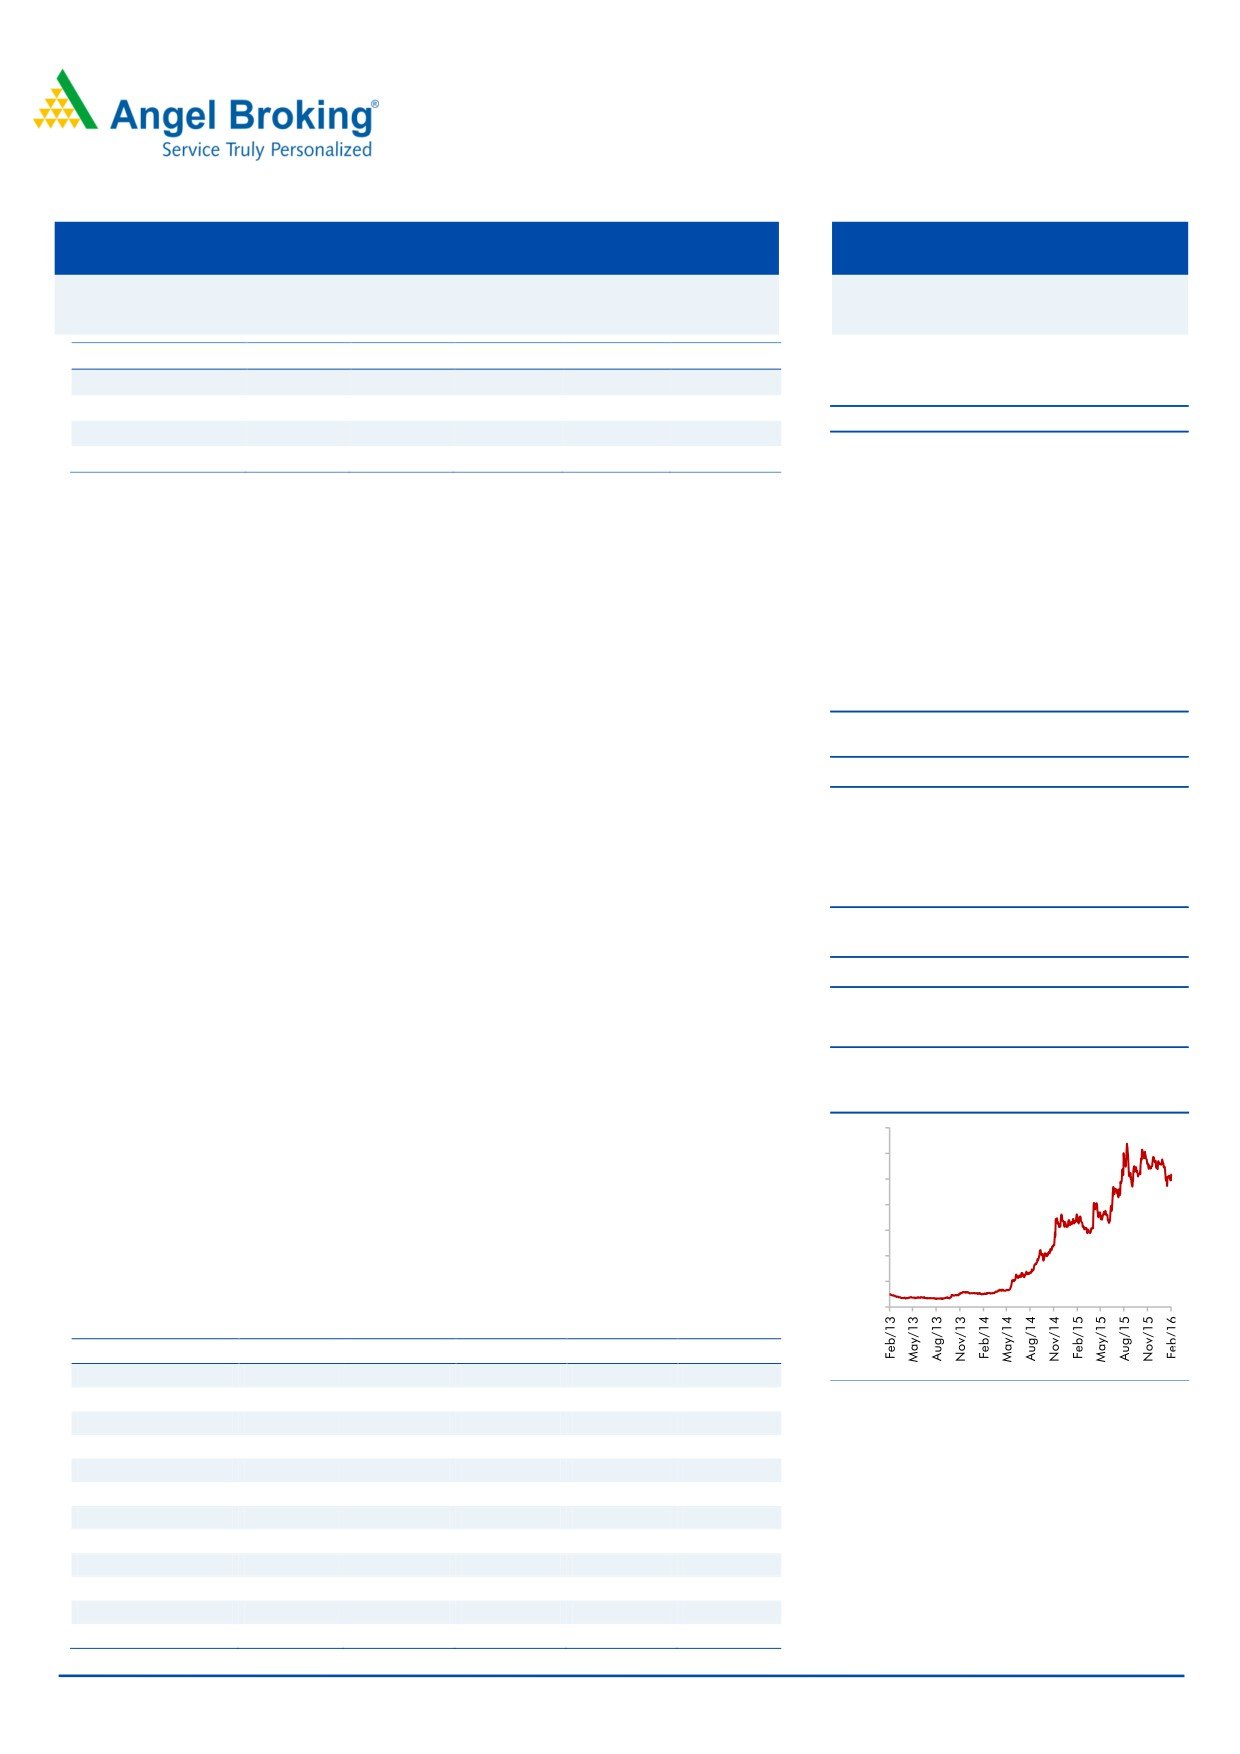
3 year price chart
Outlook and valuation: We expect TVSSL’s top-line to grow at a CAGR of 9.0%
3,500
over FY2015-17E to `2,252cr. We expect the operating margin to be at 15.3% in
3,000
FY2017E on the back of lower rubber prices and improvement in market share in
2,500
the aftermarket segment. Consequently, the net profit is expected to be at `205cr in
2,000
FY2017E. At the current market price, the stock is trading at a PE of 9.4x its FY2017E
1,500
earnings. We have a Buy rating on the stock with a revised target price of `3,217
1,000
based on a target PE of 12.0x its FY2017E earnings.
500
-
Key financials
Y/E March (` cr)
FY2013
FY2014
FY2015E
FY2016E
FY2017E
Net sales
1,476
1,671
1,896
2,035
2,252
% chg
5.1
13.2
13.5
7.3
10.7
Source: Company, Angel Research
Net profit
36
47
104
190
205
% chg
(10.3)
33.0
118.8
83.4
7.8
EBITDA margin (%)
5.7
7.2
11.5
15.9
15.3
EPS (`)
46.6
61.9
135.6
248.6
268.1
P/E (x)
54.3
40.8
18.7
10.2
9.4
P/BV (x)
11.3
9.5
7.0
4.4
3.2
RoE (%)
20.9
23.3
37.6
43.6
33.9
RoCE (%)
13.3
17.7
33.7
45.5
37.5
Milan Desai
EV/Sales (x)
1.4
1.3
1.1
1.0
0.8
39357800 ext: 6846
EV/EBITDA (x)
24.8
18.5
9.7
6.2
5.5
Source: Company, Angel Research
Please refer to important disclosures at the end of this report
1
TVS Srichakra | 3QFY2016 Result Update
Exhibit 1: 3QFY2016 performance
Y/E March (` cr)
3QFY2016
3QFY2015
% chg (yoy)
2QFY2016
% chg (qoq)
9MFY2016
9MFY2015
% chg
Net Sales
509
489
4.0
522
(2.6)
1,535
1,431
7.2
Net raw material
258
282
(8.5)
271
(5.0)
787
863
(8.7)
(% of Sales)
50.7
57.6
(689)
52.0
(126)
51.3
60.3
(896)
Staff Costs
48
43
11.4
46
4.1
145
122
19.2
(% of Sales)
9.4
8.8
63
8.8
60
9.4
8.5
95
Other Expenses
122
102
19.6
123
(0.8)
356
294
21.3
(% of Sales)
23.9
20.8
313
23.5
44
23.2
20.5
269
Total Expenditure
428
427
0.2
440
(2.9)
1,288
1,278
0.8
Operating Profit
81
63
29.3
82
(1.2)
246
153
60.5
OPM
15.9
12.8
313
15.7
22
16.0
10.7
533
Interest
3
7
(57.7)
4
(14.8)
12
26
(53.8)
Depreciation
10
7
35.9
10
(0.8)
30
21
43.9
Other Income
0
0
26.9
1
(73.2)
4
1
282.7
Exceptional Item
-
(12)
0
0
(12)
PBT
68
36
88.4
70
(1.9)
208
96
117.4
(% of Sales)
13.4
7.4
13.3
13.5
6.7
Tax
20
10
105.7
21
(3.7)
62
26
140.4
(% of PBT)
29.5
27.0
30.0
29.8
27.0
Reported PAT
48
26
81.9
49
(1.1)
146
70
109.0
Adjusted PAT
48
26
49
146
70
PATM
9.5
5.4
9.3
9.5
4.9
Equity capital (cr)
8
8
8
8
8
EPS (`)
62.8
34.5
81.9
63.5
(1.1)
190.3
91.1
109.0
Source: Company, Angel Research
Exhibit 2: Actual vs. Angel estimate (3QFY2016)
(` cr)
Actual (` cr)
Estimate (` cr)
% variation
Total Income
509
542
(6.2)
EBIDTA
81
83
(2.8)
EBIDTA margin
15.9
15.4
56
Adj. PAT
48
49
(1.6)
Source: Company, Angel Research
Top-line slightly below estimates, overall numbers in-line.
For 3QFY2016, TVS Srichakra (TVSSL) reported a good set of numbers. The top-
line grew by 4.0% yoy to `509cr, against our estimate of `542cr. Although the top-
line was below our estimate, TVSSL is performing well and reporting top-line
growth while other tyre makers are reporting top-line declines on a yoy basis. This
is because TVSSL does not have exposure to the TBR segment and is also helped
by its growing presence in the 2W aftermarket segment.
February 8, 2016
2
TVS Srichakra | 3QFY2016 Result Update
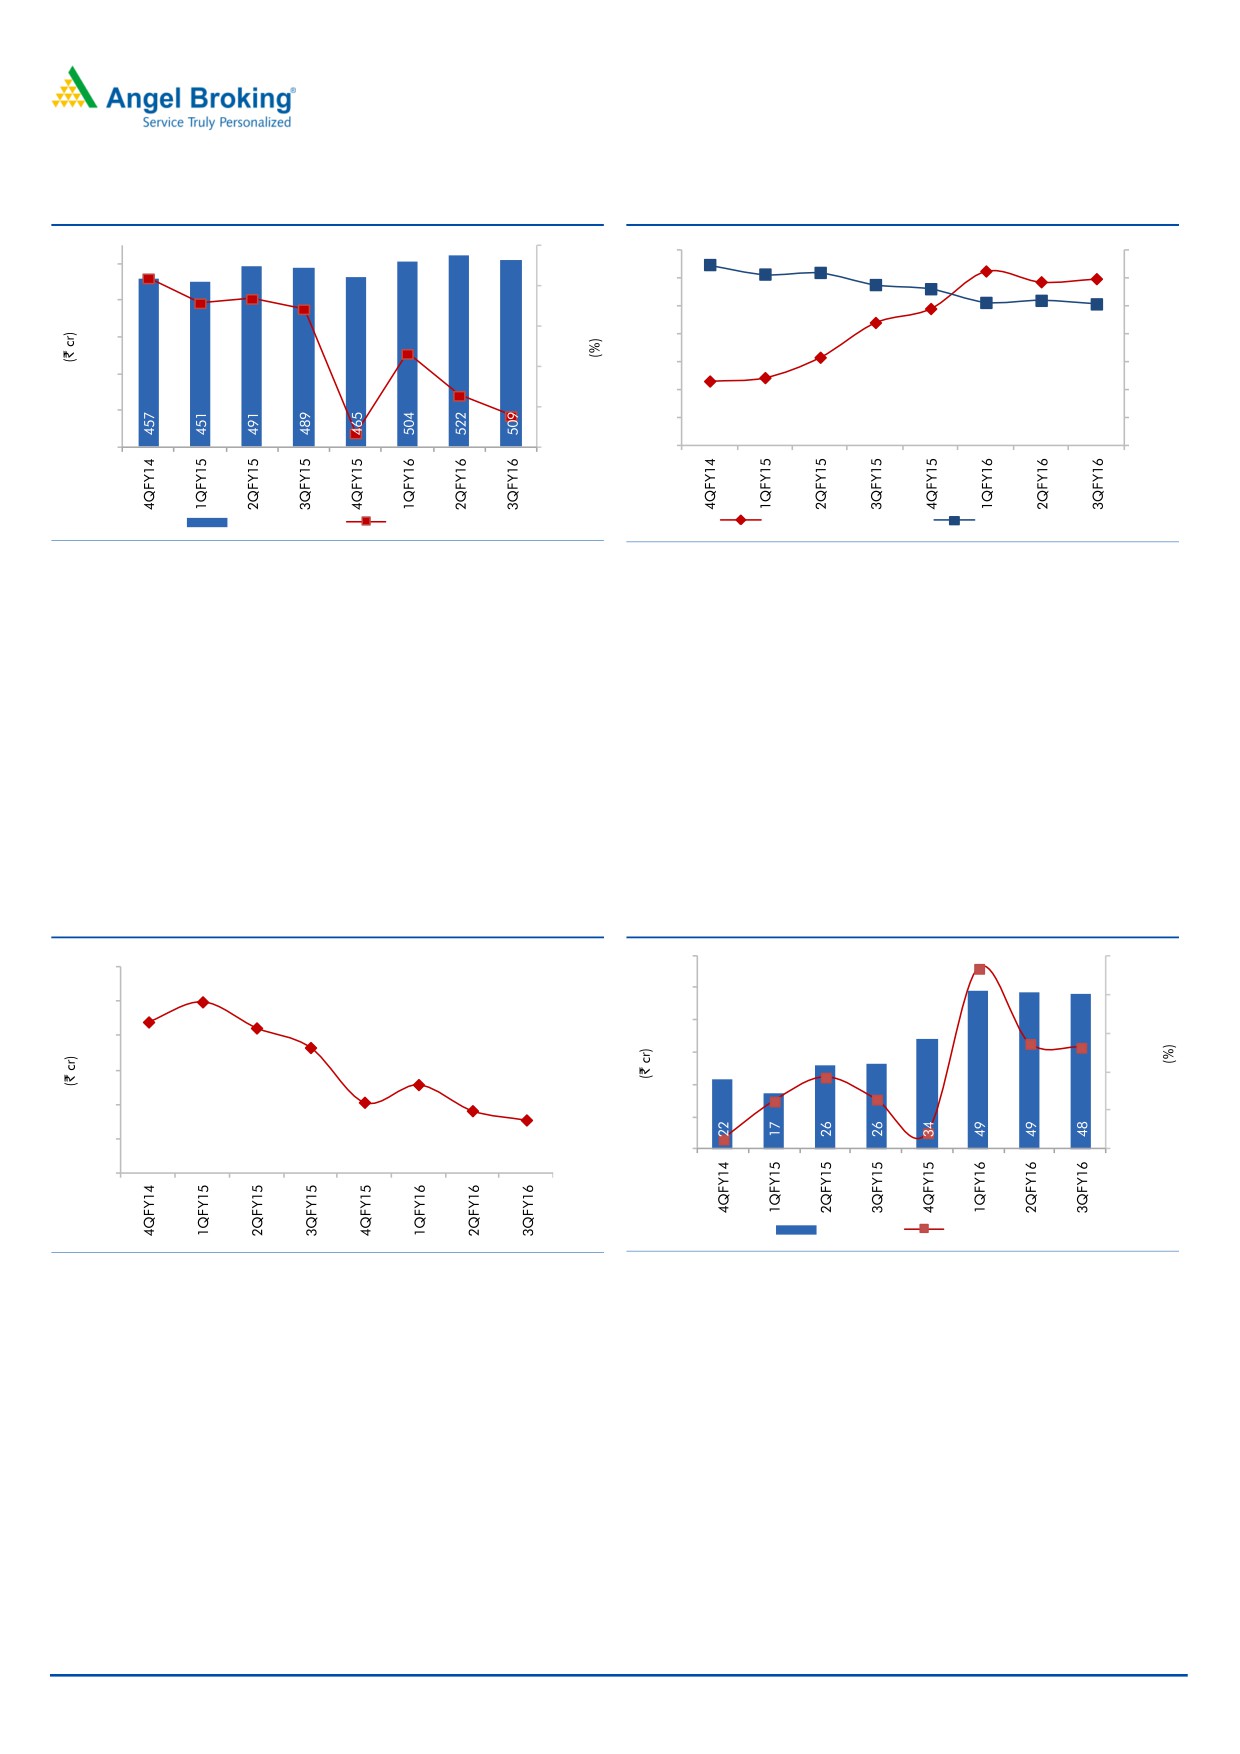
Exhibit 3: Top-line maintaining good growth
Exhibit 4: Lower RM cost led to margin expansion
25.0
18.0
64.7
61.4
16.5
70.0
61.9
500
21.0
15.7
15.9
57.6
56.1
16.0
60.0
18.5
20.0
17.9
400
17.2
14.0
50.0
15.0
13.8
51.2
52.0
300
12.0
50.7
40.0
11.7
12.8
10.0
10.0
30.0
200
10.3
6.5
8.0
20.0
8.6
100
5.0
4
.0
6.0
8.9
10.0
1.8
-
-
4.0
-
Revenue (LHS)
yoy growth (RHS)
EBITDA margin (LHS)
RM cost/sales (RHS)
Source: Company, Angel Research
Source: Company, Angel Research
As for operational performance, other expenses as a percentage of sales increased
during the quarter by 313bp yoy to 23.9% but raw material expense declined by
689bp yoy to 50.7% of sales. This resulted in the EBITDA margin expanding by
313bp yoy to 15.9% and EBITDA growing by 29.3% yoy to `81cr. The margin and
EBITDA were both in-line with our expectation of 15.4% and `83cr, respectively.
The company has reduced its debt in the current fiscal. Lower debt level (~`37cr
as on 1HFY2016 excluding current maturities) has resulted in interest expense
declining by 57.7% yoy to `3cr. Owing to better operational performance and
lower interest outgo the net profit nearly doubled to `48cr from `26cr in the same
quarter of the previous year (against our estimate of `49cr).
Exhibit 5: Declining interest cost
Exhibit 6: Improving Profitability
60
183.7
200.0
12
10.0
50
150.0
10
8.8
8.5
40
81
.9
7.3
8
100.0
86.9
30
43.6
5.2
6
50.0
4.1
12.6
15.1
3.6
20
3.1
4
(28.3)
-
10
2
-
(50.0)
-
PAT (LHS)
yoy growth (RHS)
Source: Company, Angel Research
Source: Company, Angel Research
February 8, 2016
3
TVS Srichakra | 3QFY2016 Result Update
Investment rationale
Higher share in Aftermarket segment to aid growth
The company’s better performance on both the top-line and the profitability front
can largely be attributed to its growing presence in the aftermarket segment. The
company over the past few years has concentrated on increasing its share which is
reflecting in its improved performance. The company ranks third in terms of
market share in the aftermarket segment.
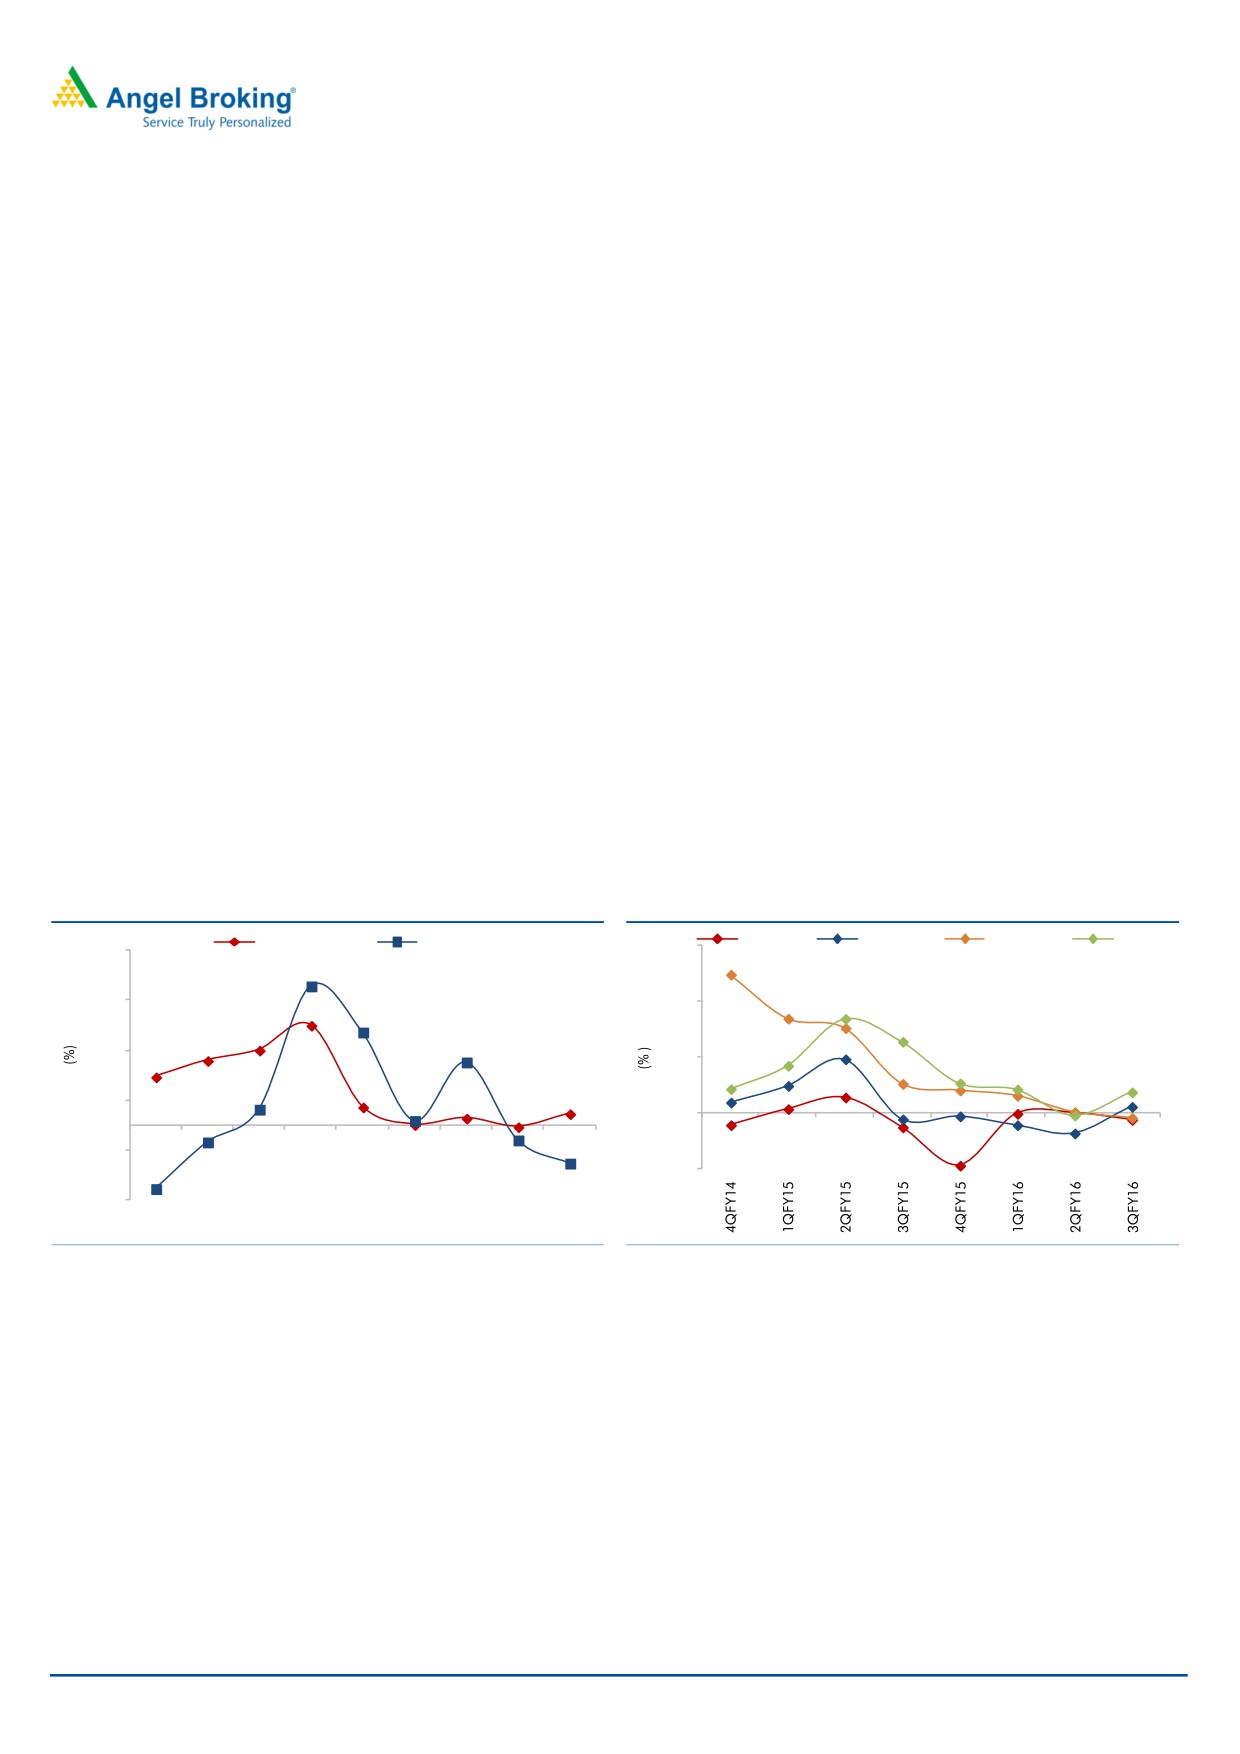
Leadership position in 2W OEM and better outlook on the
industry to aid growth
TVSSL is a market leader in the OEM segment with HMSI, Hero MotoCorp (HMCL),
TVS Motor, Bajaj Auto and India Yamaha Motor (Yamaha) featuring among its
major clients. After posting good growth rates in FY2015, the 2W industry has
retraced on account of poor rural sentiment (poor monsoon). While motorcycle
sales have been impacted the most on this account, the sales of scooters have
remained robust. Although HMSI, which is a key client, posted a yoy decline of
1.4%, its scooter sales have remained intact. The company has been facing
constraints as it is working at peak capacities which should normalize once its
scooter plant in Gujarat commences operation in the near future. However, its
group company TVS Motor has posted stellar numbers, reporting volume growth of
7.7% yoy for the past quarter.
Exhibit 7: 2W/3W growth (yoy)
Exhibit 8: 2W sales growth by manufacturer (yoy)
2-wheeler
3-wheeler
60.0
Bajaj
HMCL
HMSIL
TVS
35.0
27.9
25.0
40.0
18.7
15.0
20.0
15.0
12.6
20.0
12.9
5.0
9.6
0.9
(0.4)
2.3
0.0
3.2
3.6
(3.4)
0.1
1.4
(5.0)
(3.0)
(20.0)
(7.7)
(12.8)
(15.0)
3QFY14
1QFY15
3QFY15
1QFY16
3QFY16
Source: Company, Angel Research
Source: Company, Angel Research
Given its leadership position in the 2W OEM segment, and positive outlook on the
2W industry, we expect TVSSL to maintain its performance on the top-line front.
Moreover, TVSSL is only present in 2W/3W segment with negligible share in off the
road segment which has shielded the company from cheaper Chinese tyres.
February 8, 2016
4
TVS Srichakra | 3QFY2016 Result Update
Agreement with Michelin adds to revenue visibility
TVSSL has entered into an agreement with French tyre major Michelin to
manufacture 2W bias tyres designed by Michelin at its Madurai facility. As per the
agreement, TVSSL would contract manufacture 2W bias tyres under the Michelin
brand name and it will also be manufacturing some tyres from its own range of
2W tyres. TVSSL is in the process of continuously expanding its capacity to 2.3 lakh
tyres per month by FY2016E which will aid in carrying out the agreement.
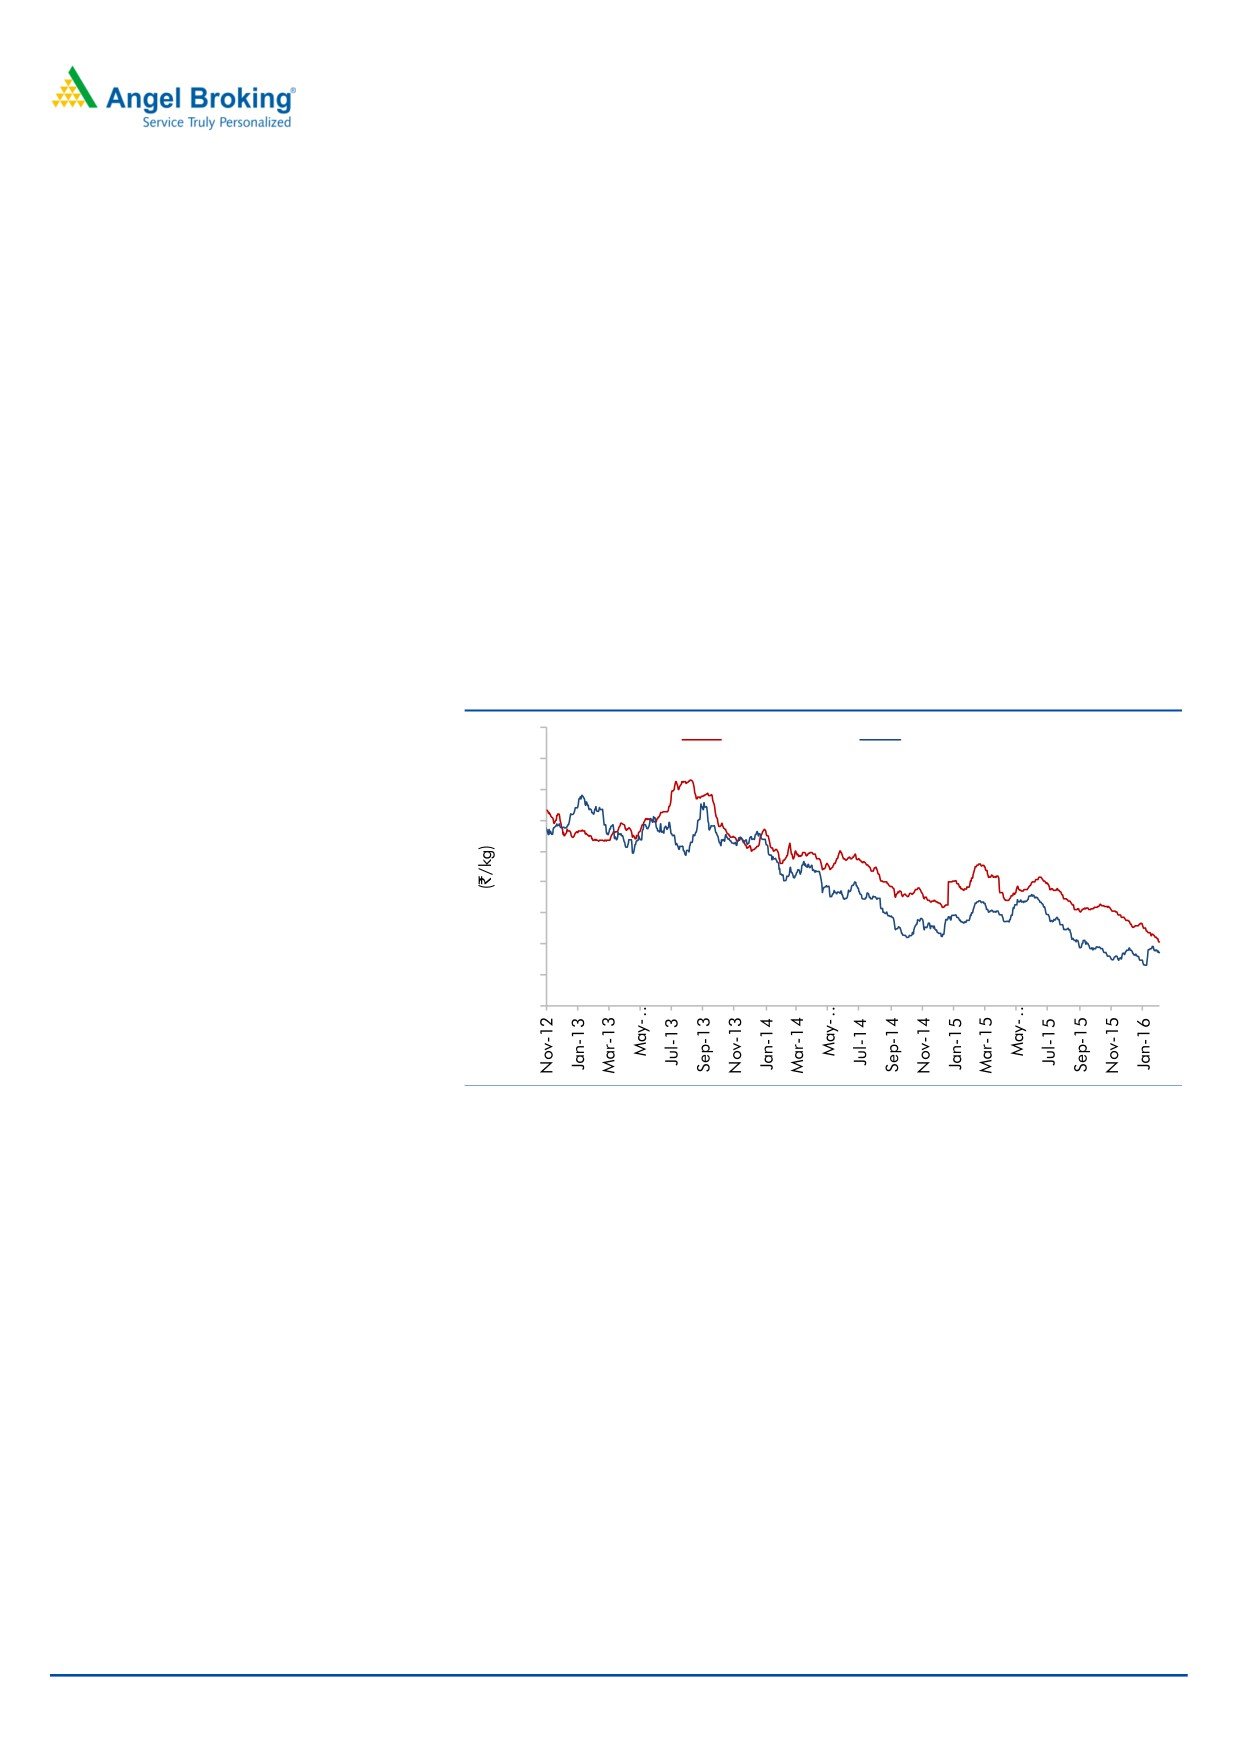
Stable rubber prices to help in sustaining margins
Natural Rubber (NR) continues to show weakness as domestic NR prices further
slipped by ~10.0% yoy and ~8.0% qoq to `109/kg in 3QFY2016. The global
prices during the period have declined by
~17.0% yoy and
~14.0% qoq
suggesting the higher global inventory is likely to keep prices at lower levels. With
lower raw material price environment prevailing, we expect TVSSL to maintain its
margin in the near future.
Exhibit 9: International vs. Domestic rubber price trend
230
Domestic Price
International Price
210
190
170
150
130
110
91
90
85
70
50
Source: Angel Research
February 8, 2016
5
TVS Srichakra | 3QFY2016 Result Update
Financial performance
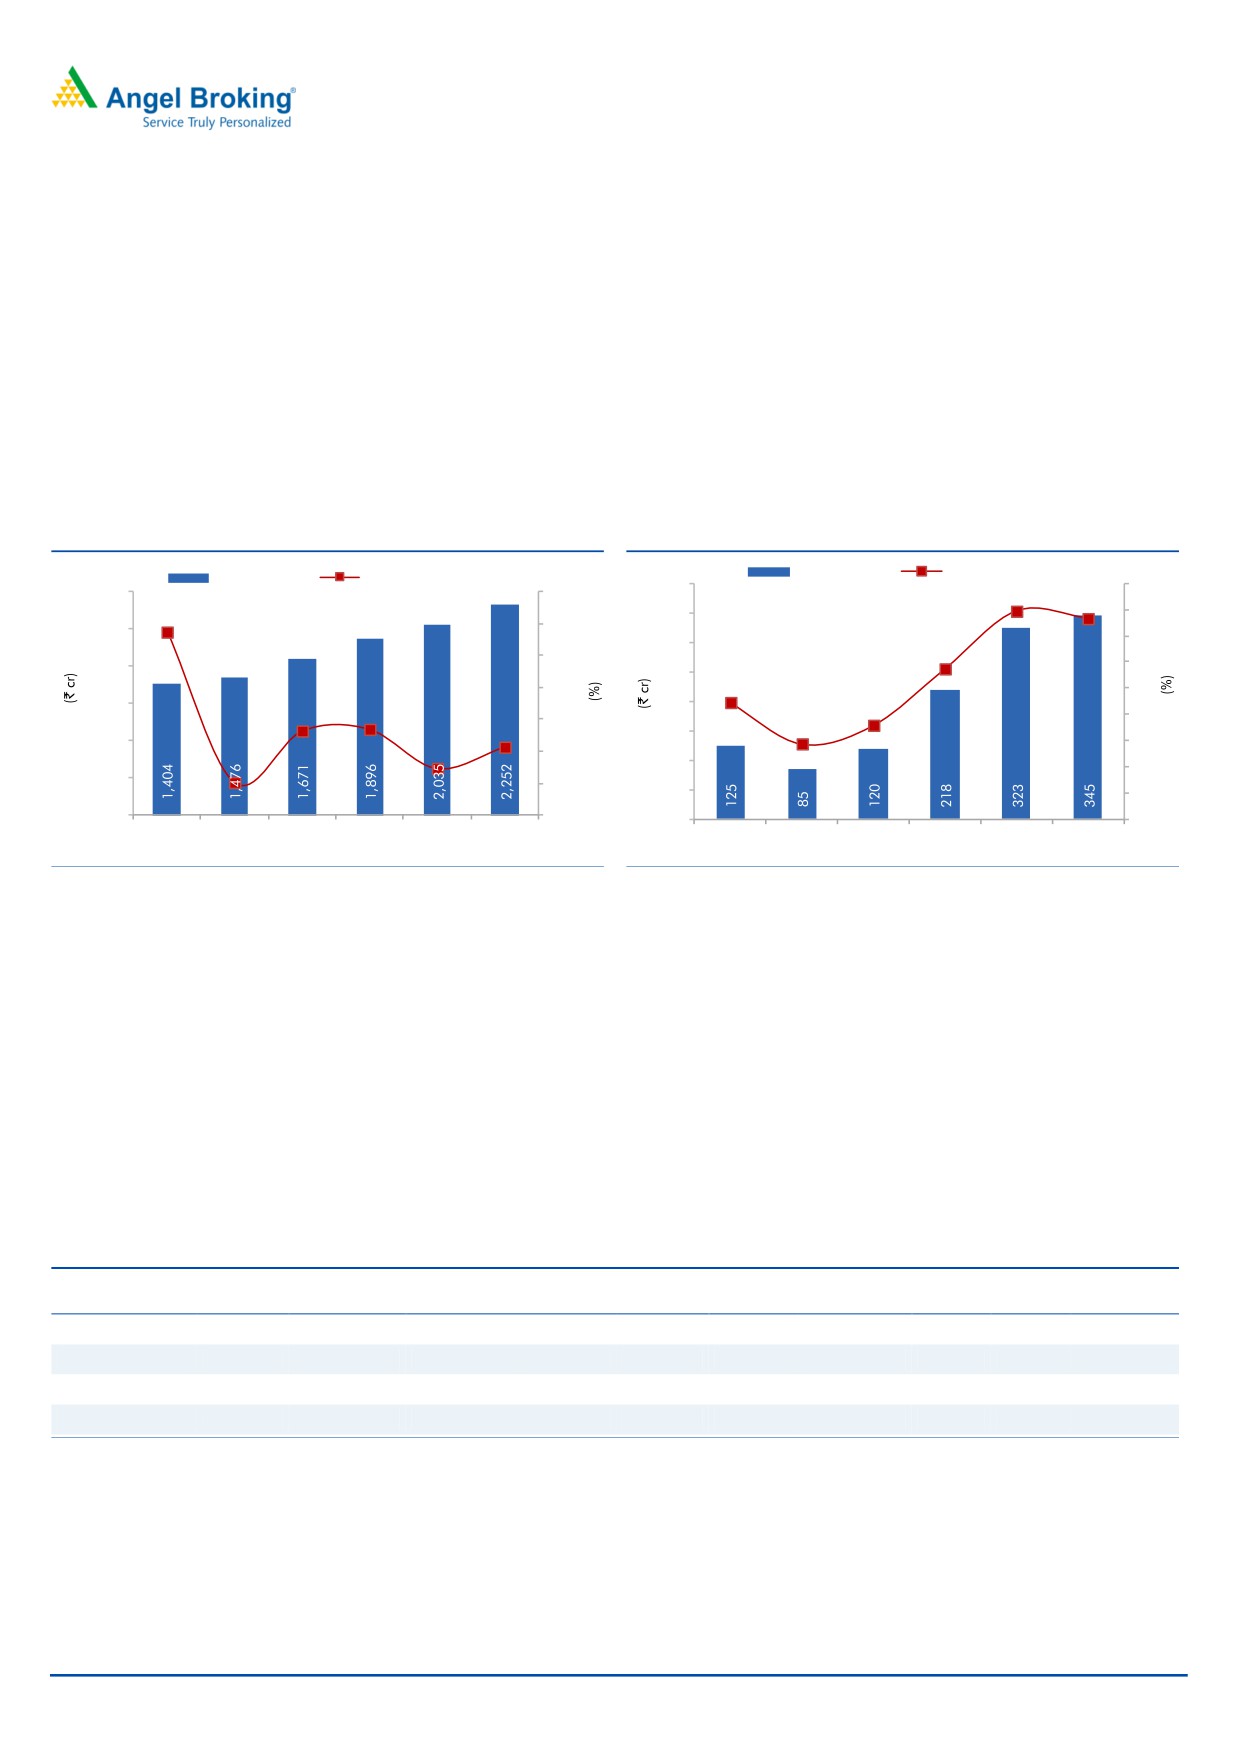
We expect its top-line to grow at a CAGR of 9.0% over FY2015-17E to `2,252cr.
The company is confident of smooth revenue flow backed by growth in its major
OEM consumer segment and is also focusing on increasing its market share in the
aftermarket segment. Raw material cost continues to be at lower levels helping the
company maintain its margins in 3QFY2016. We expect the lower raw material
cost environment to prevail amidst pressure on NR and SBR. We expect the
operating margin to be at
15.9% and
15.3% in FY2016E and FY2017E,
respectively.
Exhibit 10: Revenue to grow at 9.0% CAGR
Exhibit 11: EBITDA Margin to be at 15.3% in FY2017E
EBITDA (LHS)
EBITDA margin (RHS)
Revenue (LHS)
Revenue growth (RHS)
400
18
2,400
35.0
350
16
28.7
15.9
2,000
30.0
15.3
14
300
25.0
1,600
12
250
8.9
11.5
20.0
10
1,200
13.2
200
7.2
13.5
8
15.0
5.7
150
800
7.3
10.
7
6
10.0
100
4
400
5.1
5.0
50
2
0
0.0
0
0
FY2012
FY2013
FY2014
FY2015
FY2016E FY2017E
FY2012
FY2013
FY2014
FY2015
FY2016E FY2017E
Source: Company, Angel Research
Source: Company, Angel Research
Owing to lower interest expense and better operational performance, we expect
the company to report a profit of `205cr in FY2017E.
Outlook and valuation
We expect the top-line of the company to grow at a CAGR of 9.0% over
FY2015-17E to `2,252cr. We expect the operating margin to be at 15.3% in
FY2017E owing to lower rubber prices and improvement in market share in the
aftermarket segment. Consequently, the net profit is expected to be at `205cr in
FY2017E. At the current market price, the stock is trading at a PE of 9.4x its
FY2017E earnings. We have a Buy rating on the stock with a revised target price of
`3,217 based on a target PE of 12.0x for FY2017E earnings.
Exhibit 11: Relative valuation
Mcap
Sales
OPM
PAT
EPS
ROE
P/E
P/BV
EV/
Company
Year
(` cr)
(` cr)
(%)
(` cr)
(`)
(%)
(x)
(x)
Sales (x)
TVSSL
FY2017E
1,936
2,252
15.3
205
268.1
39.4
9.4
3.2
0.8
CEAT
FY2017E
3,699
6,597
13.7
453
111.9
18.5
8.2
1.5
0.6
Apollo tyres
FY2017E
6,986
12,689
16.0
968
19.0
13.0
7.2
0.9
0.7
MRF
FY2017E
14,499
14,488
21.1
1,611
3,797.9
21.2
9.0
1.7
0.9
Source: Company, Angel Research, Bloomberg
February 8, 2016
6
TVS Srichakra | 3QFY2016 Result Update
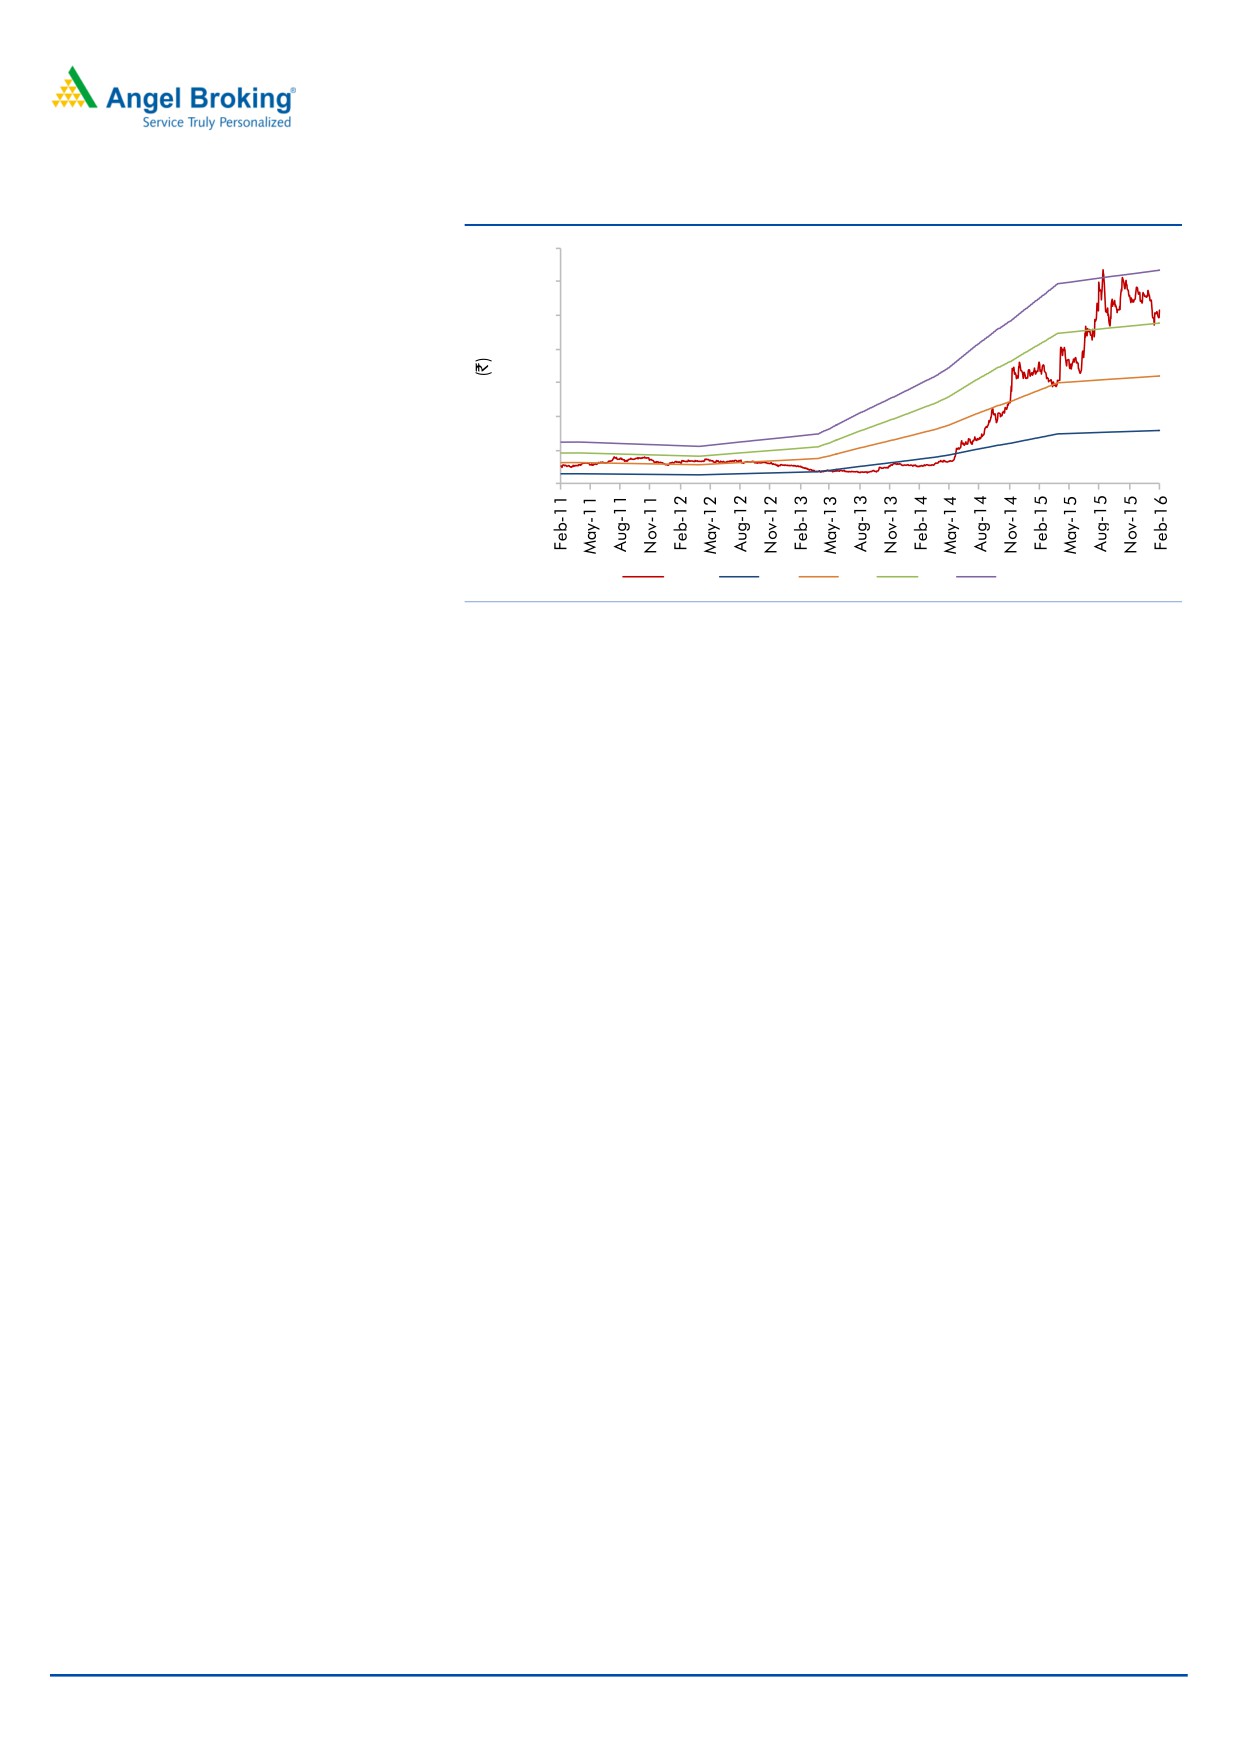
Exhibit 12: One-year forward PE band
3,500
3,000
2,500
2,000
1,500
1,000
500
-
Price
3x
6x
9x
12x
Source: Company, Angel Research
Key downside risks to our recommendation: Any rise in rubber prices, increase in
inflation, increasing competition, slowdown in 2W and 3W industry and lower-
than-expected demand in the replacement market, will have an adverse impact on
the company’s performance. The import duty on NR has been increased from 20%
or `30/kg to 25% or `30/kg. Further upward revision in the duty will have an
adverse impact on TVSSL’s profitability.
The Company
TVSSL is a part of the TVS Group. The company is a leading manufacturer of
two-wheeler and three-wheeler tyres. The company manufactures a complete
range of two-wheeler and three-wheeler tyres for the domestic market. For the
export market, the company manufactures industrial pneumatic tyres, farm and
implements tyres, skid steer tyres, multipurpose tyres and floatation tyres, among
others. TVSSL’s manufacturing units are located at Madurai, Tamil Nadu and
Pantnagar, Uttarakhand rolling out ~250 lakh tyres per year. With a network of
over 2,400 dealers and 34 depots across the country, the company is a major
supplier to TVS Motors, Hero MotoCorp, HMSI, Bajaj Auto, LML, Piaggio, Atul Auto
Ltd., Mahindra 2Wheelers and India Yamaha Motor. The company also exports to
the US, Europe, South America, Africa and Australia.
February 8, 2016
7
TVS Srichakra | 3QFY2016 Result Update
Standalone Profit & Loss Statement
Y/E March (` cr)
FY2013
FY2014
FY2015
FY2016E
FY2017E
Total operating income
1,476
1,671
1,896
2,035
2,252
% chg
5.1
13.2
13.5
7.3
10.7
Net Raw Materials
1,011
1,104
1,123
1,043
1,171
% chg
7.1
9.2
1.7
(7.2)
12.3
Other Mfg costs
106
124
146
180
198
% chg
5.1
16.4
18.1
23.0
10.0
Personnel
113
125
164
194
213
% chg
17.4
10.5
31.5
18.0
10.0
Other
161
198
245
296
326
% chg
17.0
23.3
23.3
21.0
10.0
Total Expenditure
1,391
1,551
1,678
1,712
1907
EBITDA
85
120
218
323
345
% chg
(32.1)
41.1
81.7
48.5
6.7
(% of Net Sales)
5.7
7.2
11.5
15.9
15.3
Depreciation& Amortisation
24
24
40
41
49
EBIT
61
96
178
282
296
% chg
(41.8)
58.5
85.0
58.8
4.9
(% of Net Sales)
4.1
5.8
9.4
14.0
13.3
Interest & other Charges
57
42
30
16
11
Other Income
44
1
4
6
9
(% of Net Sales)
3.0
0.1
0.1
0.2
0.2
Recurring PBT
3
55
148
266
285
% chg
(92.9)
1477.9
171.2
79.8
7.1
Exceptional Item
-
-
(12)
-
-
PBT (reported)
47
56
140
272
293
Tax
12
8
36
82
88
(% of PBT)
24.5
15.2
25.6
30.0
30.0
PAT (reported)
36
47
104
190
205
Extraordinary Expense/(Inc.)
-
-
-
-
-
ADJ. PAT
36
47
104
190
205
% chg
(10.3)
33.0
118.8
83.4
7.8
(% of Net Sales)
2.4
2.9
5.5
9.4
9.2
Basic EPS (`)
46.6
61.9
135.6
248.6
268.1
Fully Diluted EPS (`)
46.6
61.9
135.6
248.6
268.1
% chg
(10.3)
33.0
118.8
83.4
7.8
Dividend
6
12
26
26
31
Retained Earning
30
35
73
160
169
February 8, 2016
8
TVS Srichakra | 3QFY2016 Result Update
Standalone Balance Sheet
Y/E March (` cr)
FY2013
FY2014
FY2015
FY2016E
FY2017E
SOURCES OF FUNDS
Equity Share Capital
8
8
8
8
8
Reserves& Surplus
163
196
269
429
598
Shareholders’ Funds
171
204
276
436
606
Total Loans
233
304
205
123
123
Other Long Term Liabilities
29
10
15
30
30
Long Term Provisions
2
3
8
8
8
Deferred Tax Liability
23
22
23
23
23
Total Liabilities
458
541
527
620
789
APPLICATION OF FUNDS
Gross Block
303
370
446
531
611
Less: Acc. Depreciation
117
141
179
220
269
Net Block
185
229
267
311
342
Capital Work-in-Progress
31
20
18
20
20
Goodwill
-
-
-
-
-
Investments
19
19
32
32
32
Long Term Loans and advances
50
53
65
65
65
Other Non-current asset
8
12
7
7
7
Current Assets
525
505
411
494
668
Cash
45
8
9
20
144
Loans & Advances
40
24
25
27
29
Inventory
253
207
210
215
237
Debtors
186
266
167
233
257
Other current assets
-
-
-
-
-
Current liabilities
362
297
274
310
345
Net Current Assets
164
207
137
184
323
Misc. Exp. not written off
-
-
-
-
-
Total Assets
458
541
527
620
789
February 8, 2016
9
TVS Srichakra | 3QFY2016 Result Update
Standalone Cash Flow Statement
Y/E March (` cr)
FY2013
FY2014
FY2015
FY2016E
FY2017E
Profit before tax
47
56
140
272
293
Depreciation
24
24
40
41
49
Change in Working Capital
129
(81)
72
(36)
(15)
Less: Direct taxes paid
(12)
(8)
(37)
(82)
(88)
Others
4
25
27
(6)
(9)
Cash Flow from Operations
192
15
242
189
231
(Inc.)/Dec. in Fixed Assets
(19)
(57)
(74)
(86)
(80)
(Inc.)/Dec. in Investments
1
0
(13)
-
-
Interest received
(21)
(7)
(7)
-
-
Others
81
(7)
(1)
6
9
Cash Flow from Investing
42
(70)
(95)
(80)
(71)
Issue of Equity
-
0
-
-
-
Inc./(Dec.) in loans
(106)
71
(88)
(67)
-
Dividend Paid (Incl. Tax)
(7)
(14)
(31)
(30)
(36)
Others
(82)
(38)
(26)
-
-
Cash Flow from Financing
(195)
19
(145)
(98)
(36)
Inc./(Dec.) in Cash
39
(37)
1
11
124
Opening Cash balances
6
45
8
9
20
Closing Cash balances
45
8
9
20
144
February 8, 2016
10
TVS Srichakra | 3QFY2016 Result Update
Standalone Key Ratios
Y/E March
FY2013
FY2014
FY2015E
FY2016E
FY2017E
Valuation Ratio (x)
P/E (on FDEPS)
54.3
40.8
18.7
10.2
9.4
P/CEPS
32.3
27.2
13.5
8.4
7.6
P/BV
11.3
9.5
7.0
4.4
3.2
Dividend yield (%)
0.3
0.6
1.3
1.3
1.6
EV/Net sales
1.4
1.3
1.1
1.0
0.8
EV/EBITDA
24.8
18.5
9.7
6.2
5.5
EV / Total Assets
4.6
4.1
4.0
3.2
2.4
Per Share Data (`)
EPS (Basic)
46.6
61.9
135.6
248.6
268.1
EPS (fully diluted)
46.6
61.9
135.6
248.6
268.1
Cash EPS
78.2
92.9
187.6
302.0
331.9
DPS
7.5
16.0
33.8
33.8
40.0
Book Value
223.2
266.0
360.8
569.9
791.2
DuPont Analysis
EBIT margin
4.1
5.8
9.4
14.0
13.3
Tax retention ratio
0.8
0.8
0.7
0.7
0.7
Asset turnover (x)
4.1
3.4
4.0
3.7
3.8
ROIC (Post-tax)
12.6
16.5
28.3
36.1
34.9
Cost of Debt (Post Tax)
18.5
11.6
10.8
9.3
6.5
Leverage (x)
1.6
1.2
1.0
0.4
0.0
Operating ROE
3.2
22.2
45.3
46.2
36.0
Returns (%)
ROCE (Pre-tax)
13.3
17.7
33.7
45.5
37.5
Angel ROIC (Pre-tax)
16.7
19.5
38.1
51.6
49.9
ROE
20.9
23.3
37.6
43.6
33.9
Turnover ratios (x)
Asset TO (Gross Block)
4.9
4.9
4.6
4.1
3.9
Inventory / Net sales (days)
69
51
40
38
37
Receivables (days)
47
50
42
42
42
Payables (days)
85
77
62
66
66
WC cycle (ex-cash) (days)
29
44
25
29
29
Solvency ratios (x)
Net debt to equity
1.1
1.5
0.7
0.2
0.0
Net debt to EBITDA
2.0
2.3
0.8
0.2
(0.2)
Int. Coverage (EBIT/ Int.)
1.1
2.3
5.9
17.2
26.0
February 8, 2016
11
TVS Srichakra | 3QFY2016 Result Update
Research Team Tel: 022 - 39357800
DISCLAIMER
Angel Broking Private Limited (hereinafter referred to as “Angel”) is a registered Member of National Stock Exchange of India Limited,
Bombay Stock Exchange Limited and Metropolitan Stock Exchange of India Limited. It is also registered as a Depository Participant with
CDSL and Portfolio Manager with SEBI. It also has registration with AMFI as a Mutual Fund Distributor. Angel Broking Private Limited is
a registered entity with SEBI for Research Analyst in terms of SEBI (Research Analyst) Regulations, 2014 vide registration number
INH000000164. Angel or its associates has not been debarred/ suspended by SEBI or any other regulatory authority for accessing
/dealing in securities Market. Angel or its associates including its relatives/analyst do not hold any financial interest/beneficial
ownership of more than 1% in the company covered by Analyst. Angel or its associates/analyst has not received any compensation /
managed or co-managed public offering of securities of the company covered by Analyst during the past twelve months. Angel/analyst
has not served as an officer, director or employee of company covered by Analyst and has not been engaged in market making activity
of the company covered by Analyst.
This document is solely for the personal information of the recipient, and must not be singularly used as the basis of any investment
decision. Nothing in this document should be construed as investment or financial advice. Each recipient of this document should
make such investigations as they deem necessary to arrive at an independent evaluation of an investment in the securities of the
companies referred to in this document (including the merits and risks involved), and should consult their own advisors to determine
the merits and risks of such an investment.
Reports based on technical and derivative analysis center on studying charts of a stock's price movement, outstanding positions and
trading volume, as opposed to focusing on a company's fundamentals and, as such, may not match with a report on a company's
fundamentals.
The information in this document has been printed on the basis of publicly available information, internal data and other reliable
sources believed to be true, but we do not represent that it is accurate or complete and it should not be relied on as such, as this
document is for general guidance only. Angel Broking Pvt. Limited or any of its affiliates/ group companies shall not be in any way
responsible for any loss or damage that may arise to any person from any inadvertent error in the information contained in this report.
Angel Broking Pvt. Limited has not independently verified all the information contained within this document. Accordingly, we cannot
testify, nor make any representation or warranty, express or implied, to the accuracy, contents or data contained within this document.
While Angel Broking Pvt. Limited endeavors to update on a reasonable basis the information discussed in this material, there may be
regulatory, compliance, or other reasons that prevent us from doing so.
This document is being supplied to you solely for your information, and its contents, information or data may not be reproduced,
redistributed or passed on, directly or indirectly.
Neither Angel Broking Pvt. Limited, nor its directors, employees or affiliates shall be liable for any loss or damage that may arise from
or in connection with the use of this information.
Note: Please refer to the important ‘Stock Holding Disclosure' report on the Angel website (Research Section). Also, please refer to the
latest update on respective stocks for the disclosure status in respect of those stocks. Angel Broking Pvt. Limited and its affiliates may
have investment positions in the stocks recommended in this report.
Disclosure of Interest Statement
TVS Srichakra
1. Analyst ownership of the stock
No
2. Angel and its Group companies ownership of the stock
No
3. Angel and its Group companies' Directors ownership of the stock
No
4. Broking relationship with company covered
No
Note: We have not considered any Exposure below ` 1 lakh for Angel, its Group companies and Directors
Ratings (Based on expected returns
Buy (> 15%)
Accumulate (5% to 15%)
Neutral (-5 to 5%)
over 12 months investment period):
Reduce (-5% to -15%)
Sell (< -15)
February 8, 2016
12