4QFY2016 Result Update | IT
April 27, 2016
Tata Consultancy Services (TCS)
BUY
CMP
`2,488
Performance highlights
Target Price
`3,004
(` cr)
4QFY16 3QFY16
% chg (qoq) 4QFY15
% chg (yoy)
Investment Period
12 Months
Net revenue
28,449
27,364
4.0
24,220
17.5
Adj. EBITDA
7,065
7,747
(8.8)
6,588
7.2
Stock Info
Adj. EBITDA margin (%)
27.7
28.3
(50)bp
27.2
(50)bp
Sector
IT
Adj. PAT
6,341
6,110
3.8
3,858
7.4
Market Cap (` cr)
490,242
Source: Company, Angel Research
Net Debt (` cr)
(14,442)
For 4QFY2016, TCS posted revenue of US$4,207mn (V/s US$4,215mn
Beta
0.6
expected), up 1.5% qoq. The growth was mostly volume led, which grew by 3.2%
52 Week High / Low
2,769/2,119
qoq. In constant currency (CC) terms, the company posted a qoq revenue growth
Avg. Daily Volume
75,650
of 2.1%. In rupee terms, revenues grew by 4.0% qoq to `28,449cr (V/s
Face Value (`)
1
`28,454cr expected), led by rupee depreciation. The EBIT margin for the quarter
BSE Sensex
26,007
came in at 26.1% V/s 26.7% expected. PAT came in at `6,341cr (V/s `6,201cr
Nifty
7,963
expected), up 3.8% qoq. The company expects a stronger FY2017 for which it
Reuters Code
TCS.BO
has guided at an EBIT margin of 26-28%. We maintain our Buy on the stock with
Bloomberg Code
TCS@IN
a target price of `3,004.
Quarterly highlights: For 4QFY2016, the company posted revenue of
Shareholding Pattern (%)
US$4,207mn (V/s US$4,215mn expected), up 1.5% qoq. The growth was mostly
Promoters
73.4
volume led, which grew by 3.2% qoq. In constant currency (CC) terms, the
MF / Banks / Indian Fls
5.5
company posted a qoq revenue growth of 2.1%. In terms of geography, the
FII / NRIs / OCBs
16.8
company posted a CC growth of 2.4% in USA, 1.8% in Latin America, 3.6% in
Indian Public / Others
4.3
continental Europe, 2.2% in India, 1.1% in Asia Pacific and 9.5% in MEA while UK
posted a dip of 0.4%. . The EBIT margin for the quarter came in at 26.1% V/s
26.7% expected. PAT came in at `6,341cr (V/s `6,201cr expected), up 3.8% qoq.
Abs.(%)
3m 1yr
3yr
Sensex
6.2
(5.2)
34.8
Outlook and valuation: TCS highlighted that it had not received any negative
TCS
7.9
(0.4)
81.8
indications on IT budgets/spending trends and expects FY2017 to be better than
FY2016. Over FY2016-18E, we expect TCS to post a revenue CAGR of 13.0% in
3-Year Daily Price Chart
USD as well as INR terms.
Key financials (Consolidated, IFRS)
Y/E March (` cr)
FY2015
FY2016
FY2017E
FY2018E
Net sales
94,648
1,08,646
1,22,770
1,38,730
% chg
15.7
14.8
13.0
13.0
Net profit
21,696
24,215
27,598
30,941
% chg
13.5
11.6
14.0
12.1
EBITDA margin (%)
28.2
28.3
28.3
28.3
EPS (`)
110.9
123.7
141.0
158.1
Source: Company, Angel Research
P/E (x)
22.4
20.1
17.6
15.7
P/BV (x)
8.5
6.7
6.1
5.6
RoE (%)
34.2
33.1
34.6
35.5
RoCE (%)
33.9
31.6
28.1
28.8
Sarabjit kour Nangra
EV/Sales (x)
4.9
4.3
3.6
3.1
+91 22 3935 7800 Ext: 6806
EV/EBITDA (x)
17.4
15.1
12.7
11.0
sarabjit @angelbroking.com
Source: Company, Angel Research; Note: CMP as of April 26, 2016
Please refer to important disclosures at the end of this report
1
TCS | 4QFY2016 Result Update
Exhibit 1: 4QFY2016 performance (Consolidated, IFRS)
(` cr)
4QFY16
3QFY16
% chg (qoq)
4QFY15
% chg (yoy)
FY2016
FY2015
% chg(yoy)
Net revenue
28,449
27,364
4.0
24,220
17.5
1,08,646
94,648
14.8
Cost of revenue
15,592
14,883
4.8
15,176
2.7
59,459
53,227
11.7
Gross profit
12,857
12,481
3.0
9,044
42.2
49,187
41,421
18.7
SG&A expense
4,975
4,734
5.1
4,757
4.6
18,956
17,353
9.2
EBITDA
7,883
7,747
1.8
4,287
83.9
30,231
24,068
25.6
Dep. and amortisation
471
471
-
324
45.3
1,441
1,272
13.3
EBIT
7,412
7,276
1.9
3,963
87.0
28,790
22,796
26.3
Other income
905
699
29.5
1,129
(19.8)
3,050
3,140
PBT
8,317
7,975
4.3
5,092
63.3
31,840
25,936
22.8
Income tax
1,970
1,850
1,202
63.9
7,503
6,083
23.3
PAT
6,347
6,125
3.6
3,890
63.2
24,338
19,853
22.6
Earnings in affiliates
-
-
-
-
-
-
-
-
Minority interest
6
16
(64.3)
32
(82.5)
123
205
(40.1)
Reported PAT
6,341
6,110
3.8
3,858
64.4
24,215
19,648
23.2
Adj. PAT
6,341
6,110
3.8
5,906
7.4
24,215
21,696
11.6
EPS
32.2
31.0
3.8
30.2
6.6
123.7
110.9
11.5
Gross margin (%)
45.2
45.6
(42)bp
37.3
785bp
45.3
43.8
151bp
EBITDA margin (%)
27.7
28.3
(60)bp
17.7
1001bp
27.8
25.4
240bp
EBIT margin (%)
26.1
26.6
(54)bp
16.4
969bp
26.5
24.1
241bp
Source: Company, Angel Research
Exhibit 2: Actual vs Angel estimates
(` cr)
Actual
Estimate
Var. (%)
Net revenue
28,449
28,454
(0.0)
EBIT margin (%)
26.1
26.7
(64)bps
Adj. PAT
6,341
6,201
2.3
Source: Company, Angel Research
Numbers in line with expectations
For 4QFY2016, TCS posted revenue of US$4,207mn (V/s US$4,215mn expected),
up 1.5% qoq. The growth was mostly volume led, which grew by 3.2% qoq. In
constant currency (CC) terms, the company posted a qoq revenue growth of 2.1%.
In rupee terms, revenues grew by 4.0% qoq to `28,449cr (V/s `28,454cr
expected), led by rupee depreciation.
In terms of geography, the company posted a CC growth of 2.4% in USA, 1.8% in
Latin America, 3.6% in continental Europe, 2.2% in India, 1.1% in Asia Pacific and
9.5% in MEA while UK posted a dip of 0.4%. .
In terms of verticals, the company posted a CC growth of 3.2% in BSFI, Retail &
Distribution grew by 2.1%, Manufacturing grew by 3.9%, Telecom grew by 1.3%,
and Energy & Utilities grew by 3.0%.
April 27, 2016
2
TCS | 4QFY2016 Result Update
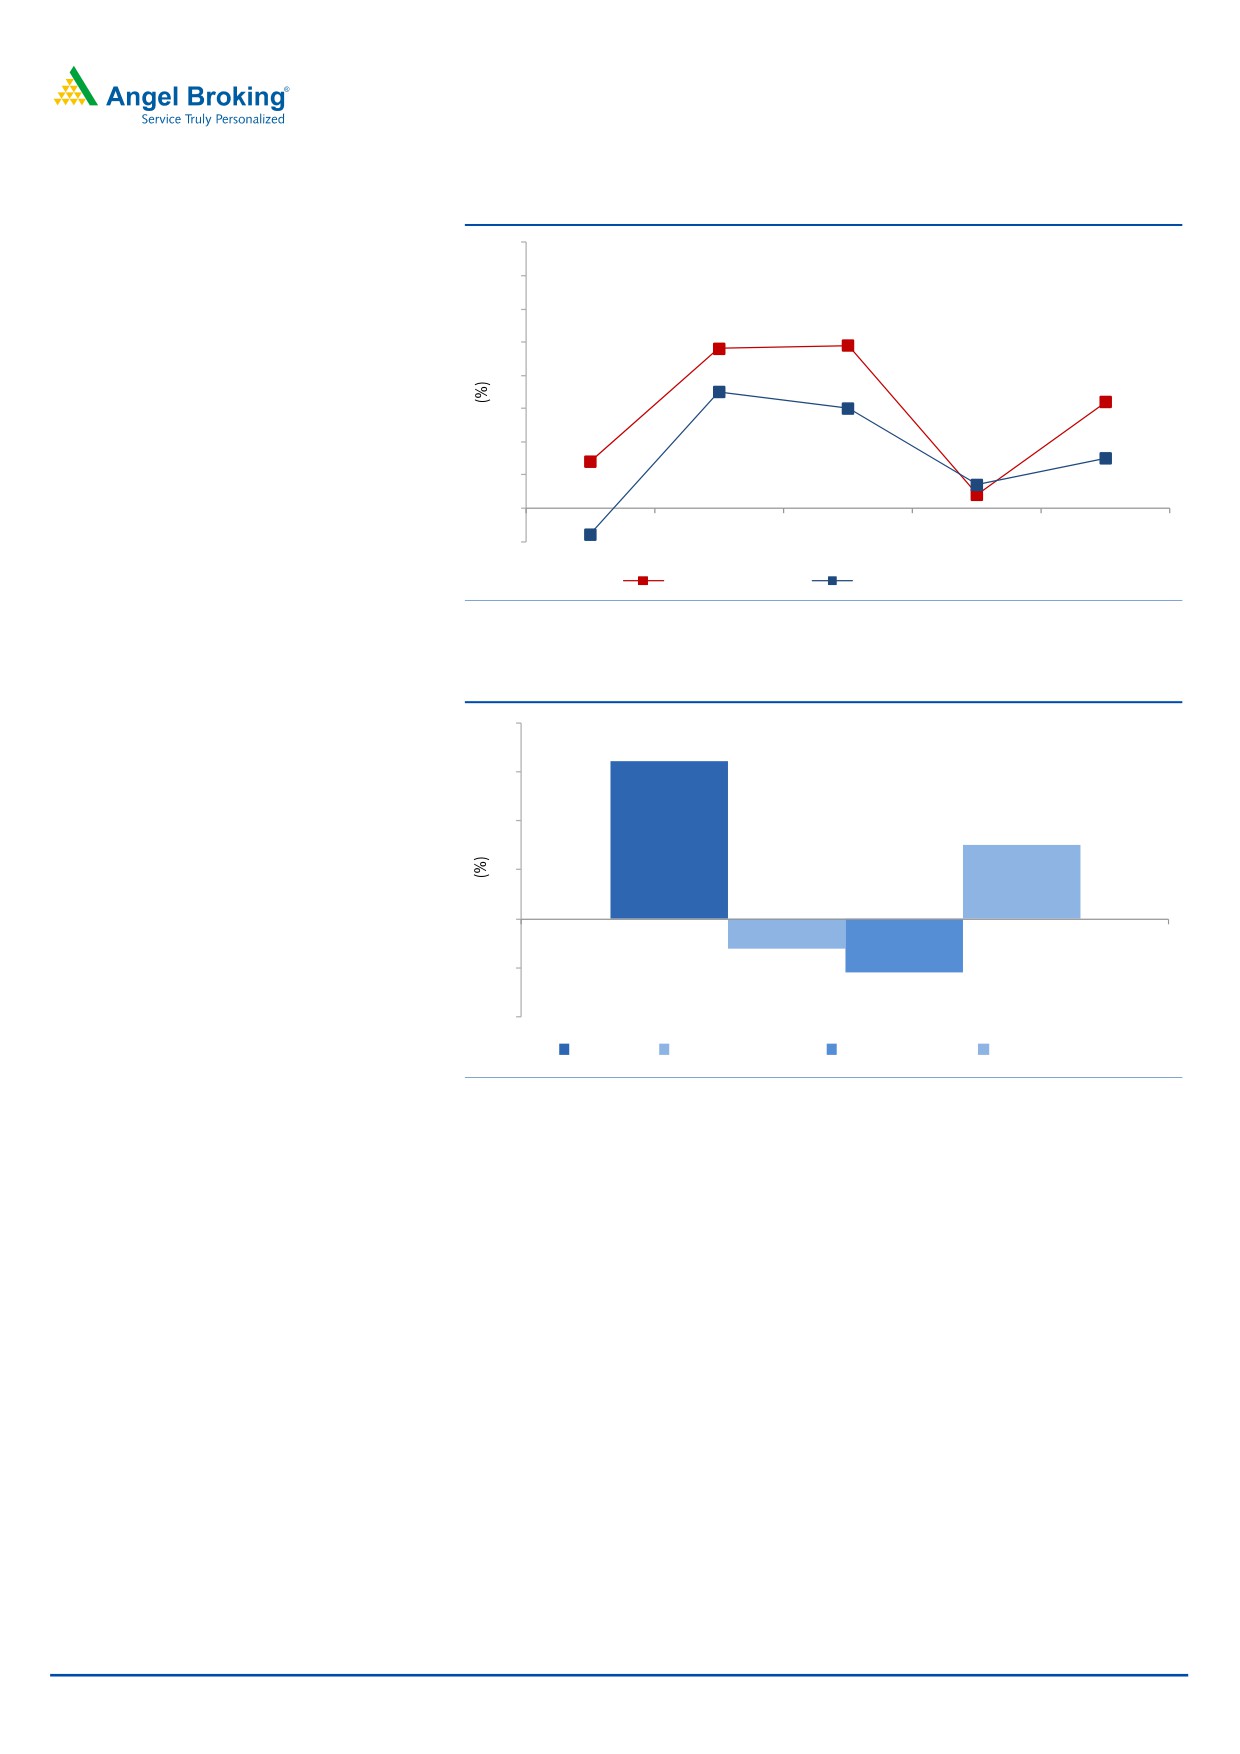
Exhibit 3: Trend in volume and revenue growth (qoq)
8
7
6
4.8
4.9
5
3.2
4
3
3.5
2
3.0
1.4
0.4
1.5
1
0.7
0
4QFY15
1QFY16
2QFY16
3QFY16
4QFY16
(1)
(0.8)
Volume growth
Revenue growth (USD terms)
Source: Company, Angel Research
Exhibit 4: Revenue drivers for 4QFY2016
4
3.2
3
2
1.5
1
0
(1)
(0.6)
(1.1)
(2)
Volume
Currency impact
CC realization
Total revenue growth
Source: Company, Angel Research
In terms of verticals, BFSI (40.9% of sales) grew 3.2% qoq on CC, Telecom (8.3%
of sales) grew 1.3% qoq on CC, Retail & Distribution (14.1% of sales) grew 2.1%
qoq on CC and Manufacturing (10.4% of sales) grew 3.9% qoq on CC, during the
quarter. Hi-Tech and Life Sciences & Healthcare posted a de-growth of 1.5% and
growth of 1.2% qoq on CC, respectively. Travel & Hospitality (3.7% of sales)
posted a growth of 0.8% qoq on CC, while Energy & Utilities (4.1% of sales)
posted a growth of 3.0% qoq on CC basis.
April 27, 2016
3
TCS | 4QFY2016 Result Update
Exhibit 5: Revenue growth (Industry wise on CC basis)
% to revenue
% chg (CC qoq)
% chg (yoy)
BFSI
40.9
3.2
11.8
Manufacturing
10.4
3.9
10.7
Telecom
8.3
1.3
15.3
Life sciences and healthcare
7.3
1.2
19.0
Retail and distribution
14.1
2.1
13.8
Transportation & Hospitality
3.7
0.8
18.2
Energy and utilities
4.1
3.0
16.8
Media and entertainment
2.5
1.9
(0.6)
Hi-tech
5.6
(1.5)
2.0
Others
3.1
(5.4)
(26.4)
Source: Company, Angel Research
Service line wise, Infrastructure Services reported a sequential growth of 2.2% on
CC basis. In the company’s anchor service line - IT Solutions and Services - ADM
grew 1.2% qoq on CC basis, Enterprise Solutions remained flat and Assurance
Services grew by 4.5% qoq on CC basis. The BPO segment grew by 1.1% qoq on
CC basis, during the quarter. Asset Leveraged Solutions (3.2% of sales) grew by
18.5% qoq on CC basis.
Exhibit 6: Revenue growth (Service wise on CC basis)
% to revenue
% chg (CC qoq)
% chg (yoy)
IT solutions and services
ADM
39.7
1.2
8.3
Enterprise solutions
17.1
0.0
1.2
Assurance services
8.8
4.5
15.5
Engg. and industrial services
4.7
5.8
13.5
Infrastructure services
15.2
2.2
15.2
Asset-leveraged solutions
3.2
18.5
64.3
BPO
11.6
1.1
11.1
Source: Company, Angel Research
Geography wise, growth in INR sales in key geographies was as follows: - USA
(1.4% qoq on CC basis), Latin America (13.3% qoq on CC basis), Continental
Europe (2.3% qoq on CC basis), India (-6.7% qoq on CC basis) and MEA (-5.8%
qoq on CC basis). The UK and Asia Pacific posted a de-growth of
0.7% qoq and growth of 0.4% qoq on CC basis, respectively.
TCS has been making significant progress in Digital, which is evident from the
growth in the area and deal wins. Digital, which is now ~15.5% of total revenues,
grew by 14.8% qoq. In FY2016, Digital contributed by 13.8% to the total revenue
and saw a growth of 52.2% yoy.
April 27, 2016
4
TCS | 4QFY2016 Result Update
Exhibit 7: Revenue growth (Geography wise in INR terms)
% of revenue
% chg (CC qoq)
% chg (yoy)
U.S.
54.0
2.4
11.7
Latin America
2.0
1.8
17.5
U.K.
14.9
(0.4)
6.4
Continental Europe
11.2
3.6
10.3
India
5.9
2.2
5.6
Asia Pacific
9.6
1.1
8.6
MEA
2.4
9.5
25.2
Source: Company, Angel Research
Hiring moderate
In 4QFY2016, TCS witnessed a gross addition of 22,576 employees and net
addition of 9,152 employees, taking its total employee base to 3,53,843. During
the quarter, the attrition rate (last twelve month [LTM] basis) for the company
decreased from 15.9% to 14.7% in 4QFY2016.
Exhibit 8: Hiring and attrition trend
Particulars
4QFY15 1QFY16
2QFY16
3QFY16
4QFY16
Gross addition
14,395
20,320
25,186
22,118
22,576
Net addition
1,031
5,279
10,685
9,071
9,152
Total employee base
3,19,656
3,24,935
3,35,620
3,44,691
3,53,843
Attrition (%) - LTM basis
14.9
15.9
16.2
15.9
14.7
Source: Company, Angel Research
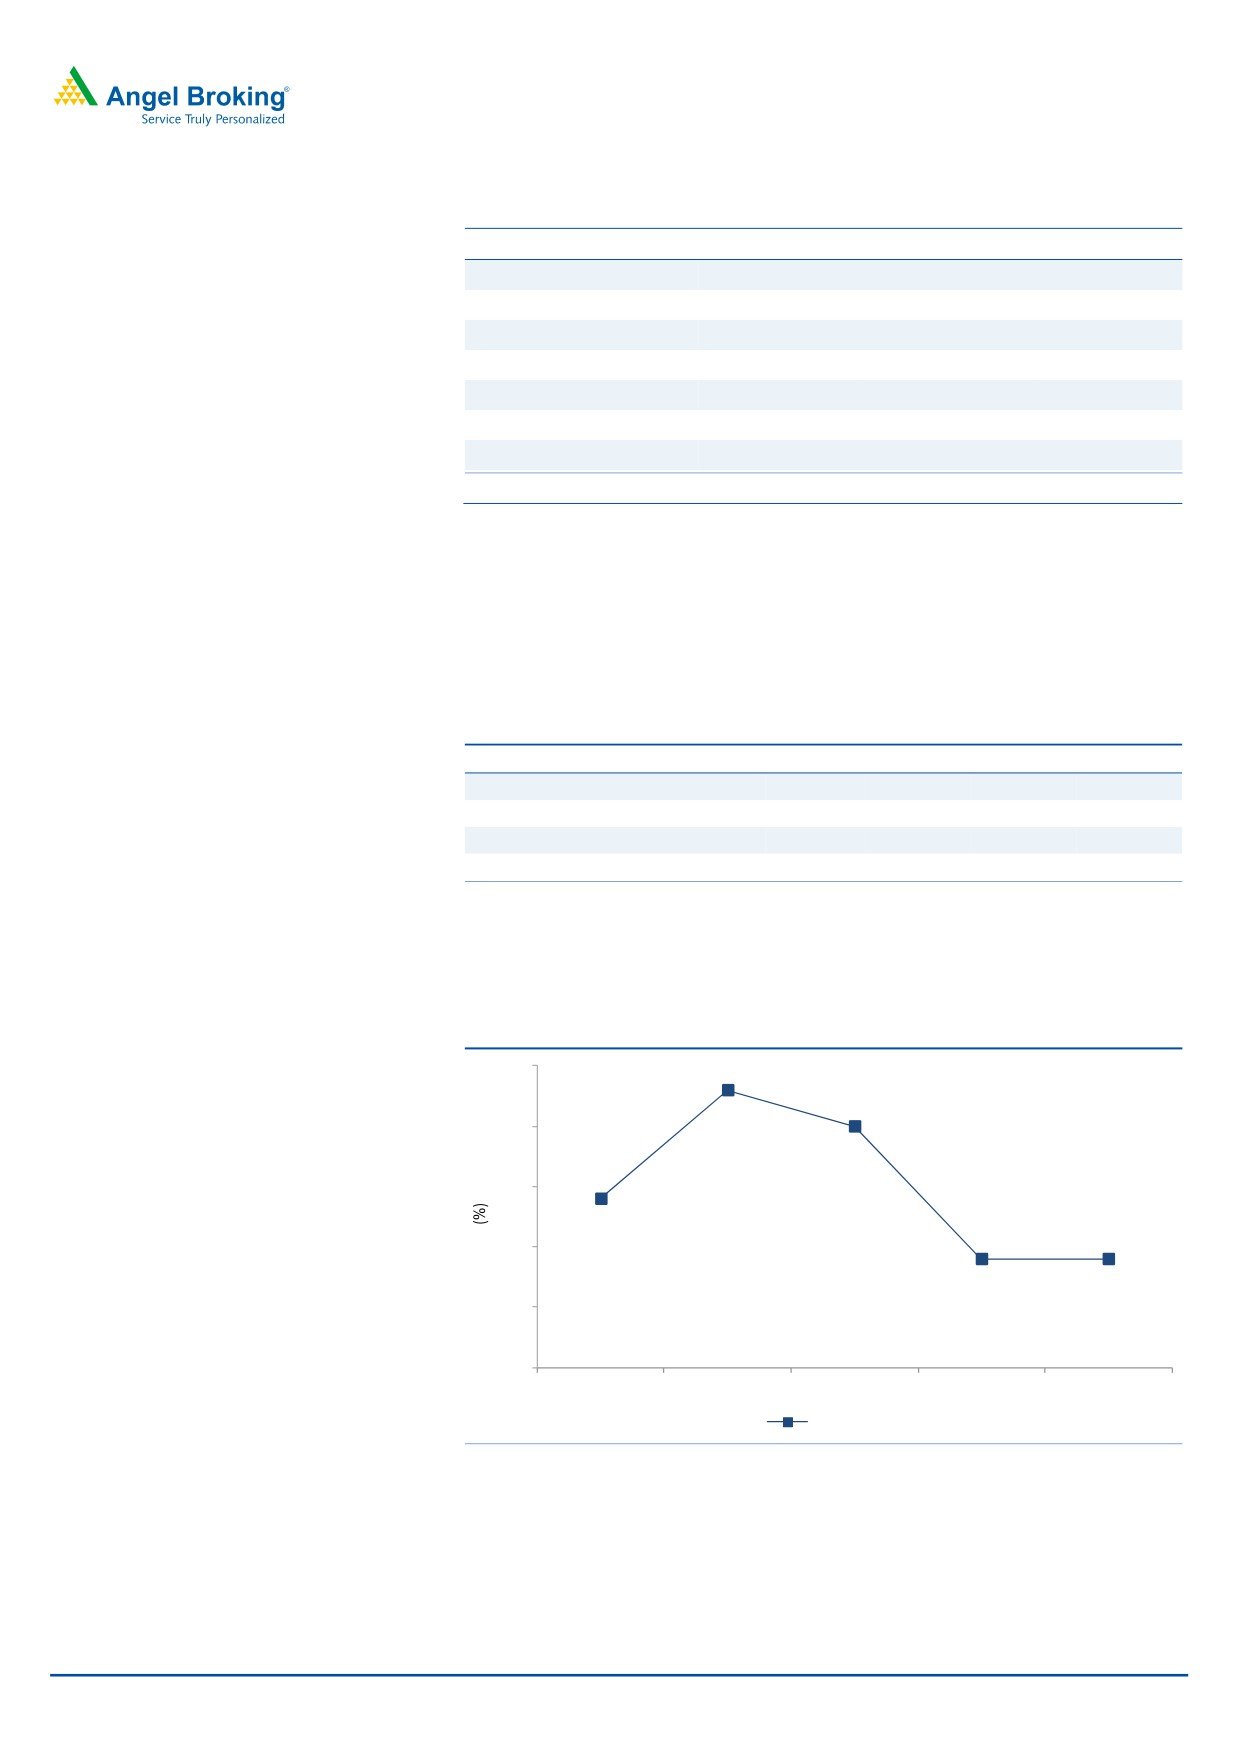
For 4QFY2016, the utilization rate (excluding trainees) remained stagnant at
84.9%.
Exhibit 9: Trend in utilization
87
86.3
86.0
86
85.4
86
84.9
84.9
85
85
84
4QFY15
1QFY16
2QFY16
3QFY16
4QFY16
Excluding trainees
Source: Company, Angel Research
April 27, 2016
5
TCS | 4QFY2016 Result Update
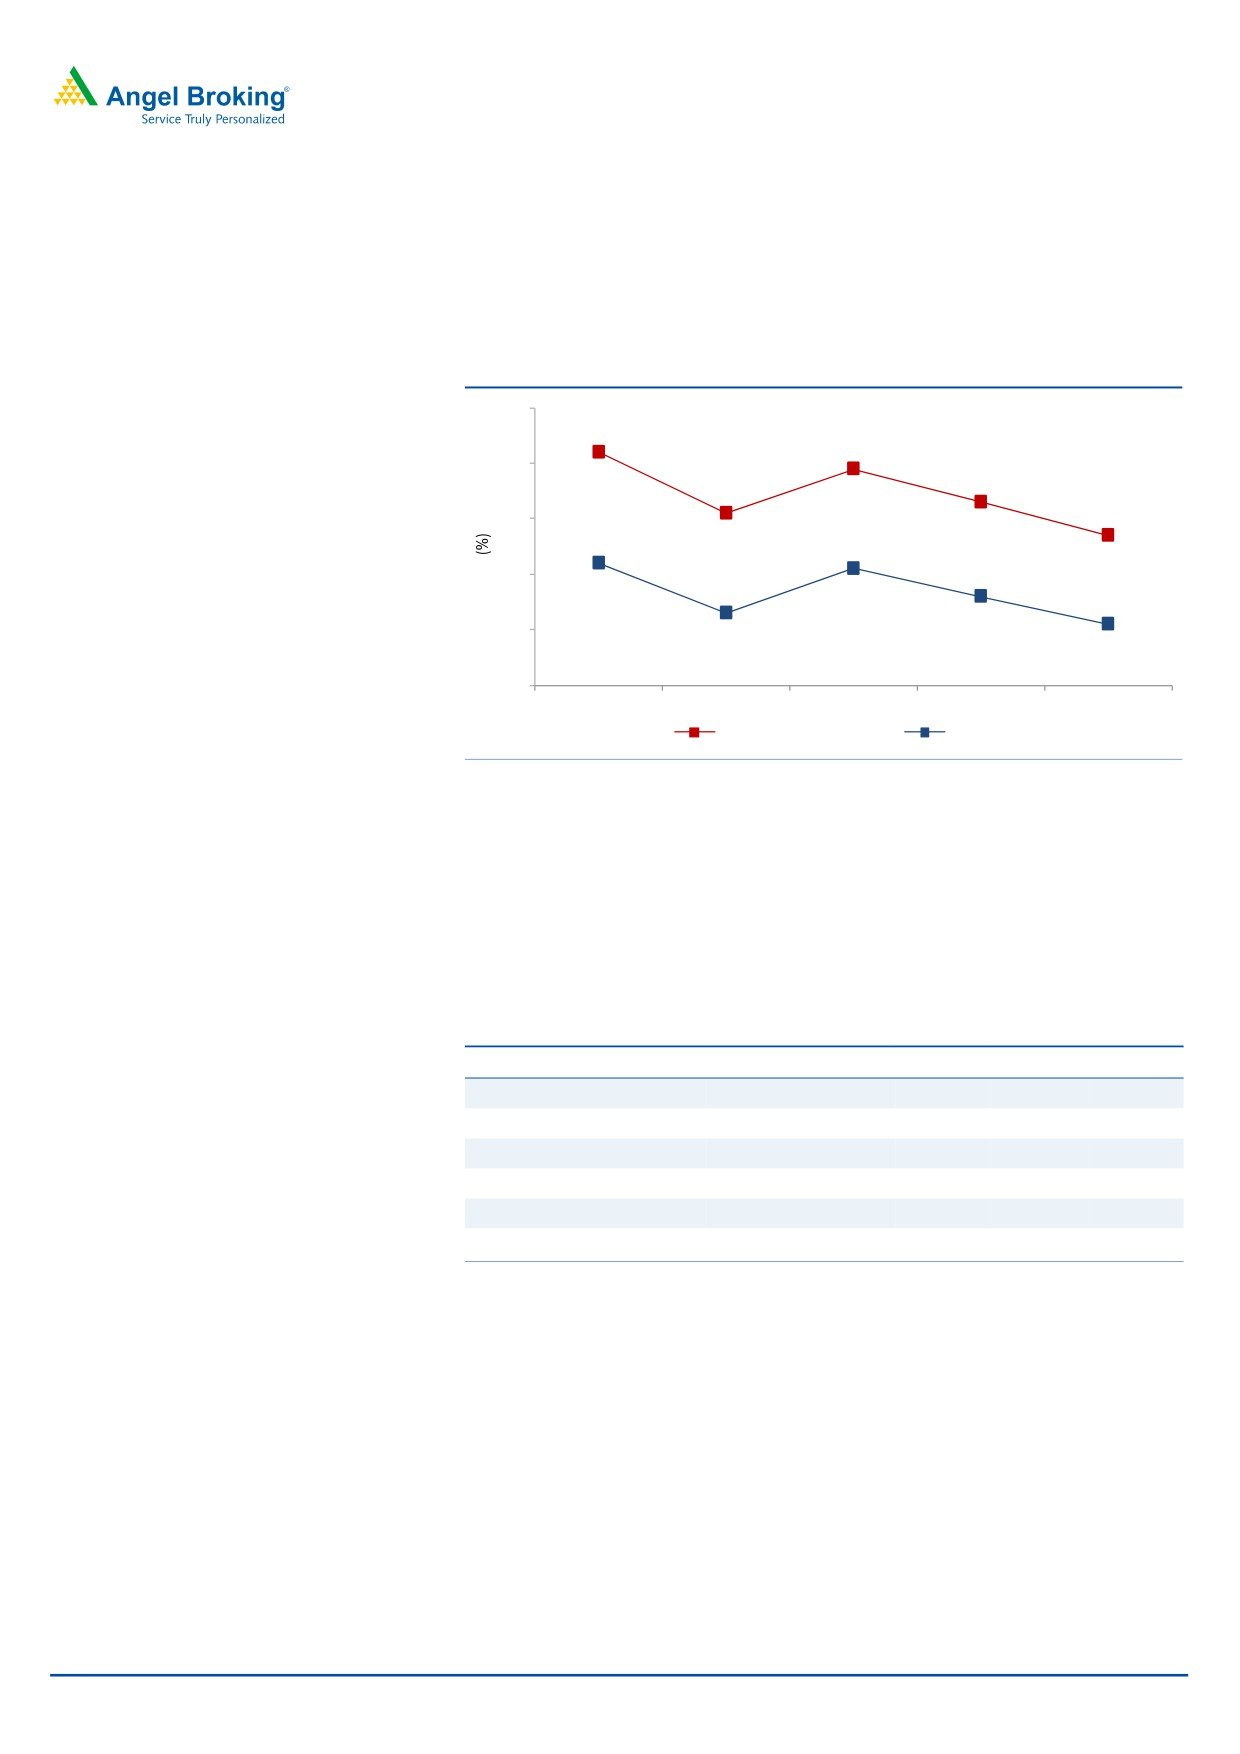
Margin dips
TCS’ EBIT margins for the quarter came in at 26.1% V/s 26.7% expected, a dip of
54bp qoq. Rupee depreciation and strong growth in Asset Leveraged Solutions
weren’t able to offset pricing pressure and reinvestments.
Exhibit 10: Adj. Margin profile
30
29.2
28.9
29
28.3
28.1
27.7
28
27
27.2
27.1
26.6
26
26.3
26.1
25
4QFY15
1QFY16
2QFY16
3QFY16
4QFY16
EBITDA margin
EBIT margin
Source: Company, Angel Research
Client metrics
The client pyramid during the quarter witnessed a qualitative improvement, with
client additions seen in higher revenue brackets. The clients in $100mn+ revenue
band increased by 3, in $50mn+ revenue band by 8 and in $10mn+ revenue
band by 17.
Exhibit 11: Client pyramid
4QFY15 1QFY16 2QFY16 3QFY16 4QFY16
US$1mn-5mn
389
391
415
425
400
US$5mn-10mn
128
123
130
132
131
US$10mn-20mn
99
96
103
108
125
US$20mn-50mn
94
103
106
108
100
US$50mn-100mn
39
39
32
31
36
US$100mn plus
29
30
33
34
37
Source: Company, Angel Research
April 27, 2016
6
TCS | 4QFY2016 Result Update
Investment Argument
Guidance
- Outlook upbeat: The Management refrained from giving any
additional color on FY2017E revenue growth outlook, but expects FY2017 to be
better than FY2016 as most of the headwinds (like Diligenta and Japan’s
underperformance) that were effecting the company’s growth in FY2016, seems to
be diminishing. TCS highlighted that deal wins remain decent across major
markets like the US and Europe with traction in Digital deals also remaining solid.
We expect the company to post a US$ revenue CAGR of 13.0% over FY2016-18E.
Deal pipeline outlook healthier: The Company has given a positive outlook for
FY2017. It expects a strong demand environment across the board in most areas
that it focuses on. TCS, post 4QFY2016, is in a much better position relative to the
end of FY2015. The key reasons behind the same are - dramatic acceleration in
the adoption of Digital technologies, good resilience and strong momentum in
BFSI, North America and Continental Europe, major headwinds of Diligenta,
Insurance vertical, Japan and Latin America are now behind, strong order book
and pipeline, and robust growth in platforms.
Outlook and valuation
Over FY2016-18E, we expect TCS’ revenue to post a CAGR of 13.0% in
USD and INR terms. The company highlighted that it stands comfortable of
sustaining the EBIT margin in the range of
26-28%. On the
EBIT and PAT fronts, we expect the company to post a 14.3% and 13.0% CAGR
over FY2016-18E, respectively. At the current market price of `2,488, the stock is
trading at 17.6x FY2017E and 15.7x FY2018E EPS of `141.0 and `158.1,
respectively. We maintain our Buy rating on the stock with a target price of `3,004.
Exhibit 12: Key assumptions
FY2017E
FY2018E
Revenue growth (USD)
13.0
13.0
USD-INR rate (realized)
65.7
65.7
Revenue growth (`)
13.0
13.0
EBITDA margin (%)
28.3
28.3
Tax rate (%)
23.5
23.5
EPS growth (%)
14.0
12.1
Source: Company, Angel Research
April 27, 2016
7
TCS | 4QFY2016 Result Update
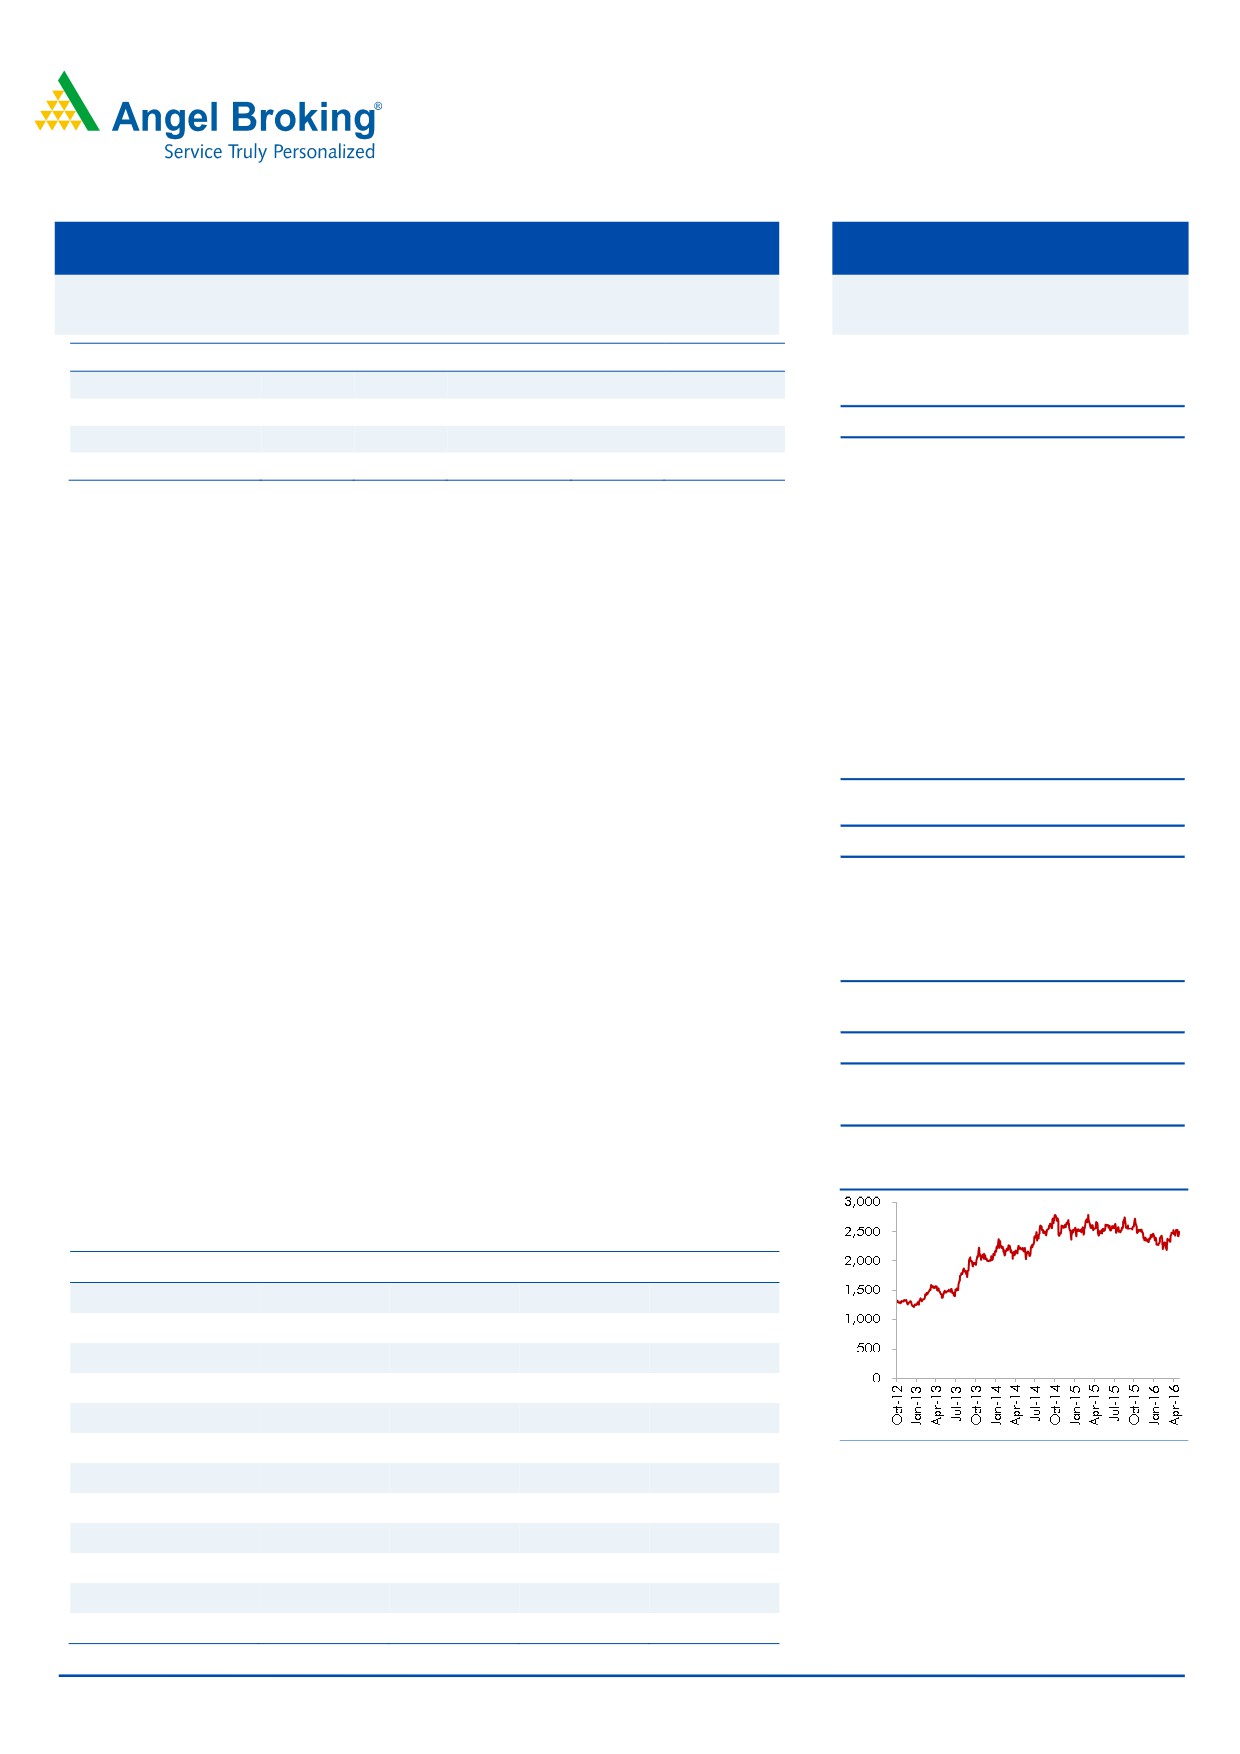
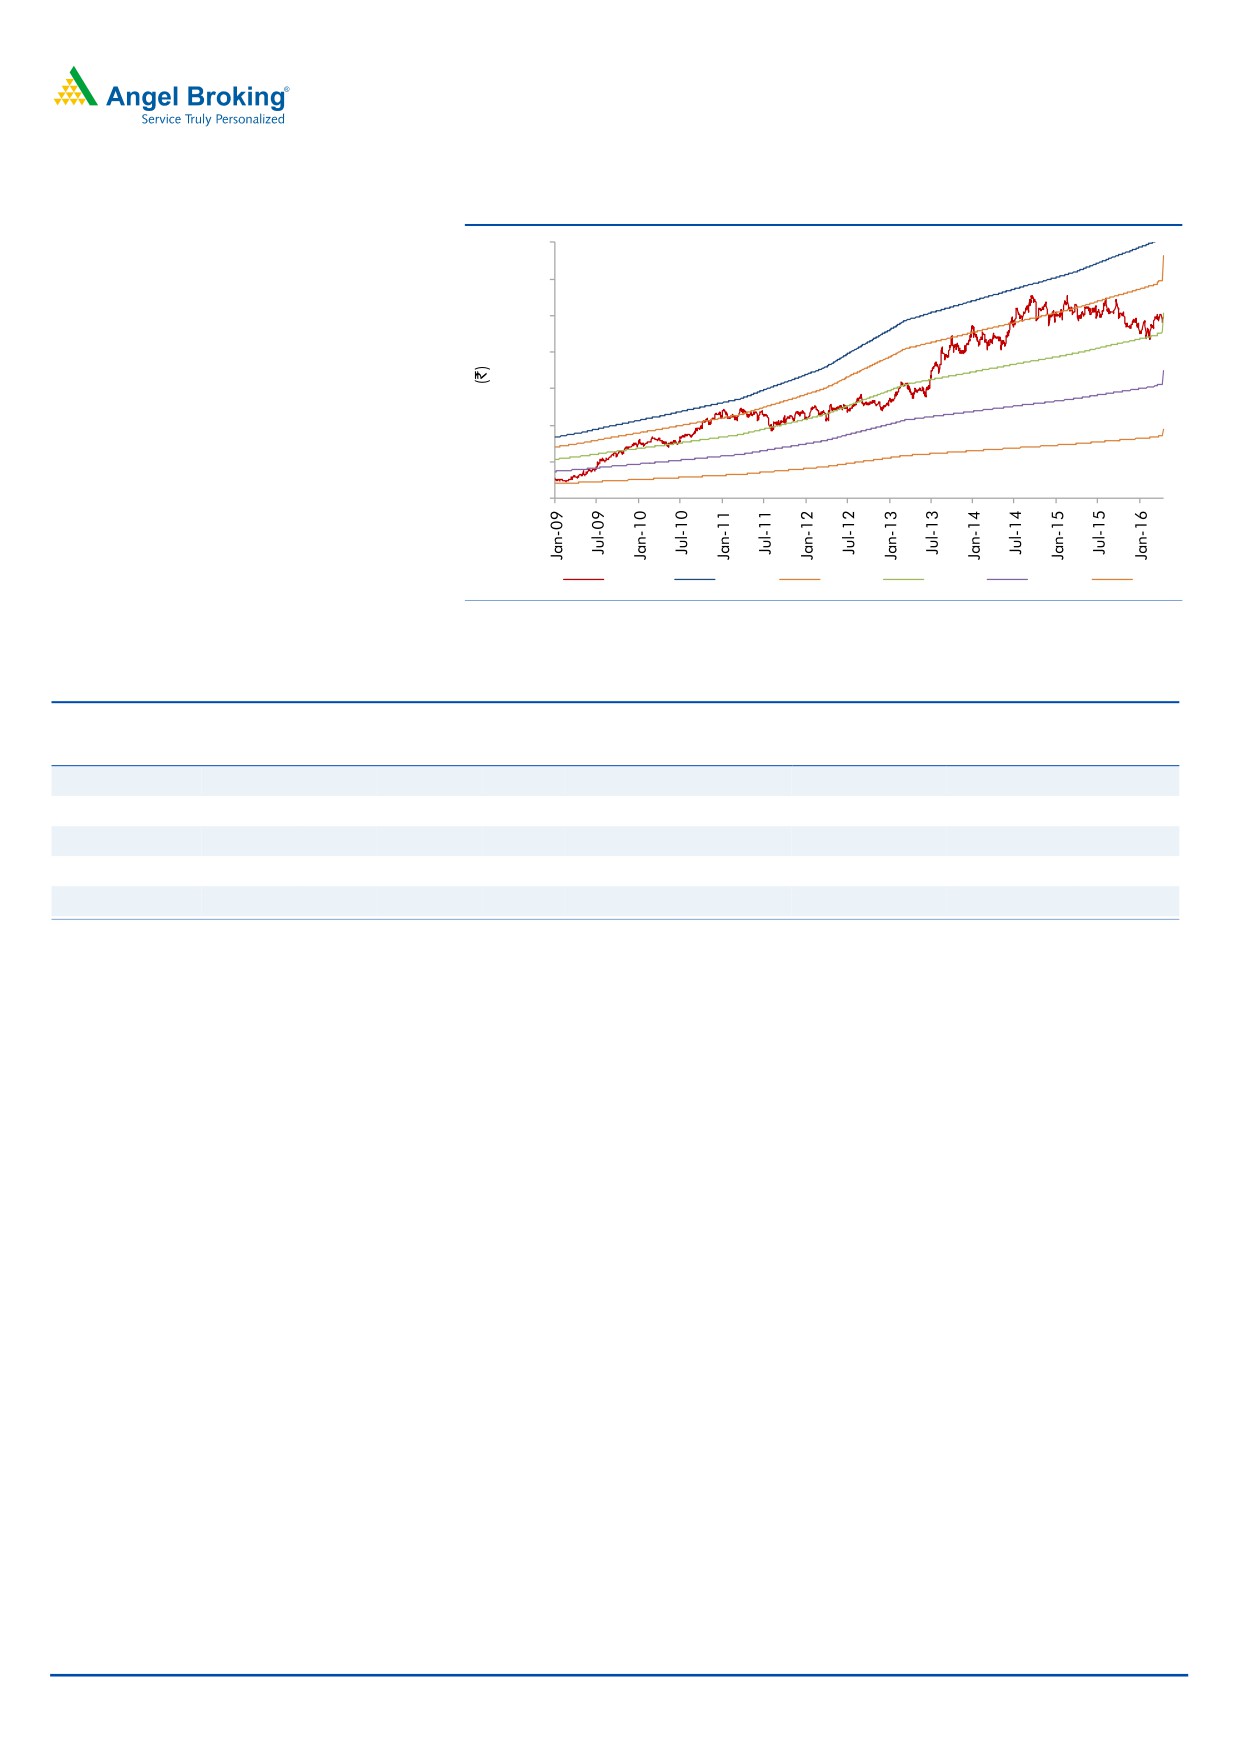
Exhibit 13: One-year forward PE chart
3,500
3,000
2,500
2,000
1,500
1,000
500
0
Price
25x
21x
16x
11x
6x
Source: Company, Angel Research
Exhibit 14: Recommendation summary
Company
Reco
CMP Tgt. price Upside
FY2017E FY2017E
FY2015-17E
FY2017E FY2017E
(`)
(`)
(%)
EBITDA (%)
P/E (x)
EPS CAGR (%)
EV/Sales (x)
RoE (%)
HCL Tech
Buy
850
1,038
22.1
21.5
16.5
10.6
2.5
19.8
Infosys
Accumulate
1,233
1,374
11.4
27.5
20.9
8.9
4.0
19.7
TCS
Buy
2,488
3,004
20.7
28.3
17.6
12.8
4.1
35.5
Tech Mahindra
Accumulate
476
530
11.3
17.0
16.5
8.0
1.5
18.6
Wipro
Buy
555
6801
22.6
23.8
14.9
9.7
2.2
17.9
Source: Company, Angel Research
April 27, 2016
8
TCS | 4QFY2016 Result Update
Company background
TCS is Asia's largest IT services provider and is amongst the top 10 technology
firms in the world. The company has a global footprint with an employee base of
over 3.0 lakh professionals, offering services to more than 1,000 clients across
various industry segments. The company has one of the widest portfolios of
services offerings, spanning across the entire IT service value chain - from
traditional application development and maintenance to consulting and package
implementation to products and platforms.
April 27, 2016
9
TCS | 4QFY2016 Result Update
Profit & Loss statement (Consolidated, IFRS)
Y/E March (` cr)
FY2014
FY2015
FY2016
FY2017E FY2018E
Net sales
81,809
94,648
1,08,646
1,22,770
1,38,730
Cost of revenue
42,207
50,599
58,952
65,068
73,527
Gross profit
39,603
44,049
49,695
57,702
65,203
% of net sales
48.4
46.5
45.7
47.0
47.0
SGA expenses
14,471
17,353
18,956
22,958
25,943
% of net sales
17.7
18.3
17.4
18.7
18.7
EBITDA
25,132
26,696
30,738
34,744
39,261
% of net sales
30.7
28.2
28.3
28.3
28.3
Dep. and amortization
1324
1272
1948
1535
1655
% of net sales
1.6
1.3
1.8
1.3
1.2
EBIT
23,808
25,424
28,790
33,209
37,606
% of net sales
29.1
26.9
26.5
27.0
27.1
Other income, net
1589
3140
3050
3050
3050
Profit before tax
25,397
28,564
31,840
36,259
40,656
Provision for tax
6,071
6,083
7,503
8,521
9,554
% of PBT
23.9
21.3
23.6
23.5
23.5
PAT
19,326
22,481
24,338
27,738
31,102
Minority interest
209
205
123
141
161
Extra-ordinary (Exp.)/ Inc.
(2,627.9)
Reported PAT
19,117
19,648
24,215
27,598
30,941
Adj. PAT
19,117
21,696
24,215
27,598
30,941
Diluted EPS (`)
97.6
110.9
123.7
141.0
158.1
April 27, 2016
10
TCS | 4QFY2016 Result Update
Balance sheet (Consolidated, IFRS)
Y/E March (` cr)
FY2014 FY2015
FY2016 FY2017E FY2018E
Assets
Cash and cash equivalents
1,469
1,862
1,862
1,603
1,770
Other current financial assets
18,107
16,383
4,833
27,366
35,229
Accounts receivable
18,230
20,440
24,073
26,506
29,952
Unbilled revenues
4,006
3,827
3,992
5,347
5,348
Other current assets
-
6,414
5,975
5,975
5,975
Property and equipment
10,364
11,572
11,790
12,790
13,790
Intangible assets and goodwill
4,157
3,931
3,946
3,946
3,946
Investments
3,449
9,619
22,822
22,822
22,822
Other non current assets
-
906
11,919
11,919
11,919
Total assets
68,913
74,954
91,212
1,18,274
1,30,752
Liabilities
Current liabilities
10,906
14,428
15,407
35,425
40,031
Short term borrowings
170
243
162
162
162
Redeemable preference shares
-
-
(0)
-
1
Long term debt
127
114
83
83
83
Other non current liabilities
1,684
1,778
2,017
2,310
2,610
Minority interest
691
914
354
495
656
Shareholders funds
55,335
57,477
73,190
79,800
87,210
Total liabilities
68,913
74,954
91,212
1,18,274
1,30,752
April 27, 2016
11
TCS | 4QFY2016 Result Update
Cash flow statement (Consolidated, IFRS)
Y/E March (` cr)
FY2014
FY2015
FY2016
FY2017E
FY2018E
Pre-tax profit from oper.
23,808
22,481
24,338
27,738
31,102
Depreciation
1,324
1,272
1,948
1,535
1,655
Exp. (deferred)/written off
209
160
174
-
-
Pre tax cash from oper
24,923
23,913
26,460
29,273
32,757
Other inc./prior period ad
1,589
1,272
1,948
1,535
1,655
Net cash from operations
26,512
25,185
28,408
30,808
34,412
Tax
6,071
6,083
7,503
8,521
9,554
Cash profits
20,441
19,102
20,905
22,287
24,857
(Inc)/dec in acc. recv.
(4,154)
(2,210)
(3,633)
(2,433)
(3,446)
(Inc)/dec in unbilled rev.
(846)
179
(165)
(1,355)
(1)
(Inc)/dec in oth. current asst.
(6,650)
(6,414)
439
-
-
Inc/(dec) in current liab.
2,223
(1,207)
(218)
(1,000)
(1,000)
Net trade working capital
(9,427)
(9,652)
(3,577)
(4,788)
(4,447)
Cash flow from opert. actv.
11,015
9,450
17,328
17,499
20,411
(Inc)/dec in fixed assets
(3,494)
(1,207)
(218)
(1,000)
(1,000)
(Inc)/dec in investments
(1,409)
(4,446)
(1,653)
(22,533)
(7,863)
(Inc)/dec in intangible asst.
(651)
(226)
16
-
-
(Inc)/dec in non-cur.asst.
(1,335)
(906)
(11,013)
-
-
Cash flow from invt. actv.
(6,889)
(6,786)
(12,869)
(23,533)
(8,863)
Inc/(dec) in debt
203
61
(113)
-
-
Inc/(dec) in equity
34
223
(559)
141
161
Inc/(dec) in minority int.
(14,666)
(19,923)
(18,415)
(20,988)
(23,530)
Dividends
9,929
17,369
14,629
26,622
11,989
Cash flow from finan. actv.
(4,500)
(2,271)
(4,459)
5,774
(11,380)
Cash generated/(utilized)
(374)
393
-
(260)
167
Cash at start of the year
1,843
1,469
1,862
1,862
1,603
Cash at end of the year
1,469
1,862
1,862
1,603
1,770
April 27, 2016
12
TCS | 4QFY2016 Result Update
Key ratios
Y/E March
FY2014
FY2015
FY2016
FY2017E
FY2018E
Valuation ratio(x)
P/E (on FDEPS)
25.5
22.4
20.1
17.6
15.7
P/CEPS
23.8
23.3
18.6
16.7
15.0
P/BVPS
8.8
8.5
6.7
6.1
5.6
Dividend yield (%)
1.3
1.7
1.6
1.8
2.1
EV/Sales
5.7
4.9
4.3
3.6
3.1
EV/EBITDA
18.7
17.4
15.1
12.7
11.0
EV/Total assets
6.8
6.2
5.1
3.7
3.3
Per share data (`)
EPS
97.6
110.9
123.7
141.0
158.1
Cash EPS
104.4
106.8
133.6
148.7
166.4
Dividend
32.0
43.5
40.2
45.8
51.3
Book value
283
294
374
408
446
Dupont analysis
Tax retention ratio (PAT/PBT)
0.8
0.8
0.8
0.8
0.8
Cost of debt (PBT/EBIT)
1.1
1.1
1.1
1.1
1.1
EBIT margin (EBIT/Sales)
0.3
0.3
0.3
0.3
0.3
Asset turnover ratio (Sales/Assets)
1.2
1.3
1.2
1.0
1.1
Leverage ratio (Assets/Equity)
1.2
1.3
1.2
1.5
1.5
Operating ROE
34.9
39.1
33.3
34.8
35.7
Return ratios (%)
RoCE (pre-tax)
34.5
33.9
31.6
28.1
28.8
Angel RoIC
51.9
54.0
46.7
50.0
53.0
RoE
34.5
34.2
33.1
34.6
35.5
Turnover ratios(x)
Asset turnover (fixed assets)
7.9
8.2
9.2
9.6
10.1
Receivables days
81
79
81
79
79
April 27, 2016
13
TCS | 4QFY2016 Result Update
Research Team Tel: 022 - 39357800
DISCLAIMER
Angel Broking Private Limited (hereinafter referred to as “Angel”) is a registered Member of National Stock Exchange of India Limited,
Bombay Stock Exchange Limited and Metropolitan Stock Exchange of India Limited. It is also registered as a Depository Participant with
CDSL and Portfolio Manager with SEBI. It also has registration with AMFI as a Mutual Fund Distributor. Angel Broking Private Limited is
a registered entity with SEBI for Research Analyst in terms of SEBI (Research Analyst) Regulations, 2014 vide registration number
INH000000164. Angel or its associates has not been debarred/ suspended by SEBI or any other regulatory authority for accessing
/dealing in securities Market. Angel or its associates including its relatives/analyst do not hold any financial interest/beneficial
ownership of more than 1% in the company covered by Analyst. Angel or its associates/analyst has not received any compensation /
managed or co-managed public offering of securities of the company covered by Analyst during the past twelve months. Angel/analyst
has not served as an officer, director or employee of company covered by Analyst and has not been engaged in market making activity
of the company covered by Analyst.
This document is solely for the personal information of the recipient, and must not be singularly used as the basis of any investment
decision. Nothing in this document should be construed as investment or financial advice. Each recipient of this document should
make such investigations as they deem necessary to arrive at an independent evaluation of an investment in the securities of the
companies referred to in this document (including the merits and risks involved), and should consult their own advisors to determine
the merits and risks of such an investment.
Reports based on technical and derivative analysis center on studying charts of a stock's price movement, outstanding positions and
trading volume, as opposed to focusing on a company's fundamentals and, as such, may not match with a report on a company's
fundamentals.
The information in this document has been printed on the basis of publicly available information, internal data and other reliable
sources believed to be true, but we do not represent that it is accurate or complete and it should not be relied on as such, as this
document is for general guidance only. Angel Broking Pvt. Limited or any of its affiliates/ group companies shall not be in any way
responsible for any loss or damage that may arise to any person from any inadvertent error in the information contained in this report.
Angel Broking Pvt. Limited has not independently verified all the information contained within this document. Accordingly, we cannot
testify, nor make any representation or warranty, express or implied, to the accuracy, contents or data contained within this document.
While Angel Broking Pvt. Limited endeavors to update on a reasonable basis the information discussed in this material, there may be
regulatory, compliance, or other reasons that prevent us from doing so.
This document is being supplied to you solely for your information, and its contents, information or data may not be reproduced,
redistributed or passed on, directly or indirectly.
Neither Angel Broking Pvt. Limited, nor its directors, employees or affiliates shall be liable for any loss or damage that may arise from
or in connection with the use of this information.
Note: Please refer to the important ‘Stock Holding Disclosure' report on the Angel website (Research Section). Also, please refer to the
latest update on respective stocks for the disclosure status in respect of those stocks. Angel Broking Pvt. Limited and its affiliates may
have investment positions in the stocks recommended in this report.
Disclosure of Interest Statement
TCS
1. Analyst ownership of the stock
No
2. Angel and its Group companies ownership of the stock
No
3. Angel and its Group companies' Directors ownership of the stock
No
4. Broking relationship with company covered
No
Note: We have not considered any Exposure below ` 1 lakh for Angel, its Group companies and Directors
Ratings (Based on expected returns
Buy (> 15%)
Accumulate (5% to 15%)
Neutral (-5 to 5%)
over 12 months investment period):
Reduce (-5% to -15%)
Sell (< -15)
April 27, 2016
14