2QFY2017 Result Update | IT
October 21, 2016
Tata Consultancy Services (TCS)
ACCUMULATE
CMP
`2,398
Performance highlights
Target Price
`2,620
(` cr)
2QFY17 1QFY17
% chg (qoq) 2QFY16
% chg (yoy)
Investment Period
12 Months
Net revenue
29,284
29,305
(0.1)
27,166
7.8
Adj. EBITDA
7,065
7,837
(9.8)
7,389
(4.4)
Stock Info
Adj. EBITDA margin (%)
27.7
26.7
(50)bps
27.2
(50)bps
Sector
IT
Adj. PAT
6,586
6,317
4.3
6,055
8.8
Market Cap (` cr)
472,568
Source: Company, Angel Research
Net Debt (` cr)
(14,442)
Beta
0.7
TCS has announced its 2QFY2017 results and has posted a 0.3% sequential
52 Week High / Low
2,740/2,119
growth in USD revenues to US$4,374mn (V/s US $4,441mn expected). Though
Avg. Daily Volume
85,322
the results came in below expectations, the EBIT margins and net profit came in
much higher than expected. The constant currency (CC) growth stands at 1.0%
Face Value (`)
1
qoq, while the volume growth is at 1.3% qoq. On the operating front, the EBIT
BSE Sensex
28,051
margins came in at 26.2% (V/s 25.2% expected), an expansion of 93bp.
Nifty
8,678
Consequently, the PAT came in at `6,586cr (V/s `6,377cr), a rise of 4.3% qoq.
Reuters Code
TCS.BO
We recommend an accumulate stance on the stock.
Bloomberg Code
TCS@IN
Quarterly highlights: The company posted a 0.3% sequential growth in USD
revenues to US$4,374mn (V/s US $4,441mn expected). In INR terms, revenues
Shareholding Pattern (%)
dipped by 0.1% qoq to `29,284cr (V/s `29,707cr)by. The constant currency
Promoters
73.3
(CC) growth stands at 1.0% qoq, while the volume growth is at 1.3% qoq. On
MF / Banks / Indian Fls
5.5
the operating front, the EBIT margins came in at 26.2% (V/s 25.2% expected), an
FII / NRIs / OCBs
17.0
expansion of 93bp. Consequently, the PAT came in at `6,586cr (V/s `6,377cr),
Indian Public / Others
4.2
a rise of 4.3% qoq. The clients in $50mn+ revenue band increased by 2, in
$20mn+ revenue band by 5 and in $5mn+ revenue band by 13. The attrition
Abs.(%)
3m 1yr
3yr
rate was at 11.9% in the IT services.
Sensex
1.1
3.1
34.3
Outlook and valuation: With headwinds from Diligenta and Latin America
TCS
(1.4)
(3.1)
13.1
behind, still an uncertain BFSI may mar the company’s growth (although the
same is not currently being encountered). However, even on conservative
estimates, we expect TCS to post revenue CAGR of 10.5% in USD as well as INR
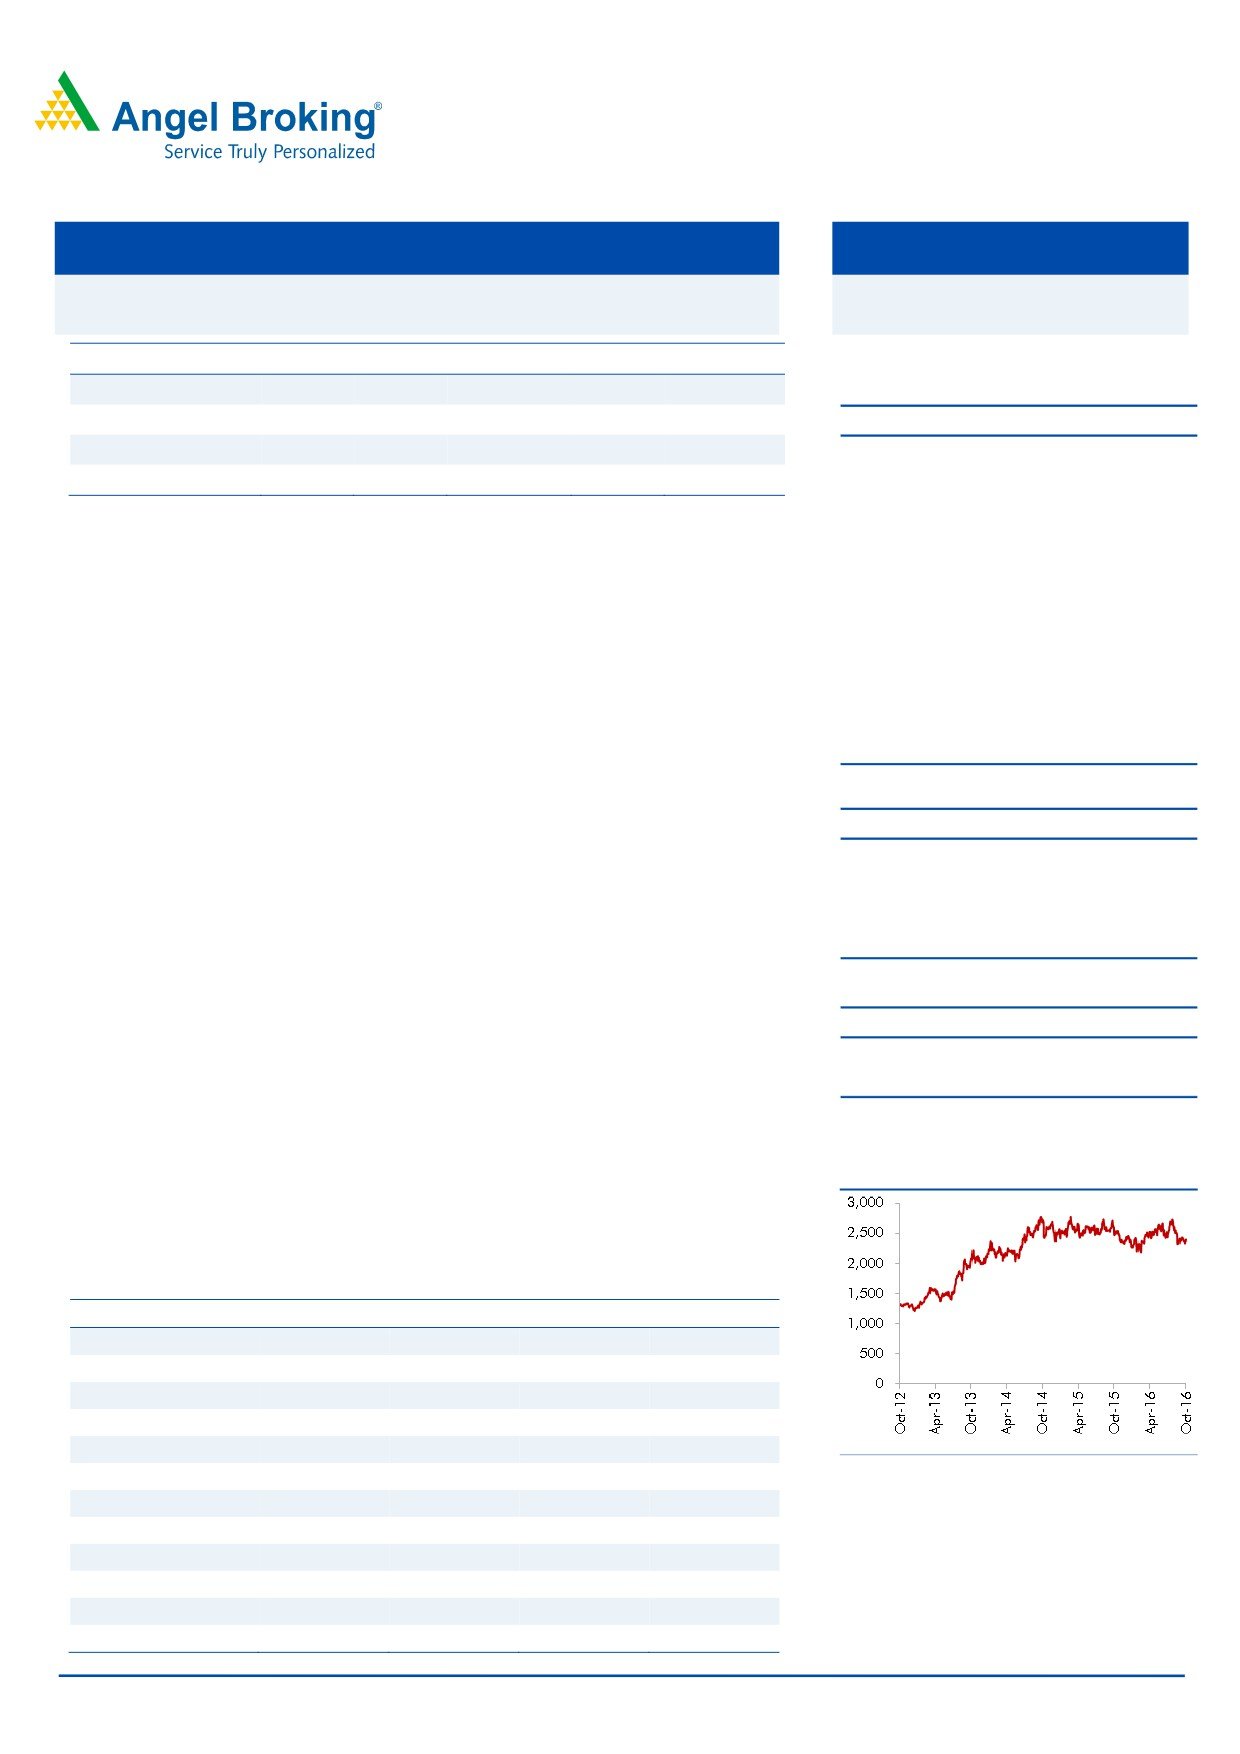
3-Year Daily Price Chart
terms over FY2016-18E. The stock trades at 16.5x its FY2018E EPS, which is
expected to be positive in the near term. Hence, we recommend an accumulate
on the stock.
Key financials (Consolidated, IFRS)
Y/E March (` cr)
FY2015
FY2016
FY2017E
FY2018E
Net sales
94,648
1,08,646
1,19,025
1,33,308
% chg
15.7
14.8
9.6
12.0
Net profit
21,696
24,215
25,685
28,483
% chg
13.5
11.6
6.1
10.9
EBITDA margin (%)
28.2
28.3
27.6
27.6
EPS (`)
110.9
123.7
131.2
145.5
Source: Company, Angel Research
P/E (x)
21.6
19.4
18.3
16.5
P/BV (x)
8.2
6.4
5.9
5.4
RoE (%)
34.2
33.1
32.4
33.1
RoCE (%)
33.9
31.6
26.3
26.9
Sarabjit kour Nangra
EV/Sales (x)
4.9
4.2
3.7
3.2
+91 22 3935 7800 Ext: 6806
EV/EBITDA (x)
17.3
14.9
13.4
11.8
sarabjit @angelbroking.com
Source: Company, Angel Research; Note: CMP as of October 18, 2016
Please refer to important disclosures at the end of this report
1
TCS | 2QFY2017 Result Update
Exhibit 1: 2QFY2017 performance (Consolidated, IFRS)
(` cr)
2QFY17
1QFY17
% chg (qoq)
2QFY16
% chg (yoy)
1HFY17 1HFY16
% chg(yoy)
Net revenue
29,284
29,305
(0.1)
27,166
7.8
58,589
52,833
10.9
Cost of revenue
16,038
16,312
(1.7)
14,607
9.8
32,350
26,914
20.2
Gross profit
13,246
12,993
1.9
12,559
5.5
26,239
25,919
1.2
SG&A expense
5,133
5,156
(0.4)
4,662
10.1
10,289
10,896
(5.6)
EBITDA
8,113
7,837
3.5
7,897
2.7
15,950
15,023
6.2
Dep. and amortisation
496
490
1.2
543
(8.7)
986
922
6.9
EBIT
7,617
7,347
3.7
7,354
3.6
14,964
14,101
6.1
Other income
1,052
963
9.2
675
55.9
2,015
1,447
PBT
8,669
8,310
4.3
8,029
8.0
16,979
15,548
9.2
Income tax
2,066
1,992
1,936
6.7
4,058
3,682
10.2
PAT
6,603
6,318
4.5
6,093
8.4
12,921
11,866
8.9
Earnings in affiliates
-
-
-
-
-
-
-
-
Minority interest
17
-
38
(54.9)
-
-
Reported PAT
6,586
6,317
4.3
6,055
8.8
12,921
11,866
8.9
Adj. PAT
6,586
6,317
4.3
6,055
8.8
12,921
11,866
8.9
EPS
33.4
32.1
4.3
30.8
8.5
65.5
60.0
9.2
Gross margin (%)
45.2
44.3
90bp
46.2
(100)bp
44.8
49.1
(427)bp
EBITDA margin (%)
27.7
26.7
96bp
29.1
(137)bp
27.2
28.4
(121)bp
EBIT margin (%)
26.0
25.1
93bp
26.0
0bp
25.5
26.7
(115)bp
Source: Company, Angel Research
Exhibit 2: Actual vs Angel estimates
(` cr)
Actual
Estimate
Var. (%)
Net revenue
29,284
29,707
(1.4)
EBIT margin (%)
26.0
25.2
80bps
Adj. PAT
6,586
6,377
3.3
Source: Company, Angel Research
Numbers lower than expectations
TCS posted a 0.3% sequential growth in USD revenues to US$4,374mn (V/s US
$4,441mn expected). In INR terms, revenues dipped by 0.1% qoq to `29,284cr
(V/s `29,707cr). The constant currency (CC) growth stands at 1.0% qoq, while the
volume growth is at 1.3% qoq.
The key geographies like USA grew by 1.4% qoq (CC), while Latin America posted
a dip of 0.2% qoq (CC). In Europe, the UK posted a dip of 0.1% qoq (CC) terms,
while the Continental Europe posted a growth of 3.7% qoq (CC). India posted a
dip of 7.6% qoq (CC), while Asia Pacific and MEA posted a growth of 3.5% qoq
and 2.2% qoq (CC).
In terms of domain, the BSFI (40.4% sales) posted a CC qoq growth of 1.2%, Retail
& CPG (13.4% sales) posted a CC qoq de-growth of 3.1%. Communication &
Media (11.4% sales) posted a CC qoq growth of 2.0%, Manufacturing (10.7%
sales) posted a CC qoq growth of 3.1%, and Life sciences & Healthcare ( 7.6% of
sales) posted a CC qoq growth of 4.7%.
October 21, 2016
2
TCS | 2QFY2017 Result Update
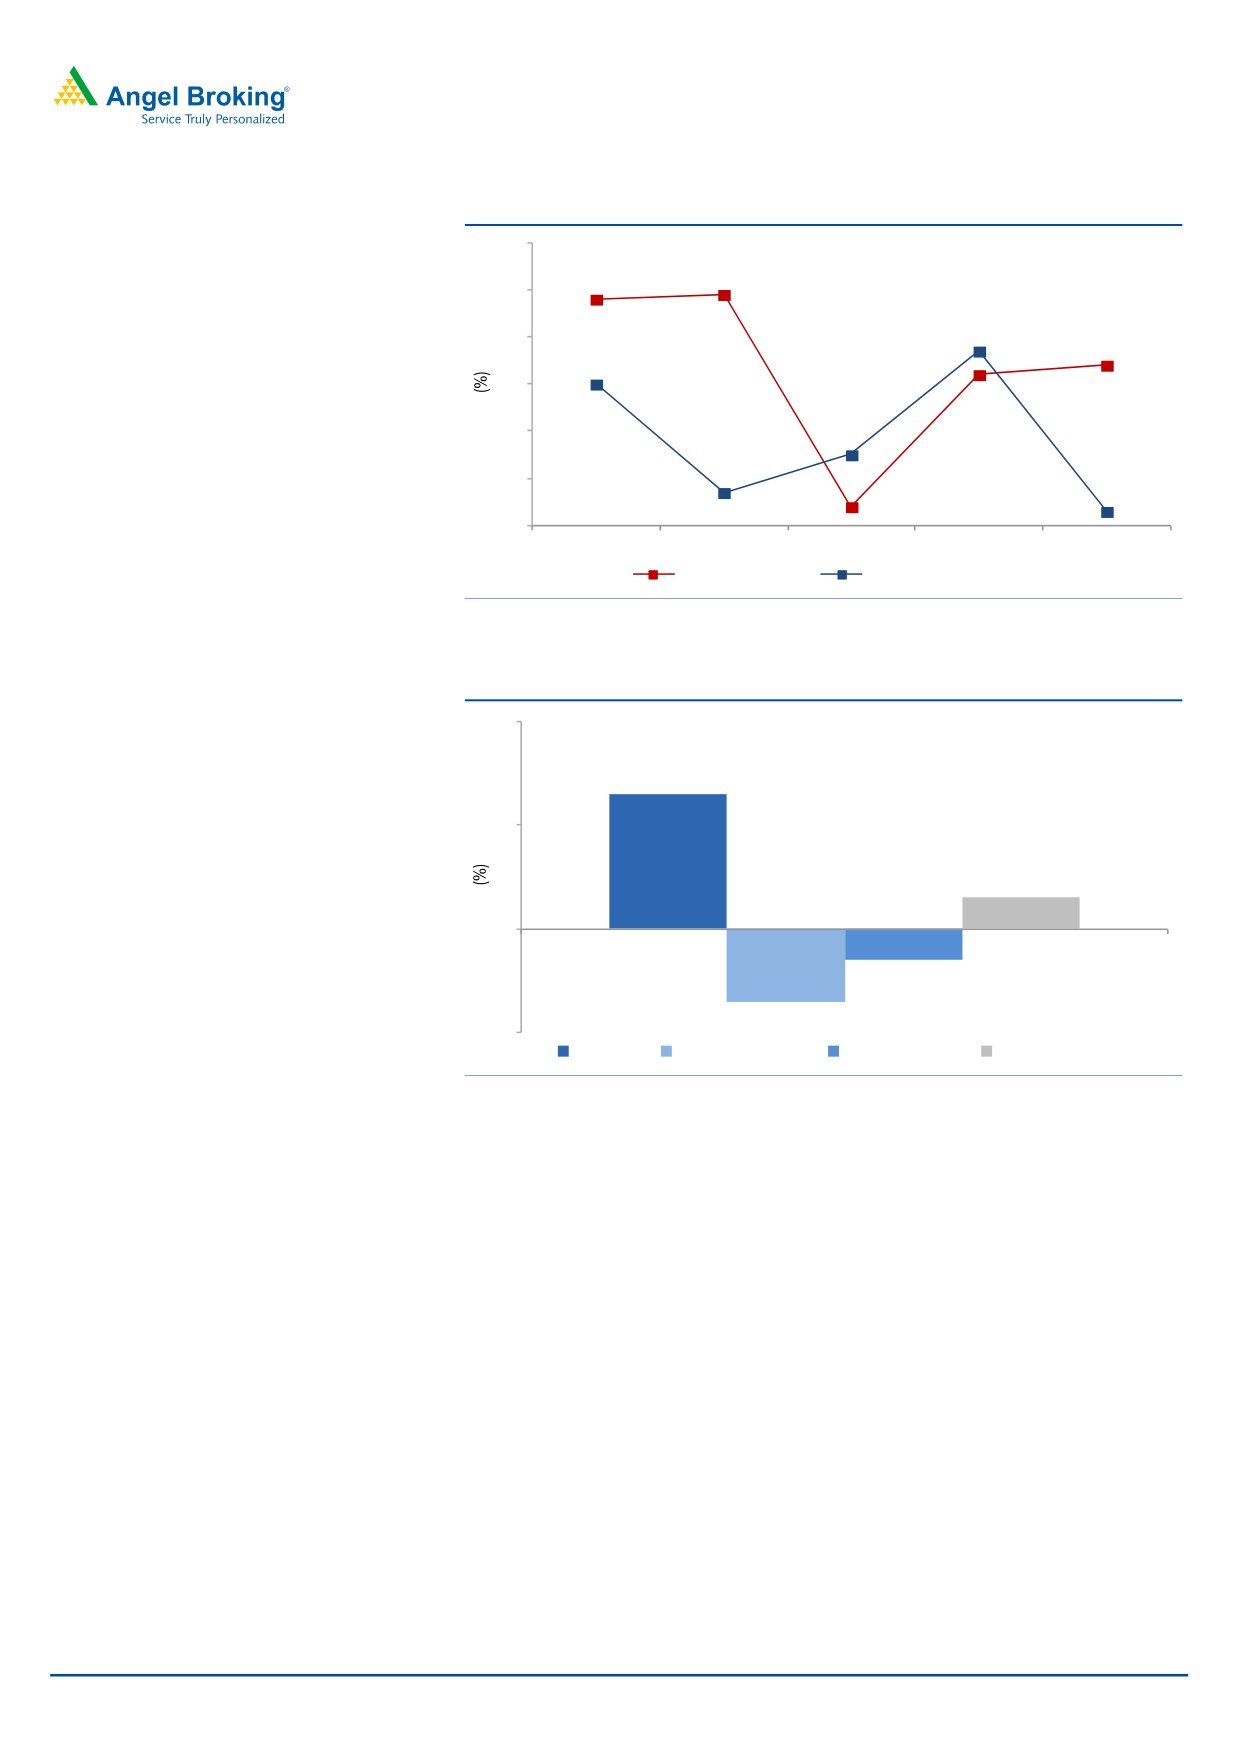
Exhibit 3: Trend in volume and revenue growth (qoq)
6.0
5.0
4.9
4.8
3.7
4.0
3.0
3.0
3.4
3.2
2.0
1.5
0.7
1.0
0.4
0.3
0.0
2QFY16
3QFY16
4QFY16
1QFY17
2QFY17
Volume growth
Revenue growth (USD terms)
Source: Company, Angel Research
Exhibit 4: Revenue drivers for 2QFY2017
2.0
1.3
1.0
0.3
0.0
(0.3)
(0.7)
(1.0)
Volume
Currency impact
CC realization
Total revenue growth
Source: Company, Angel Research
BFSI growth lagged remaining business, owing to an uncertain macro
environment; the company expressed that the potential ramifications of the Brexit
on BFSI are still not totally clear. Digital segment further continued to show weak
numbers by 1.5% qoq to US$704mn and accounted for 16.1% of total revenue
during the quarter.
October 21, 2016
3
TCS | 2QFY2017 Result Update
Exhibit 5: Revenue growth (Industry wise on CC basis)
% to revenue
% chg (CC qoq)
% chg (yoy)
BFSI
40.4
1.2
7.2
Manufacturing
10.7
3.1
15.1
Telecom & Media
11.4
2.0
12.3
Life sciences and healthcare
7.6
4.7
14.8
Retail and distribution
13.4
(3.1)
1.9
Transportation & Hospitality
3.9
2.3
17.1
Energy and utilities
4.3
3.6
17.3
Hi-tech
5.4
0.1
1.1
Others
2.9
(4.6)
31.0
Source: Company, Angel Research
October 21, 2016
4
TCS | 2QFY2017 Result Update
Service line wise, Infrastructure Services reported a sequential growth of 2.1% on
CC basis. In the company’s anchor service line - IT Solutions and Services - ADM
grew 0.9% qoq on CC basis, and Enterprise Solutions and Assurance Services
grew by 2.0% qoq and 3.5% qoq on a CC basis. The BPO segment grew by 2.5%
qoq on a CC basis during the quarter. Asset Leveraged Solutions (2.6% of sales)
de-grew by 20.1% qoq on CC basis.
Exhibit 6: Revenue growth (Service wise on CC basis)
% to revenue
% chg (CC qoq)
% chg (yoy)
IT solutions and services
ADM
38.4
0.9
2.5
Enterprise solutions
17.8
2.0
8.6
Assurance services
9.0
3.5
11.9
Engg. and industrial services
4.8
1.1
16.1
Infrastructure services
15.7
2.1
13.7
Asset-leveraged solutions
2.6
(20.1)
(14.5)
BPO
11.7
2.5
10.3
Source: Company, Angel Research
Geography wise, growth in INR sales in key geographies was as follows: USA
(1.4% qoq on CC basis), Latin America (-0.2% qoq on CC basis), UK (-0.1% qoq
on CC basis), India (-7.6% qoq on CC basis), and MEA (2.2% qoq on CC basis).
The Continental Europe and Asia Pacific posted a growth of 3.7% qoq and 3.5% qoq
on CC basis, respectively.
Exhibit 7: Revenue growth (Geography wise in INR terms)
% of revenue
% chg (CC qoq)
% chg (yoy)
U.S.
54.0
1.4
7.9
Latin America
2.0
(0.2)
15.8
U.K.
13.8
(0.1)
7.4
Continental Europe
11.8
3.7
14.9
India
5.8
(7.6)
(4.5)
Asia Pacific
10.2
3.5
6.5
MEA
2.4
2.2
8.8
Source: Company, Angel Research
Attrition rate declines
In 2QFY2017, TCS witnessed a gross addition of 22,665 employees and net
addition of 9,440 employees, taking its total employee base to 3,71,519. During
the quarter, the attrition rate (last twelve month [LTM] basis) for the company
decreased to 12.9% from 13.6% in 1QFY2017.
Exhibit 8: Hiring and attrition trend
Particulars
2QFY16 3QFY16
4QFY16
1QFY17
2QFY17
Gross addition
25,186
22,118
22,576
17,792
22,665
Net addition
10,685
9,071
9,152
8,236
9,440
Total employee base
3,35,620
3,44,691
3,53,843
3,62,079
3,71,519
Attrition (%) - LTM basis
16.2
15.9
14.7
13.6
12.9
Source: Company, Angel Research
October 21, 2016
5
TCS | 2QFY2017 Result Update
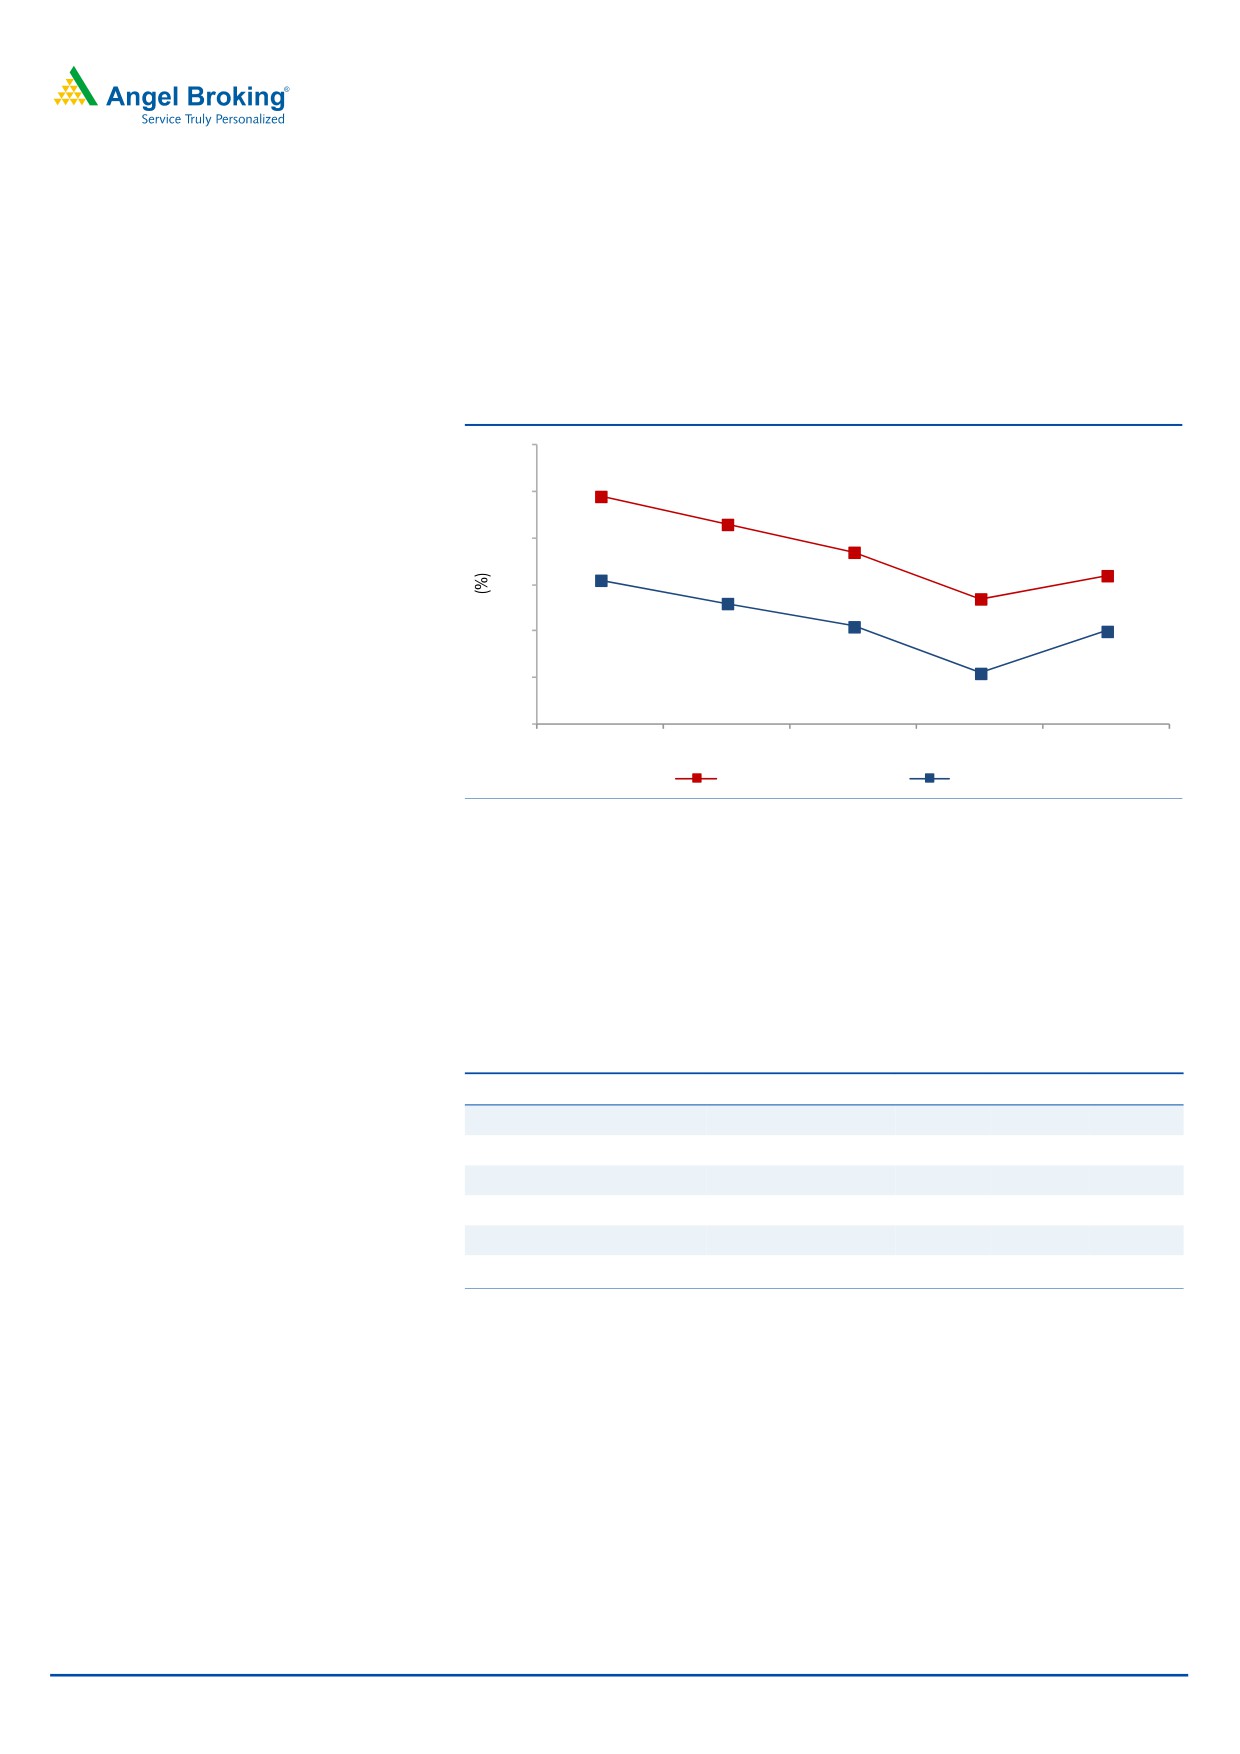
Margin expands
On the operating front, the EBITDA and EBIT margins came in at 27.2% and
26.0%, an expansion of
~50bp and ~90bp qoq respectively, better than
expected. The 130bp tailwind from operational efficiencies is more than the offset
40bp headwind from cross currency movements on EBIT margins.
Exhibit 9: Adj. Margin profile
30
28.9
29
28.3
27.7
28
27.2
26.7
27
27.1
26
26.6
26.1
26.0
25
25.1
24
2QFY16
3QFY16
4QFY16
1QFY17
2QFY17
EBITDA margin
EBIT margin
Source: Company, Angel Research
Client metrics
The client pyramid during the quarter witnessed a qualitative improvement with
client additions seen in higher revenue brackets. The clients in $50mn+ revenue
band increased by 2, in $20mn+ revenue band by 5 and in $5mn+ revenue
band by 13.
Exhibit 10: Client pyramid
2QFY16 3QFY16 4QFY16 1QFY17 2QFY17
US$1mn-5mn
415
425
400
408
410
US$5mn-10mn
130
132
131
141
154
US$10mn-20mn
103
108
125
119
110
US$20mn-50mn
106
108
100
102
107
US$50mn-100mn
32
31
36
40
42
US$100mn plus
33
34
37
37
36
Source: Company, Angel Research
October 21, 2016
6
TCS | 2QFY2017 Result Update
Investment Argument
Guidance - near term outlook uncertain: The management refrained from giving
any additional color on FY2017E revenue growth outlook. However, uncertainty on
back of the Brexit and its impact could impair growth in the near term, though the
Management expects ramp up in deal execution. We expect the company to post a
US$ revenue CAGR of 10.5% over FY2016-18E.
Growth fundamentals intact: In spite of the near term uncertainty arising out of
Brexit, TCS expects revenue growth to make a comeback after current cyclical
headwinds are behind. Long term drivers of tech spending will remain intact and
new growth areas are emerging like Big data and Analytics. Though the growth in
Digital segment weakened, the segmental revenue remained strong with 30% yoy
CC basis and will continue to drive business performance. In terms of verticals, the
softness in BFSI was expected. The weakness was more pronounced in UK than in
the US.
Outlook and valuation
Over FY2016-18E, we expect TCS’ revenue to post a CAGR of 10.5% in
USD and INR terms. The company highlighted that it stands comfortable of
sustaining the EBIT margin in the range of 26-28%. On the EBIT and PAT fronts,
we expect the company to post a 9.3% and 8.5% CAGR over FY2016-18E,
respectively. The stock is trading at 16.5x FY2018E EPS of `145.5. We reduce our
rating on the stock to accumulate from Buy, as we believe that the stock has
discounted the near term growth well.
Exhibit 11: Key assumptions
FY2017E
FY2018E
Revenue growth (USD)
9.0
11.0
USD-INR rate (realized)
66.0
66.0
Revenue growth (`)
9.6
12.0
EBITDA margin (%)
27.3
27.3
Tax rate (%)
23.5
23.5
EPS growth (%)
6.9
11.1
Source: Company, Angel Research
October 21, 2016
7
TCS | 2QFY2017 Result Update
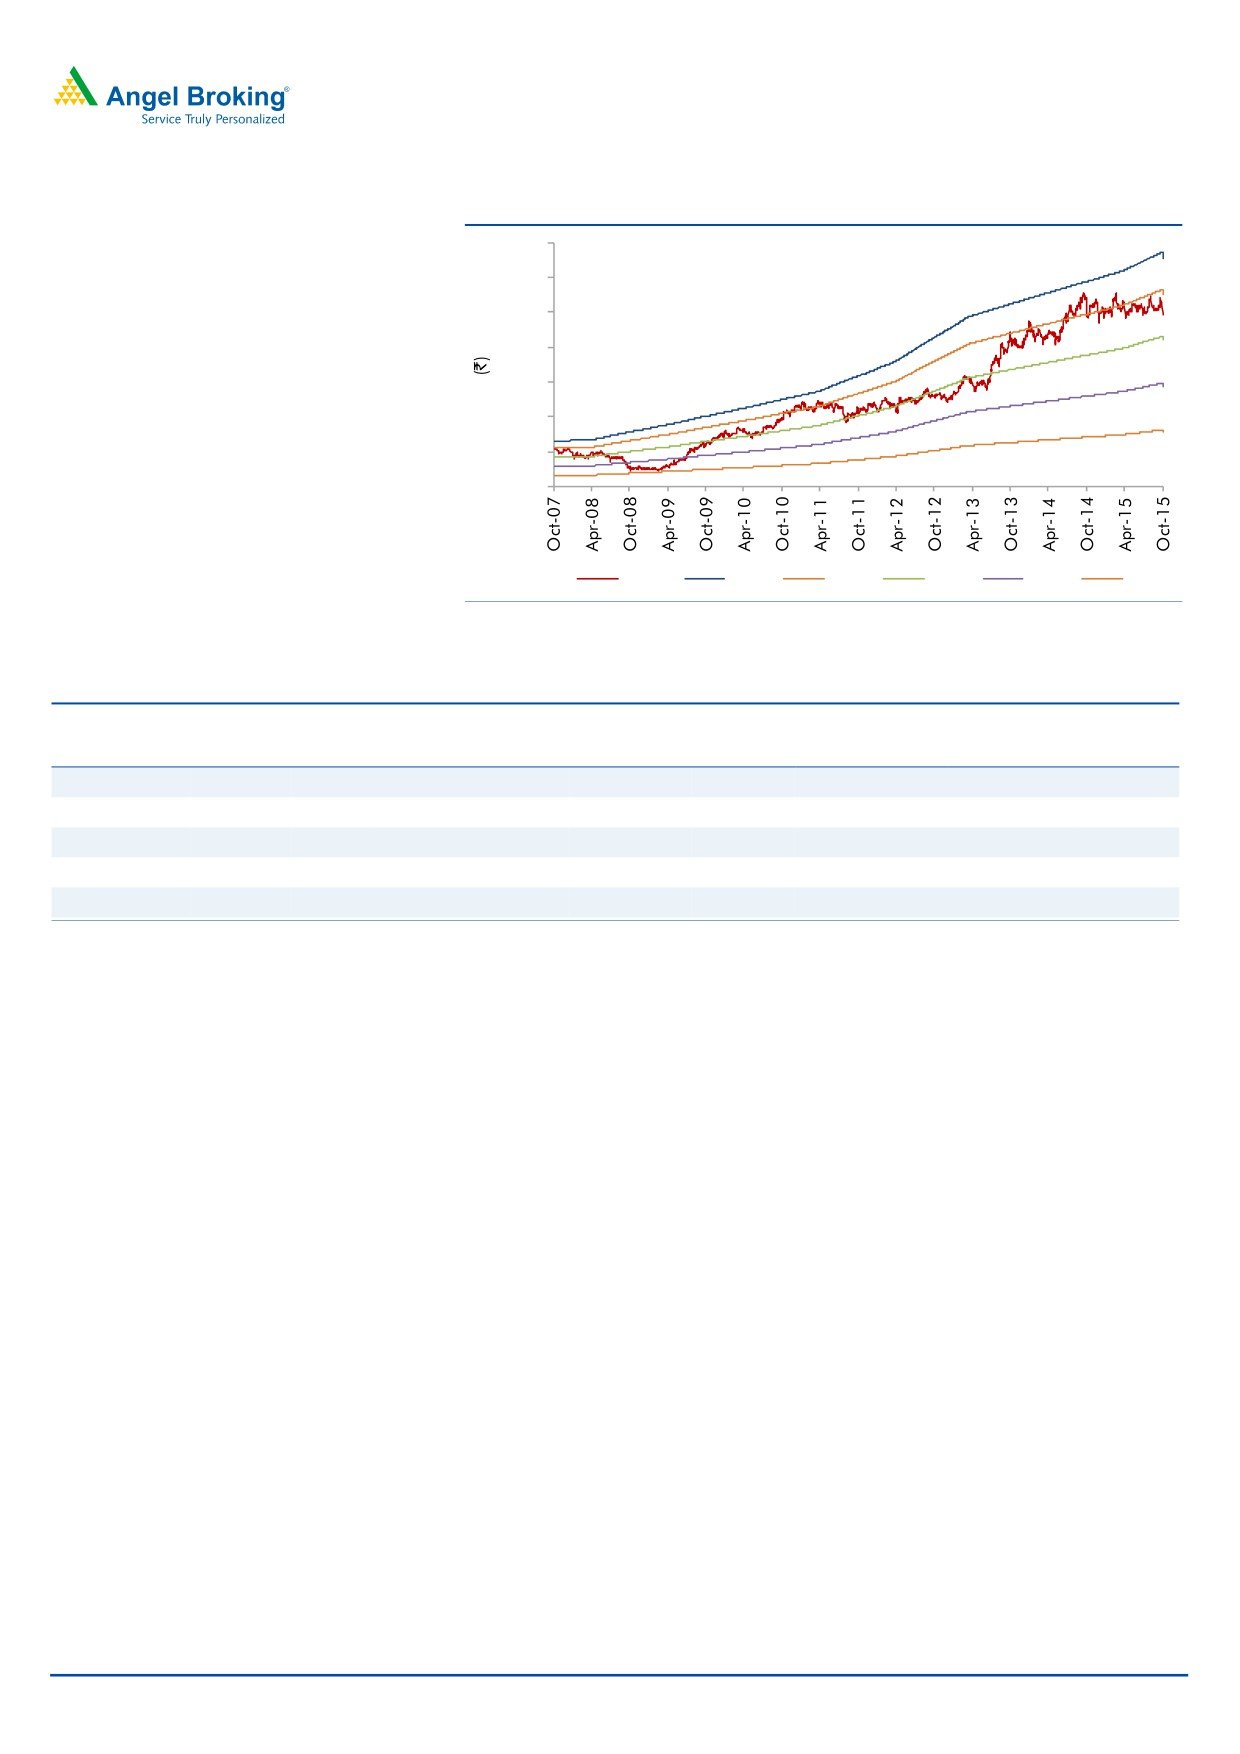
Exhibit 12: One-year forward PE chart
3,500
3,000
2,500
2,000
1,500
1,000
500
0
Price
25x
21x
16x
11x
6x
Source: Company, Angel Research
Exhibit 13: Recommendation summary
Company
Reco
CMP Tgt. price
Upside
FY2018E FY2018E
FY2016-18E
FY2018E FY2018E
(`)
(`)
(%)
EBITDA (%)
P/E (x)
EPS CAGR (%)
EV/Sales (x)
RoE (%)
HCL Tech
Buy
834
1,000
19.9
20.5
13.0
9.6
1.8
17.9
Infosys
Buy
1,038
1,249
20.3
27.0
15.0
8.4
2.5
21.6
TCS
Accumulate
2,398
2,620
9.3
27.6
16.5
8.5
3.2
33.1
Tech Mahindra
Buy
426
700
64.5
17.0
10.3
13.2
0.9
20.7
Wipro
Buy
481
680
41.3
17.9
13.0
1.3
1.7
18.1
Source: Company, Angel Research
October 21, 2016
8
TCS | 2QFY2017 Result Update
Company background
TCS is Asia's largest IT services provider and is amongst the top 10 technology
firms in the world. The company has a global footprint with an employee base of
over 3.0 lakh professionals, offering services to more than 1,000 clients across
various industry segments. The company has one of the widest portfolios of
services offerings, spanning across the entire IT service value chain - from
traditional application development and maintenance to consulting and package
implementation to products and platforms.
October 21, 2016
9
TCS | 2QFY2017 Result Update
Profit & Loss statement (Consolidated, IFRS)
Y/E March (` cr)
FY2014
FY2015
FY2016
FY2017E
FY2018E
Net sales
81,809
94,648
1,08,646
1,19,025
1,33,308
Cost of revenue
42,207
50,599
58,952
64,273
71,986
Gross profit
39,603
44,049
49,695
54,751
61,322
% of net sales
48.4
46.5
45.7
46.0
46.0
SGA expenses
14,471
17,353
18,956
21,901
24,529
% of net sales
17.7
18.3
17.4
18.4
18.4
EBITDA
25,132
26,696
30,738
32,851
36,793
% of net sales
30.7
28.2
28.3
27.6
27.6
Dep. and amortization
1324
1272
1948
2142
2400
% of net sales
1.6
1.3
1.8
1.8
1.8
EBIT
23,808
25,424
28,790
30,708
34,393
% of net sales
29.1
26.9
26.5
25.8
25.8
Other income, net
1589
3140
3050
3050
3050
Profit before tax
25,397
28,564
31,840
33,759
37,444
Provision for tax
6,071
6,083
7,503
7,933
8,799
% of PBT
23.9
21.3
23.6
23.5
23.5
PAT
19,326
22,481
24,338
25,825
28,644
Minority interest
209
205
123
141
161
Extra-ordinary (Exp.)/ Inc.
(2,627.9)
Reported PAT
19,117
19,648
24,215
25,685
28,483
Adj. PAT
19,117
21,696
24,215
25,685
28,483
Diluted EPS (`)
97.6
110.9
123.7
131.2
145.5
October 21, 2016
10
TCS | 2QFY2017 Result Update
Balance sheet (Consolidated, IFRS)
Y/E March (` cr)
FY2014 FY2015
FY2016
FY2017E
FY2018E
Assets
Cash and cash equivalents
1,469
1,862
1,862
1,862.2
1,862.2
Other current financial assets
18,107
16,383
4,833
24,974
30,729
Accounts receivable
18,230
20,440
24,073
27,071
31,694
Unbilled revenues
4,006
3,827
3,992
5,347
5,348
Other current assets
-
6,414
5,975
5,975
5,975
Property and equipment
10,364
11,572
11,790
12,790
13,790
Intangible assets and goodwill
4,157
3,931
3,946
3,946
3,946
Investments
3,449
9,619
22,822
22,822
22,822
Other non current assets
-
906
11,919
11,919
11,919
Total assets
68,913
74,954
91,212
1,16,707
1,28,085
Liabilities
Current liabilities
10,906
14,428
15,407
34,345
38,466
Short term borrowings
170
243
162
162
162
Redeemable preference shares
-
-
(0)
-
1
Long term debt
127
114
83
83
83
Other non current liabilities
1,684
1,778
2,017
2,282
2,556
Minority interest
691
914
354
495
656
Shareholders funds
55,335
57,477
73,190
79,341
86,163
Total liabilities
68,913
74,954
91,212
1,16,707
1,28,085
October 21, 2016
11
TCS | 2QFY2017 Result Update
Cash flow statement (Consolidated, IFRS)
Y/E March (` cr)
FY2014
FY2015
FY2016
FY2017E
FY2018E
Pre-tax profit from oper.
23,808
22,481
24,338
25,825
28,644
Depreciation
1,324
1,272
1,948
2,142
2,400
Exp. (deferred)/written off
209
160
174
-
-
Pre tax cash from oper
24,923
23,913
26,460
27,968
31,044
Other inc./prior period ad
1,589
1,272
1,948
2,142
2,400
Net cash from operations
26,512
25,185
28,408
30,110
33,443
Tax
6,071
6,083
7,503
7,933
8,799
Cash profits
20,441
19,102
20,905
22,177
24,644
(Inc)/dec in acc. recv.
(4,154)
(2,210)
(3,633)
(2,999)
(4,623)
(Inc)/dec in unbilled rev.
(846)
179
(165)
(1,355)
(1)
(Inc)/dec in oth. current asst.
(6,650)
(6,414)
439
-
-
Inc/(dec) in current liab.
2,223
(1,207)
(218)
(1,000)
(1,000)
Net trade working capital
(9,427)
(9,652)
(3,577)
(5,354)
(5,624)
Cash flow from opert. actv.
11,015
9,450
17,328
16,823
19,021
(Inc)/dec in fixed assets
(3,494)
(1,207)
(218)
(1,000)
(1,000)
(Inc)/dec in investments
(1,409)
(4,446)
(1,653)
(20,141)
(5,755)
(Inc)/dec in intangible asst.
(651)
(226)
16
-
-
(Inc)/dec in non-cur.asst.
(1,335)
(906)
(11,013)
-
-
Cash flow from invt. actv.
(6,889)
(6,786)
(12,869)
(21,141)
(6,755)
Inc/(dec) in debt
203
61
(113)
-
-
Inc/(dec) in equity
34
223
(559)
141
161
Inc/(dec) in minority int.
(14,666)
(19,923)
(18,415)
(19,533)
(21,661)
Dividends
10,303
16,976
14,629
23,711
9,234
Cash flow from finan. actv.
(4,126)
(2,664)
(4,459)
4,318
(12,266)
Cash generated/(utilized)
(374)
393
-
-
-
Cash at start of the year
1,843
1,469
1,862
1,862
1,862
Cash at end of the year
1,469
1,862
1,862
1,862
1,862
October 21, 2016
12
TCS | 2QFY2017 Result Update
Key ratios
Y/E March
FY2014
FY2015
FY2016
FY2017E
FY2018E
Valuation ratio(x)
P/E (on FDEPS)
24.6
21.6
19.4
18.3
16.5
P/CEPS
23.0
22.5
18.0
16.9
15.2
P/BVPS
8.5
8.2
6.4
5.9
5.4
Dividend yield (%)
1.3
1.8
1.7
1.8
2.0
EV/Sales
5.7
4.9
4.2
3.7
3.2
EV/EBITDA
18.5
17.3
14.9
13.4
11.8
EV/Total assets
6.8
6.1
5.0
3.8
3.4
Per share data (`)
EPS
97.6
110.9
123.7
131.2
145.5
Cash EPS
104.4
106.8
133.6
142.1
157.7
Dividend
32.0
43.5
40.2
42.6
47.3
Book value
283
294
374
405
440
Dupont analysis
Tax retention ratio (PAT/PBT)
0.8
0.8
0.8
0.8
0.8
Cost of debt (PBT/EBIT)
1.1
1.1
1.1
1.1
1.1
EBIT margin (EBIT/Sales)
0.3
0.3
0.3
0.3
0.3
Asset turnover ratio (Sales/Assets)
1.2
1.3
1.2
1.0
1.0
Leverage ratio (Assets/Equity)
1.2
1.3
1.2
1.5
1.5
Operating ROE
34.9
39.1
33.3
32.5
33.2
Return ratios (%)
RoCE (pre-tax)
34.5
33.9
31.6
26.3
26.9
Angel RoIC
51.9
54.0
46.7
45.8
47.3
RoE
34.5
34.2
33.1
32.4
33.1
Turnover ratios(x)
Asset turnover (fixed assets)
7.9
8.2
9.2
9.3
9.7
Receivables days
81
79
81
83
87
October 21, 2016
13
TCS | 2QFY2017 Result Update
Research Team Tel: 022 - 39357800
DISCLAIMER
Angel Broking Private Limited (hereinafter referred to as “Angel”) is a registered Member of National Stock Exchange of India Limited,
Bombay Stock Exchange Limited and Metropolitan Stock Exchange Limited. It is also registered as a Depository Participant with CDSL
and Portfolio Manager with SEBI. It also has registration with AMFI as a Mutual Fund Distributor. Angel Broking Private Limited is a
registered entity with SEBI for Research Analyst in terms of SEBI (Research Analyst) Regulations, 2014 vide registration number
INH000000164. Angel or its associates has not been debarred/ suspended by SEBI or any other regulatory authority for accessing
/dealing in securities Market. Angel or its associates/analyst has not received any compensation / managed or co-managed public
offering of securities of the company covered by Analyst during the past twelve months.
This document is solely for the personal information of the recipient, and must not be singularly used as the basis of any investment
decision. Nothing in this document should be construed as investment or financial advice. Each recipient of this document should
make such investigations as they deem necessary to arrive at an independent evaluation of an investment in the securities of the
companies referred to in this document (including the merits and risks involved), and should consult their own advisors to determine
the merits and risks of such an investment.
Reports based on technical and derivative analysis center on studying charts of a stock's price movement, outstanding positions and
trading volume, as opposed to focusing on a company's fundamentals and, as such, may not match with a report on a company's
fundamentals. Investors are advised to refer the Fundamental and Technical Research Reports available on our website to evaluate the
contrary view, if any.
The information in this document has been printed on the basis of publicly available information, internal data and other reliable
sources believed to be true, but we do not represent that it is accurate or complete and it should not be relied on as such, as this
document is for general guidance only. Angel Broking Pvt. Limited or any of its affiliates/ group companies shall not be in any way
responsible for any loss or damage that may arise to any person from any inadvertent error in the information contained in this report.
Angel Broking Pvt. Limited has not independently verified all the information contained within this document. Accordingly, we cannot
testify, nor make any representation or warranty, express or implied, to the accuracy, contents or data contained within this document.
While Angel Broking Pvt. Limited endeavors to update on a reasonable basis the information discussed in this material, there may be
regulatory, compliance, or other reasons that prevent us from doing so.
This document is being supplied to you solely for your information, and its contents, information or data may not be reproduced,
redistributed or passed on, directly or indirectly.
Neither Angel Broking Pvt. Limited, nor its directors, employees or affiliates shall be liable for any loss or damage that may arise from
or in connection with the use of this information.
Disclosure of Interest Statement
TCS
1. Financial interest of research analyst or Angel or his Associate or his relative
No
2. Ownership of 1% or more of the stock by research analyst or Angel or associates or relatives
No
3. Served as an officer, director or employee of the company covered under Research
No
4. Broking relationship with company covered under Research
No
Ratings (Based on expected returns
Buy (> 15%)
Accumulate (5% to 15%)
Neutral (-5 to 5%)
over 12 months investment period):
Reduce (-5% to -15%)
Sell (< -15)
October 21, 2016
14