2QFY2016 Result Update | Cons. Durable
November 7, 2015
Surya Roshni
BUY
CMP
`127
Performance Highlights
Target Price
`183
Y/E March (` cr)
2QFY16 2QFY16
% chg (yoy) 2QFY16
% chg (qoq)
Investment Period
12 Months
Net Sales
722
692
4.3
731
(1.3)
EBITDA
57
57
(0.3)
56
1.3
Stock Info
EBITDA margin (%)
7.8
8.2
(36)bp
7.6
20bp
Sector
Con. Durable
PAT
13
12
3.7
12
8.1
Market Cap (` cr)
556
Source: Company, Angel Research
Beta
1.8
Surya Roshni (SRL) reported a decent set of numbers for 2QFY2016. Its top-line grew by
52 Week High / Low
89 / 163
4.3% yoy to `722cr led by a superb performance by the Lighting division. The EBITDA
Avg. Daily Volume
1,22,534
margin witnessed a slight decline of 36bp yoy to 7.8% on account of higher employee and
other expenses. However, the same was mostly made up by a 244bp yoy decline in raw
Face Value (`)
10.00
material cost to 70.3% of sales. The interest cost declined by 16.3% yoy to `24cr and as a
BSE Sensex
26,265
result, the net profit grew by 3.7% yoy to `13cr vis-à-vis our estimate of `17cr.
Nifty
7,954
Structural shift in the Lighting industry presents new growth opportunity: We expect SRL to
Reuters Code
SURR.BO
benefit from the structural shift in the lighting industry towards LED lighting, which is
Bloomberg Code
SYR@IN
expected to grow at a CAGR of 28% over FY2015E-21E. SRL is the second largest lighting
company in India with a market share of ~ 25%. With demand for LEDs expected to rise,
Shareholding Pattern (%)
the company would be a key beneficiary, given that the company’s ”Surya” brand is well
recognized and has superior market reach with its 2 lakh plus retailers.
Promoters
63.3
MF / Banks / Indian Fls
0.1
Higher contribution from Lighting division to boost margins: SRL’s Steel Pipes business,
FII / NRIs / OCBs
0.1
entails low profitability and has higher debt, thus having resulted in high overall debt/equity
Indian Public / Others
36.5
for the company. The Lighting business’ contribution to the overall top-line of the company
has increased from 30% in FY2012 to 40% in FY2015. The Lighting business commands
higher margins (10.7%) vs the steel business (2.9%) and contributes by 70% to the
Abs. (%)
3m 1yr
3yr
company’s overall profitability. We expect the Lighting business’ contribution to rise on
account of growth coming in from LEDs, thus enhancing overall profitability. Additionally,
Sensex
(7.2)
(5.8)
39.6
with healthy cash flow generated from the Lighting business and lower interest rate scenario
Surya Roshni
(19.0)
31.8
85.1
prevailing, we expect the company to slowly reduce its debt.
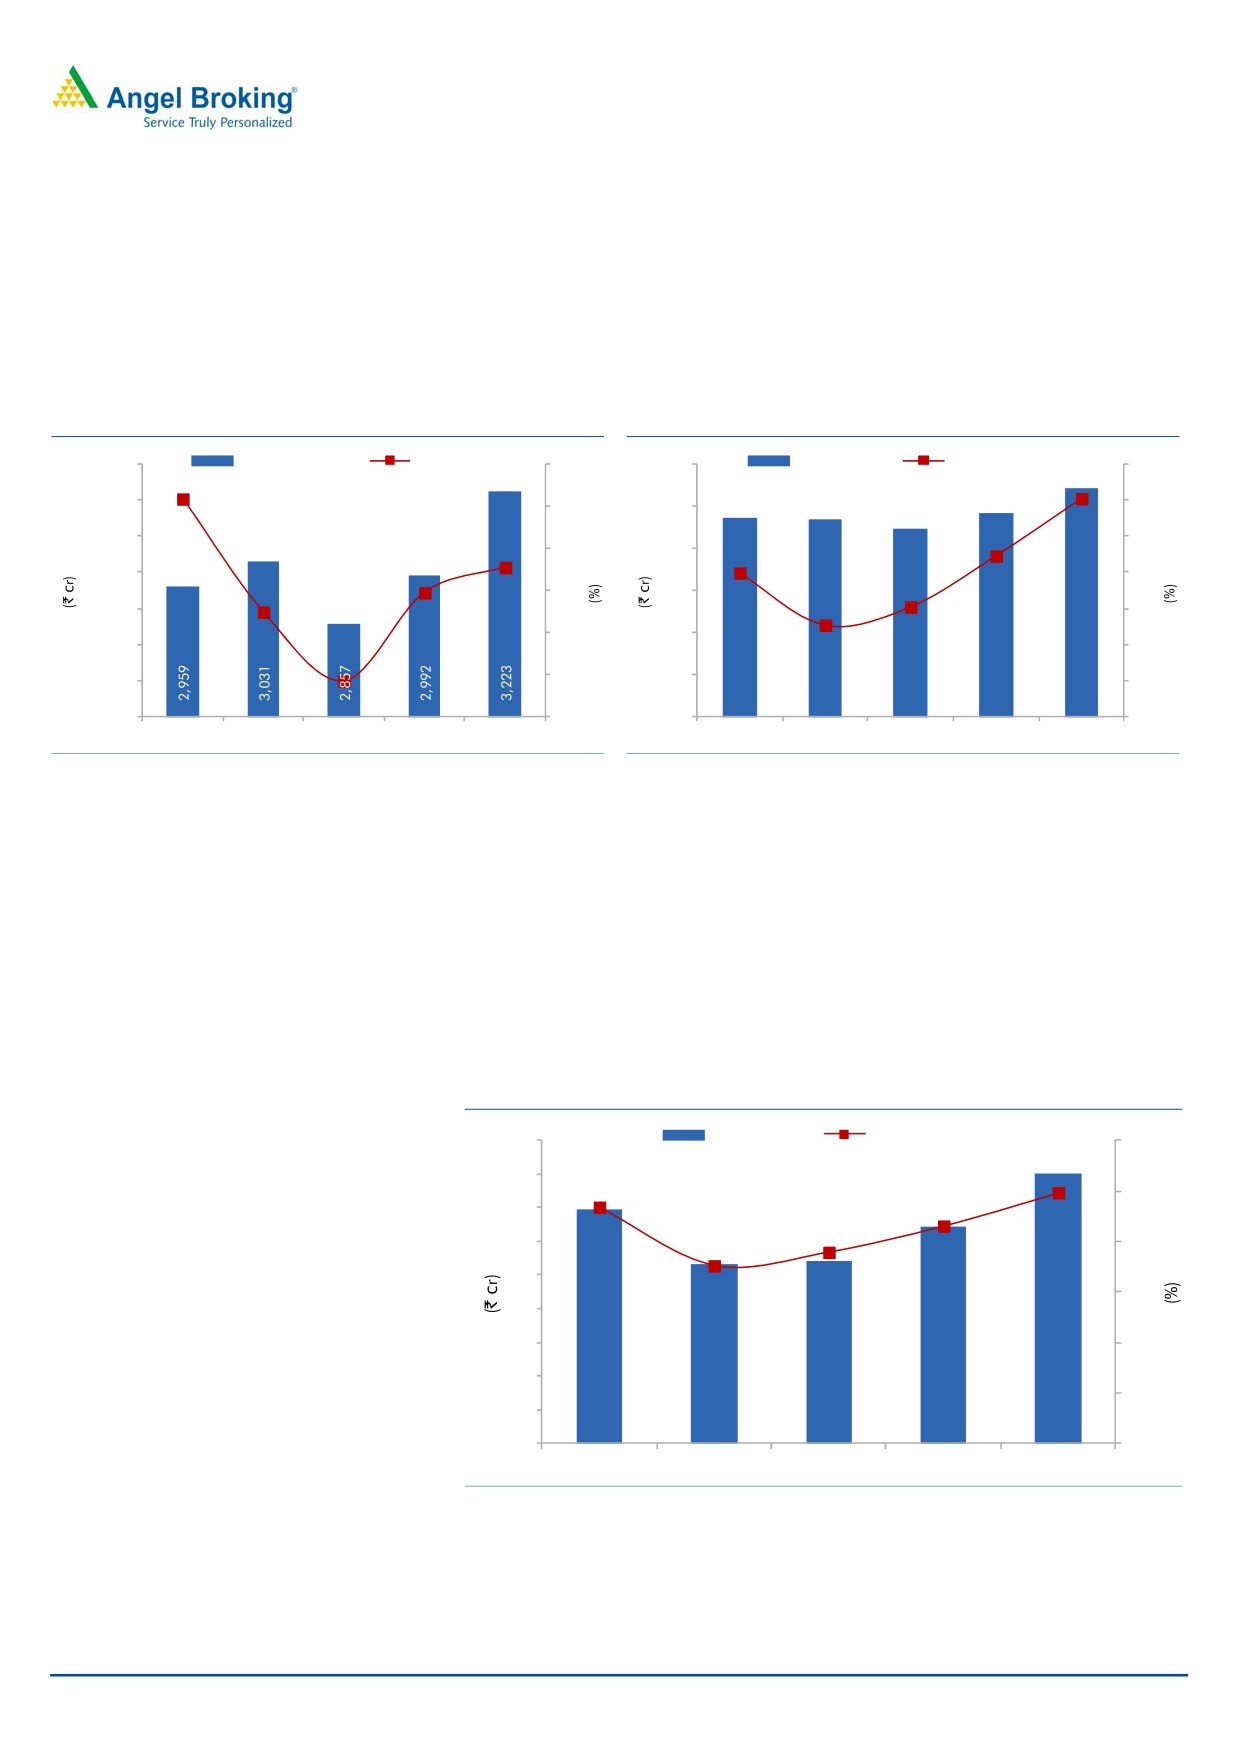
Outlook and Valuation: With higher contribution from the Lighting business and entry into
3 Year Price Chart
newer businesses, we expect the company to post a top-line CAGR of 6.2% over FY2015E-
180
17E to `3,223cr. The EBITDA margin is estimated to improve from 7.8% in FY2015 to 8.4% in
160
FY2017. Consequently, the net profit is expected to post a CAGR of 21.6% over FY2015E-17 to
140
120
`80cr. At the current market price, the stock is trading at a cheap valuation of 6.9x its
100
FY2017E earnings. We maintain our Buy rating on the company with a target price of
80
`183, based on a target PE of 10.0x for FY2017E.
60
40
Financials
20
Y/E March (` cr)
FY2013
FY2014
FY2015
FY2016E
FY2017E
0
Net Sales
2,959
3,031
2,857
2,992
3,223
% chg
15.8
2.4
(5.7)
4.7
7.7
Adj. Net Profit
69
53
54
64
80
% chg
33.2
(22.9)
1.4
19.1
24.2
OPM (%)
8.0
7.7
7.8
8.1
8.4
EPS (Rs)
15.8
12.2
12.3
14.7
18.3
P/E (x)
8.0
10.4
10.3
8.6
6.9
P/BV (x)
1.0
0.9
0.9
0.8
0.7
RoE (%)
13.3
9.4
8.8
9.7
11.0
RoCE (%)
11.1
10.1
9.0
9.8
11.0
Milan Desai
EV/Sales (x)
0.5
0.5
0.5
0.5
0.4
022 4000 3600 ext- 6846
EV/EBITDA (x)
5.7
6.5
6.4
5.7
5.1
Source: Company, Angel Research
Please refer to important disclosures at the end of this report
1
Surya Roshni | 2QFY2016 Result Update
Exhibit 1: 2QFY2016 Performance highlights
Y/E March (` cr)
2QFY16
2QFY15
yoy chg (%)
1QFY16
qoq chg (%)
1HFY16
1HFY15
% chg
Net Sales
722
692
4.3
731
(1.3)
1,453
1,364
6.5
Net raw material
508
503
0.8
529
(4.0)
1,036
994
4.2
(% of Sales)
70.3
72.8
(244)bp
72.3
(196)bp
71.3
72.9
(160)bp
Staff Costs
45
38
19.4
44
1.7
89
76
17.3
(% of Sales)
6.2
5.5
79bp
6.1
18bp
6.2
5.6
56bp
Other Expenses
112
94
19.9
102
9.8
215
181
18.9
(% of Sales)
15.6
13.6
202bp
14.0
157bp
14.8
13.3
154bp
Total Expenditure
665
635
4.8
675
(1.5)
1,341
1,251
7.1
Operating Profit
57
57
(0.3)
56
1.3
112
112
(0.0)
OPM
7.8
8.2
(36)bp
7.6
20bp
7.7
8.2
(51)bp
Interest
24
29
(16.3)
25
(2.2)
49
58
(15.3)
Depreciation
15.37
13.97
10.0
15
3.0
30
28
9.6
Other Income
0.3
0.5
(47.2)
0.2
40.0
0
1
(34.2)
PBT
17
14
20.3
16
5.7
34
28
21.4
(% of Sales)
2.4
2.1
2.2
2.3
2.0
Tax
5
2
5
9
4
(% of PBT)
26
14
28
27
15
Reported PAT
13
12
3.7
12
8.1
25
24
4.4
PATM
1.8
1.8
1.6
1.7
1.7
(3)bp
Source: Company, Angel Research
Exhibit 2: Actual vs. Angel estimate (2QFY2016)
(` cr)
Actual (` cr)
Estimate (` cr)
% variation
Total Income
722
734
(1.6)
EBIDTA
57
61
(6.7)
EBIDTA margin
7.8
8.3
(42)bp
Adj. PAT
13
17
(25.3)
Source: Company, Angel Research
Numbers broadly in-line with estimates
For 2QFY2016, SRL posted a decent set of numbers. The top-line grew by 4.3%
yoy to `722cr led by a superb performance by the Lighting division. The top-line
was marginally below our estimate of `734cr. The EBITDA margin witnessed a
slight decline of 36bp yoy to 7.8% (against our estimate of 8.3%) on account of
higher employee and other expenses. However, the same was mostly made up by
a 244bp yoy decline in raw material cost to 70.3% of sales. The company had
incurred a higher advertisement spent in 1QFY2016 as it roped in celebrities to
promote its Lighting business which could have resulted in higher other expenses
during 2QFY2016. The company has reduced its debt in the half year (1HFY2016)
and as a result, the interest cost for the quarter declined by 16.3% yoy to `24cr.
Aided by lower interest outgo, the net profit grew by 3.7% yoy to `13cr vis-à-vis
our estimate of `17cr.
November 7, 2015
2
Surya Roshni | 2QFY2016 Result Update
Segment-wise performance
Exhibit 3: Segment-wise performance
Y/E March (` cr)
2QFY16
2QFY16
% chg (yoy) 2QFY16
% chg (qoq)
Total Revenue
A) Steel Products
414
457
(9.2)
466
(11.1)
B) Lighting Poducts
355
286
24.1
318
11.7
Total
770
743
3.6
784
(1.8)
Excise Duty
(48)
(51)
(53)
Net Sales
722
692
4.3
731
(1.3)
Segmental Profit
A) Steel Products
9
13
(30.0)
10
(9.5)
B) Lighting Poducts
32
30
7.0
31
4.4
Segmental Margin (%)
A) Steel Products
2.2
2.9
(66)bp
2.2
4bp
B) Lighting Poducts
9.1
10.5
(145)bp
9.7
(64)bp
Source: Company, Angel Research
Steel products: The Steel business’ top-line declined by 9.2% yoy to `414cr.
The volume for the company grew by 9.0% yoy but the lower steel prices dragged
down the realizations by ~17.0%. The segment’s profits declined by 30.0% yoy to
`9cr and the margin declined by 66bp yoy to 2.2% on account of inventory loss.
The company has recently started manufacturing square and rectangular section
(hollow) pipes which are used for civil structures, furniture, transmission towers, etc.
The response has been favorable and is expected to add to the Steel business’
turnover in the future.
Lighting products: The Lighting business posted a robust growth of 24.1% yoy
to `355cr, but the segment’s margin declined by 145bp yoy to 9.1%. The
segment’s profitability increased by 7.0% yoy to `32cr. The decline in margin is
owing to the company increasing its advertisement spend since 4QFY2015 to
promote its newly launched products. As a result, profitability too was impacted.
November 7, 2015
3
Surya Roshni | 2QFY2016 Result Update
Investment Arguments
Structural shift in the industry presents growth opportunity.
In line with the industry trend, the company has added a wide range of LED
products to its offerings. There is an ongoing change in preference towards LED
lighting over CFL and GLS bulbs, owing to the former’s cost effective nature.
Industry reports suggest that LEDs will soon replace GLS and CFL and this will be
due to measures taken by the government like changing all street lights and lights
in public spaces to LED lights, making all LED specifications mandatory, and
providing free LED lamps instead of CFL bulbs to below poverty line (BPL) families.
In our opinion, switchover to LED lighting for street and public lighting provides
significant opportunity to the companies in the segment.
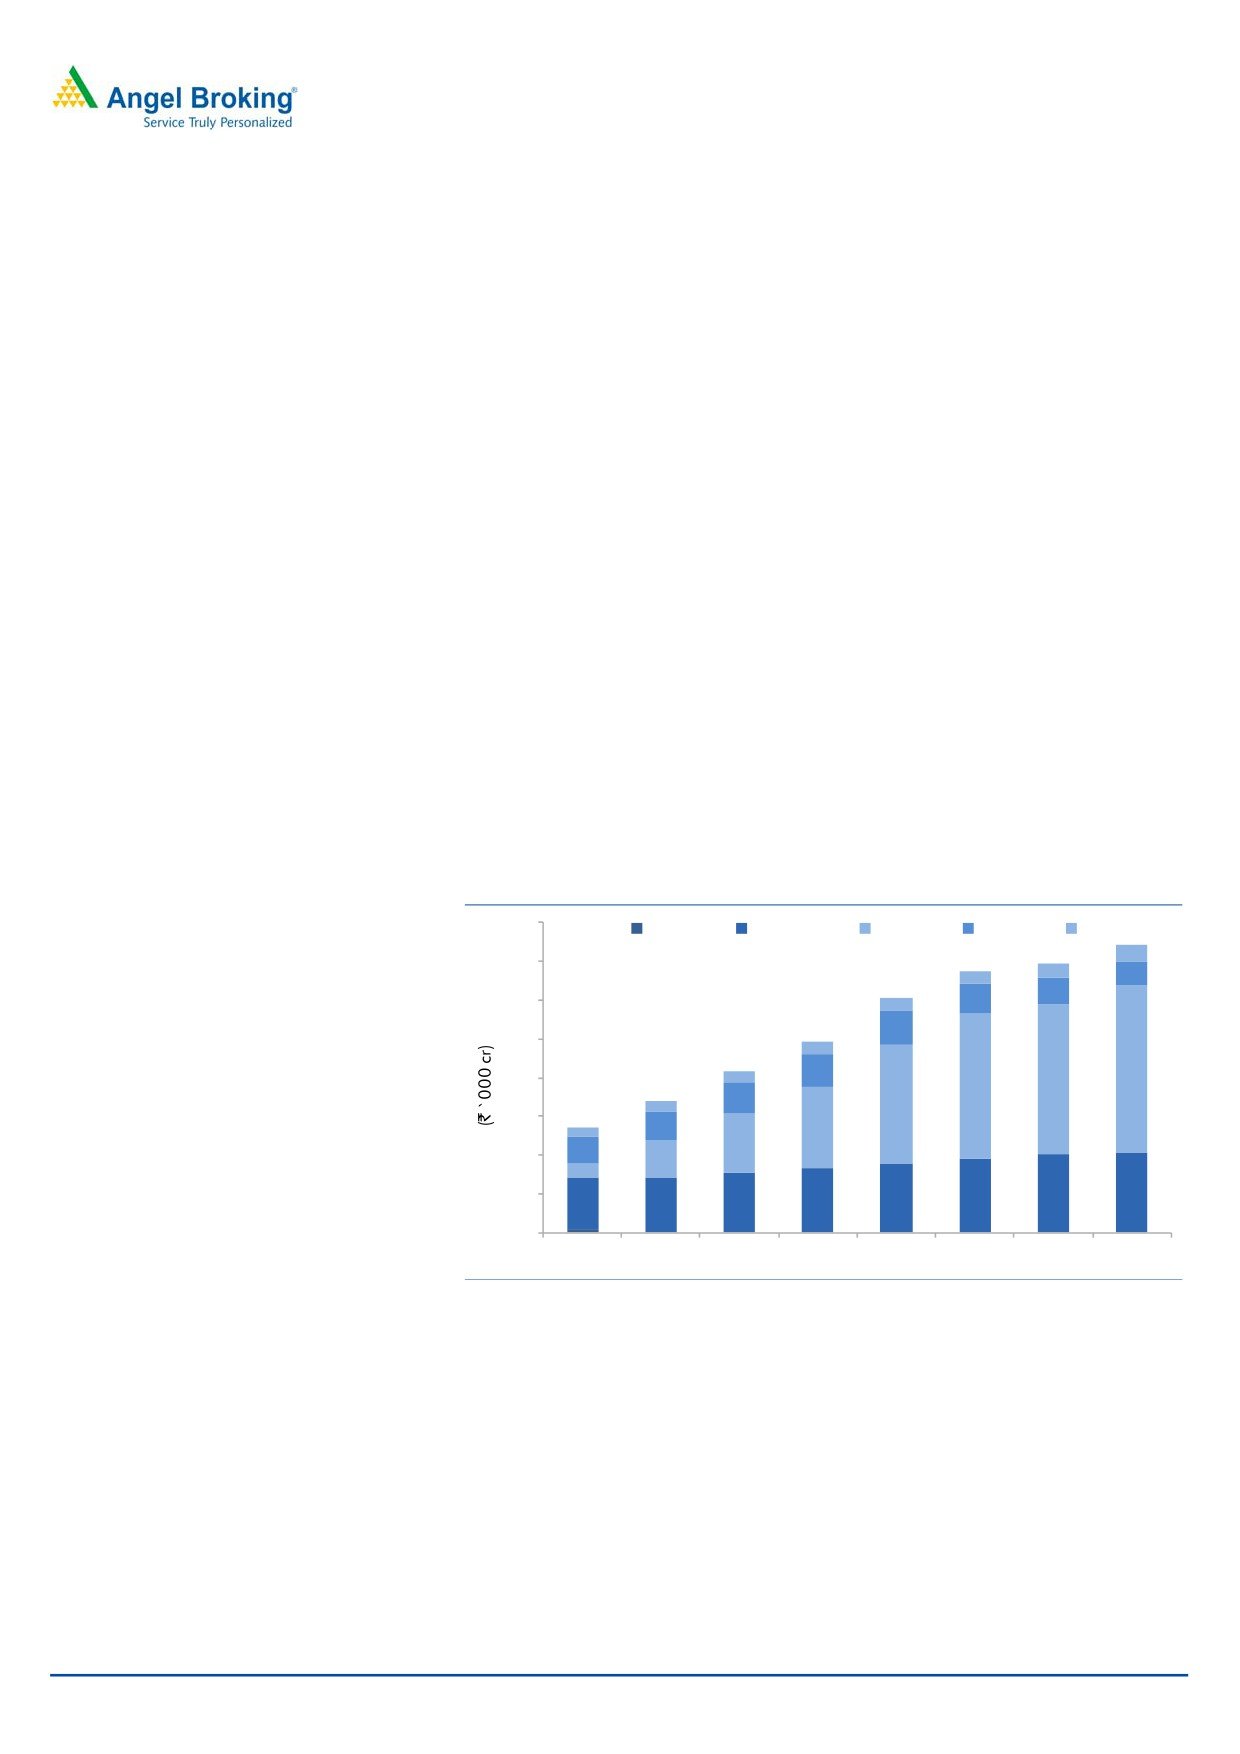
Citing this structural shift, ELCOMA expects the market size of LED to touch
~`10,500cr by FY2017E and reach
~`21,630cr by FY2021. As per the
projections, LEDs are expected to account for ~58% of the total lighting industry by
FY2021. Currently, LED revenues of SRL for FY2015 are estimated to be at
~`100cr. In the current financial year, the company has been awarded orders
worth `100cr to supply LED bulbs, street lights and other lighting products from
EESL and other PSUs. The Management expects LEDs to contribute ~30% to the
company’s Lighting business’ turnover in the next two to three years, while
targeting revenue of ~`500cr from the segment.
Exhibit 4: LEDs’ contribution to increase significantly
40
GLS
Others
LED
CFL
FTL
35
30
25
22
20
19
19
15
15
10
8
10
5
2
5
-
FY14
FY15
FY16
FY17
FY18
FY19
FY20
FY21
Source: ELCOMA, Angel Research
Strong position in the lighting industry
The Indian lighting industry has displayed strong growth over the years, posting a
CAGR of 18.6% over FY2011-14 to reach `13,500cr. The growth has been largely
driven by shift from GLS lamps to CFLs and the next round of growth is expected to
come from the LED segment. Tracing this, the Indian lighting industry is expected
to grow at a CAGR of 22.8% over FY2014-17E to `25,000cr and reach the
`37,000cr mark by FY2021.
This positive outlook on the lighting industry augurs well for SRL as it is the second
largest lighting company in India. In the domestic lighting segment, Surya is a
November 7, 2015
4
Surya Roshni | 2QFY2016 Result Update
prominent brand in the consumer market and it has a market share in excess of
25%. It has a network of 2 lakh retailers across the country. The company has
maintained its brand identity over the years and has also doubled its advertisement
spend in the past year to assist its dealer network.
It has a state-of-the-art research and development centre in Noida which assists in
launching efficient products for the markets. Additionally, the company has
decided to venture into the business of solar power based lighting systems for rural
and urban use which will be an additional revenue source for the company.
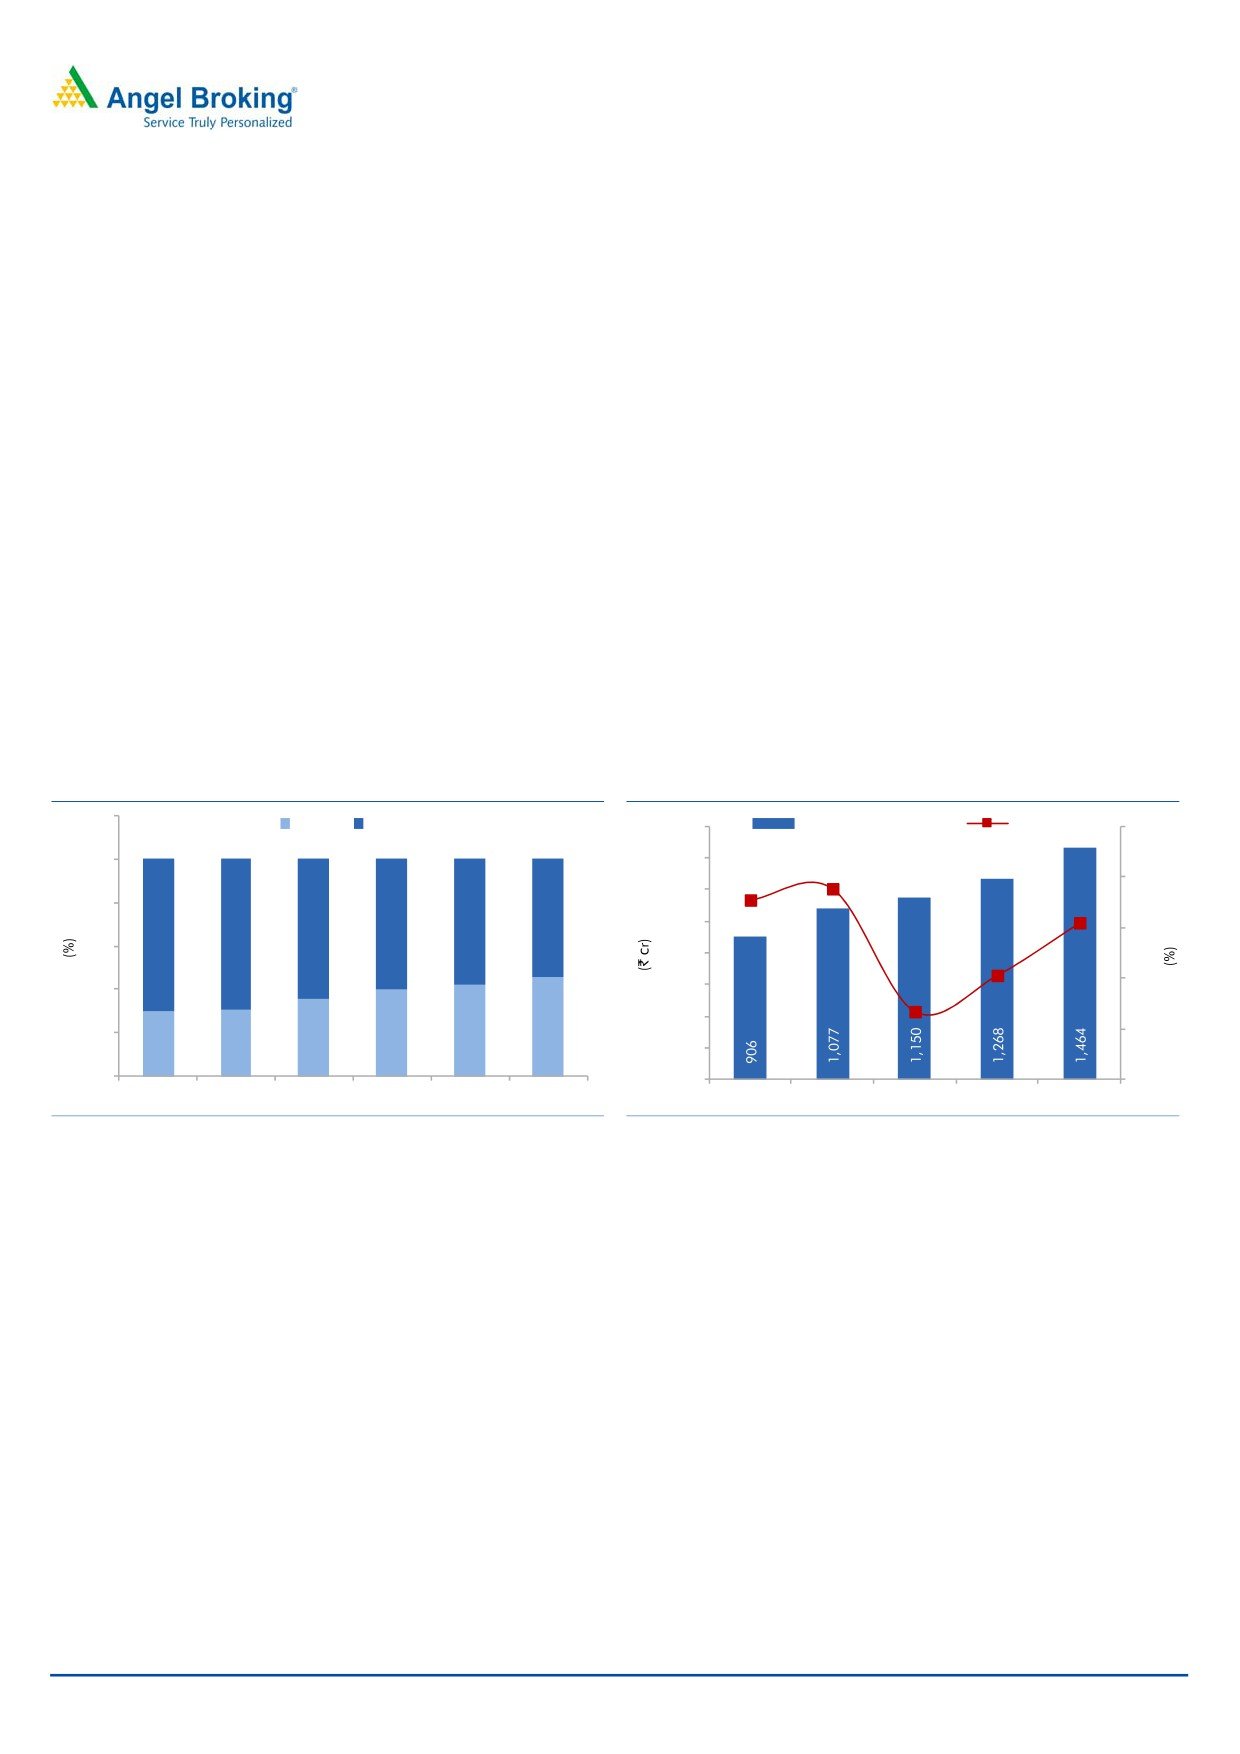
Higher contribution from the Lighting division to boost profitability
Historically, the company’s Steel division has been a major contributor to the
overall revenues vis-à-vis its Lighting division. In the past, the contribution has
been 70%-30% in favor of the Steel division. As for profitability, the Lighting
business has a better margin profile than the Steel business. A look at the recent
performance suggests that the trend seems to be changing, especially since
FY2014, where the Lighting business accounted for 35.5% of overall sales vs
30.6% in FY2013. This share further climbed up to 40.2% in FY2015 and we
expect it to reach the level of 45% by FY2017.
Exhibit 5: Lighting business’ contribution to improve
Exhibit 6: Lighting business Revenue Trend
120
Lighting
Steel
1,600
Lighting Revenue (LHS)
Growth (RHS)
25.0
1,400
100
20.0
1,200
18.8
80
17.7
55
1,000
64
60
58
15.0
70
69
15.5
60
800
10.0
40
600
10.3
6.7
400
45
5.0
20
36
40
42
30
31
200
-
-
-
FY2012
FY2013
FY2014
FY2015E FY2016E FY2017E
FY2013
FY2014
FY2015E
FY2016E
FY2017E
Source: Company, Angel Research
Source: Company, Angel Research
SRL is the only lighting company with 100% backward integration, which benefits
the company in terms of availability of best quality raw materials at effectively
lower costs. We expect increase in contribution from the Lighting division, driven by
shift towards LEDs, to boost the overall profitability of the company.
Lower interest cost to add to bottom-line
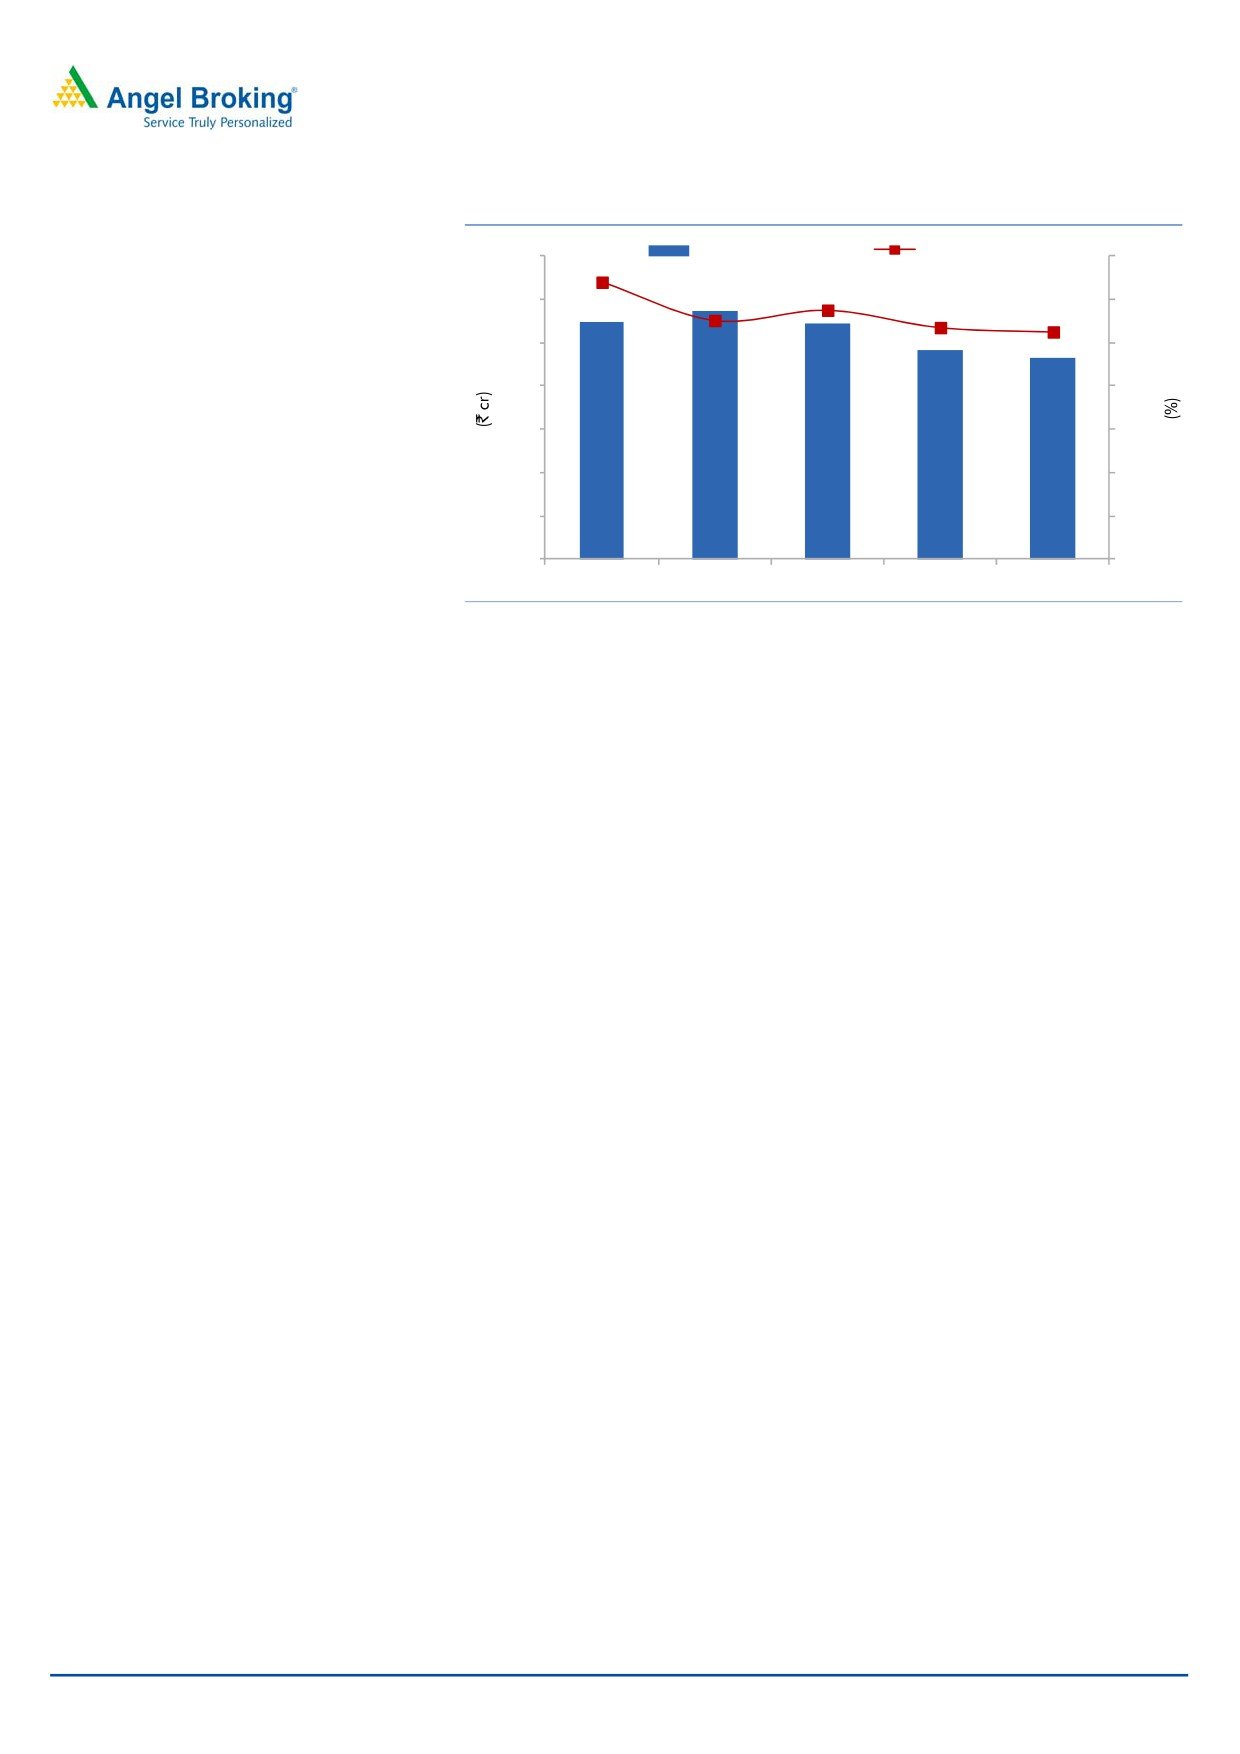
The declining interest rate scenario is likely to benefit leveraged companies like
SRL. The Reserve Bank of India (RBI), since the beginning of the current financial
year, has reduced interest rates by 75bp. With interest rates expected to reduce
further, SRL’s interest expense will be lower and we expect the company to use its
healthy cash flows from the Lighting business to slowly reduce its debt. The
company has reduced its debt in the last year and followed on with debt reduction
of ~`65cr in 1HFY2016.
November 7, 2015
5
Surya Roshni | 2QFY2016 Result Update
Exhibit 7: Decline in interest cost
Interest Expense (LHS)
% of Debt (RHS)
140
14.0
12.8
120
11.0
12.0
11.5
10.7
100
10.5
10.0
80
8.0
60
6.0
40
4.0
20
2.0
110
114
109
96
93
-
-
FY2013
FY2014
FY2015E
FY2016E
FY2017E
Source: Company, Angel Research
Fans business receiving good response; Company forays into
Appliances business
In January 2014, the company entered the `5,000cr Indian fan industry by
launching its ‘Surya’ brand of fans which has received a favorable response. With
an assist from its strong retail network, the company was able to clock revenues of
~`60cr (FY2015) in a relatively shorter period of time. Encouraged by the
impressive response to its Fans business, the company has recently forayed into the
Home Appliances business in the Indian market. The range of product offerings
includes water heaters/room heaters, dry irons, steam irons and mixer-grinders.
The Management expects to achieve `200cr of sales from the Fans business by
FY2016 and further targets to reach the `500cr mark in a span of three-four
years. As for Home Appliance, the Management expects to garner revenue of
`200cr from this segment by FY2017E.
Steel business to remain under pressure
Although the Steel business’ share in overall revenues of the company has been
declining in recent times, it is still a major part of the company’s operations. It is a
leader in the steel tube industry in India with products for infra, oil & gas, and
construction sectors. Apart from the standalone business, the company has
investment in Surya Global Steel Tubes Ltd (SGSTL), holding 49.99% stake in it.
SGSTL is into manufacturing of ERW and spiral pipes at its plant in Bhuj (Gujarat),
mainly catering towards exports (75%). Owing to declining steel prices, the
performance of the segment has been negatively impacted. In the near term, we
expect the performance of the division to just be stable and not be impressive
owing to lower steel prices (hurting realizations) and lower oil prices, which has
dampened demand from the oil exploration side. However, in the long run, the
division should post better results once the demand from oil and gas, infra and
other sectors begins to pick up. Further, the government’s vision to build 100 smart
cities will have a favorable impact on the steel pipe business, in the longer term
time horizon.
November 7, 2015
6
Surya Roshni | 2QFY2016 Result Update
Financials
With surging contribution of the Lighting business (on the back of shift from CFL to
LED), we expect the company’s revenue to improve from `2,857cr in FY2015E to
`3,223cr in FY2017E. We also expect the Fans business’ contribution to improve
and expect the Appliances business to benefit from the brand pull and pan India
retail network of the company, much like the Fans business.
Exhibit 8: Revenue trend
Exhibit 9: EBITDA Margins to improve
3,300
Revenue (LHS)
Growth (RHS)
20.0
300
EBITDA (LHS)
EBITDA Margins (RHS)
8.6
3,200
15.8
8.4
15.0
250
8.4
3,100
8.2
10.0
200
3,000
7.7
8.0
8.1
8.0
5.0
150
2,900
4.7
7.8
7.8
2.4
7.7
-
100
2,800
7.6
(5.7)
(5.0)
50
2,700
7.4
237
234
223
242
271
2,600
(10.0)
0
7.2
FY2013
FY2014
FY2015E FY2016E FY2017E
FY2013
FY2014
FY2015E
FY2016E
FY2017E
Source: Company, Angel Research
Source: Company, Angel Research
Higher contribution from Lighting to maintain EBITDA margins
Owing to higher contribution from the Lighting business, the EBITDA margins for
the company are expected to improve from 7.8% in FY2015 to 8.4% in FY2017
despite of declining profitability of the Steel business. The declining interest rate
environment will have a positive impact on leveraged companies like SRL. We
expect interest expense to decline from `109cr in FY2015 to `93cr in FY2017.
With the above estimates we believe that the company’s net profit should improve
from `54cr in FY2015 to `80cr in FY2017.
Exhibit 10: PAT trajectory
PAT (LHS)
PAT Margins (RHS)
90
3.0
80
2.3
2.5
2.5
70
1.9
2.2
60
1.8
2.0
50
1.5
40
30
1.0
20
0.5
10
69
53
54
64
80
0
0.0
FY2013
FY2014
FY2015E
FY2016E
FY2017E
Source: Company, Angel Research
November 7, 2015
7
Surya Roshni | 2QFY2016 Result Update
Outlook and Valuation
With higher contribution from the Lighting business and entry into newer
businesses, we expect the company to post a CAGR of 6.2% in the top-line over
FY2015E-17E to `3,223cr. The EBITDA margin is estimated to improve from 7.8%
in FY2015 to 8.4% in FY2017. Consequently, the net profit is expected to post a
CAGR of 21.6% over FY2015E-17 to `80cr. At the current market price, the stock
is trading at a cheap valuation of 6.9x its FY2017E earnings. We maintain our Buy
rating on the company and revise our target price to `183, based on a target PE of
10.0x for FY2017E.
Exhibit 11: Steel Business Peer comparison (TTM basis)
Sales EBIT
EBIT Margin Capital Employed
ROCE
(` cr)
(` cr)
(%)
(` cr)
(%)
APL Apollo Consolidated
3,265
164
5.0
928
17.7
Surya Roshni
1,843
43
2.3
1,047
4.1
Source: Company, Angel Research
Exhibit 12: Lighting Business Peer comparison (TTM basis)
Sales
EBIT
EBIT Margin
Capital Employed
ROCE
(` cr)
(` cr)
(%)
(` cr)
(%)
Orient Paper & Ind Ltd
1,225
57
4.6
363
15.6
Surya Roshni
1,312
125
9.5
721
17.3
Source: Company, Angel Research
Exhibit 13: One-year forward P/E band
Price (`)
4
7x
9x
11x
170
150
130
110
90
70
50
30
Source: Company, Angel Research
Key Risks
Competition from Unorganized players - Competition from the unorganized sector
and cheaper imports from China could hurt the company’s sales.
November 7, 2015
8
Surya Roshni | 2QFY2016 Result Update
Sharp movement in commodity prices - Metal is a major raw material for the steel
tube and pipes segment. Steep increase in raw material cost will have a negative
impact on the performance of the company.
Downturn in Economy - Failure in revival of the economy or deterioration in the
economic condition will have a negative impact on both the Steel and Lighting
businesses.
Corporate Guarantee for Loans to Subsidiary - The company has provided
corporate guarantee in favor of bank for loans to its subsidiary Surya Global Steel
Tubes Ltd for a sum of `135cr (outstanding portion is `21cr as on 31st March
2015). Non repayment of the loan may result in an increase in debt, thus working
against our estimates.
We have based our assumptions on the structural shift in the Lighting industry
towards LED lighting. Delay in switchover to LED or any other issues that may
impact the LED switchover will have a negative impact on the revenues of the
company.
November 7, 2015
9
Surya Roshni | 2QFY2016 Result Update
Company Background
Surya Roshni Ltd is a 38 year old conglomerate with its core business comprising
of lighting and steel tube products. The company has nearly four decades of
experience in the steel pipe industry and nearly three decades of experience in the
lighting industry. The company is a reputable name in India and also has presence
in over more than 54 countries. It has recently forayed into fans and appliances
businesses.
Steel - The company is a leader in the steel pipe industry and is the largest G.I &
Hollow section Pipe manufacturer in India. It has the largest ERW pipe and cold
rolled strips mills at Bahadurgarh, Haryana. It also produces API pipes for India as
well as export markets. The pipe division produces nearly 8 lakh MT per annum in
various sizes and specifications. The exports from the segment account for ~17%
(`340cr) of total revenues.
Lighting
- The company is the second largest lighting company in India
commanding a market share in excess of 25%. The company’s existing range of
products includes LED lamps, CFL, tube light, GLS, luminaries and accessories,
high mast lighting systems, lighting poles, etc.
Fans - The company has recently entered the fans business with product offering
that include ceiling, table, pedestal, wall mounted and exhaust fans.
Approximately, the fans business accounts for ~`60cr of the overall revenues.
The company in FY2012 had set up a development (R&D) centre in Noida, which
is equipped with most advanced equipments for light measurement and optical
evaluation for conventional lighting as well as LED measurement. It is listed as one
of the best testing laboratories in India by Bureau of Energy Efficiency (BEE) for LED
lighting system.
Plant Locations
Exhibit 14: Plant Locations
Lighting Division
Steel Division
Kashipur, Uttaranchal
Malanpur, Madhya Pradesh
Malanpur, Madhya Pradesh
Bahadurgarh, Haryana
Source: Company
November 7, 2015
10
Surya Roshni | 2QFY2016 Result Update
Profit and loss statement
Y/E March (` cr)
FY2013
FY2014
FY2015
FY2016E
FY2017E
Total operating income
2,959
3,031
2,857
2,992
3,223
% chg
15.8
2.4
(5.7)
4.7
7.7
Net Raw Materials
2,251
2,266
2,063
2,136
2,293
% chg
15.4
0.7
(8.9)
3.5
7.3
Personnel
135
151
156
180
193
% chg
6.5
12.2
3.5
14.8
7.7
Other
337
380
414
434
465
% chg
19.6
12.8
8.9
4.7
7.3
Total Expenditure
2,722
2,797
2,634
2,750
2,952
EBITDA
237
234
223
242
271
% chg
20.8
(1.3)
(4.5)
8.5
11.9
(% of Net Sales)
8.0
7.7
7.8
8.1
8.4
Depreciation& Amortisation
57
56
56
61
64
EBIT
180
178
167
181
207
% chg
21.2
(1.2)
(6.1)
8.3
14.5
(% of Net Sales)
6.1
5.9
5.8
6.0
6.4
Interest & other Charges
110
114
109
96
93
(% of Net Sales)
3.7
3.8
3.8
3.2
2.9
Other Income
2
4
4
1
1
(% of Net Sales)
0.1
0.1
0.1
0.0
0.0
Recurring PBT
70
64
58
85
115
% chg
28.7
(9.8)
(8.6)
45.7
35.4
PBT (reported)
72
67
62
86
116
Tax
3
14
8
21
36
(% of PBT)
3.9
20.5
12.4
25.0
31.0
PAT (reported)
69
53
54
64
80
Extraordinary Expense/(Inc.)
-
-
-
-
-
ADJ. PAT
69
53
54
64
80
% chg
33.2
(22.9)
1.4
19.1
24.2
(% of Net Sales)
2.3
1.8
1.9
2.2
2.5
Basic EPS (`)
15.8
12.2
12.3
14.7
18.3
Fully Diluted EPS (`)
15.8
12.2
12.3
14.7
18.3
% chg
33.2
(22.9)
1.4
19.1
24.2
November 7, 2015
11
Surya Roshni | 2QFY2016 Result Update
Balance Sheet
Y/E March (` cr)
FY2013
FY2014
FY2015
FY2016E
FY2017E
SOURCES OF FUNDS
Equity Share Capital
44
44
44
44
44
Reserves& Surplus
502
551
588
647
722
Warrants
-
-
-
-
-
Shareholders’ Funds
546
595
632
691
766
Revaluation of Land
186
179
179
179
179
Total Loans
857
1,038
948
900
882
Other Long Term Liabilities
5
6
7
7
7
Long Term Provisions
18
17
19
19
19
Deferred Tax Liability
42
48
51
51
51
Total Liabilities
1,655
1,883
1,836
1,848
1,905
APPLICATION OF FUNDS
Gross Block
1,364
1,470
1,553
1,622
1,692
Less: Acc. Depreciation
511
558
617
678
742
Net Block
853
912
936
944
950
Capital Work-in-Progress
26
54
26
20
15
Investments
50
50
50
50
50
Current Assets
886
1,055
1,066
1,060
1,132
Cash
19
25
26
22
13
Loans & Advances
70
94
118
120
129
Inventory
380
433
390
402
435
Debtors
410
497
524
508
547
Other current assets
6
7
8
8
8
Current liabilities
161
188
243
226
243
Net Current Assets
725
867
823
834
890
Misc. Exp. not written off
-
-
-
-
-
Total Assets
1,655
1,883
1,836
1,848
1,905
November 7, 2015
12
Surya Roshni | 2QFY2016 Result Update
Cash flow statement
Y/E March (` cr)
FY2013
FY2014
FY2015
FY2016E FY2017E
Profit before tax
72
67
62
86
116
Depreciation
57
56
56
61
64
Change in Working Capital
(50)
(136)
46
(15)
(64)
Direct taxes paid
(3)
(14)
(11)
(21)
(36)
Others
99
117
114
(1)
(1)
Cash Flow from Operations
175
90
267
109
78
(Inc.)/Dec. in Fixed Assets
(72)
(133)
(56)
(62)
(65)
(Inc.)/Dec. in Investments
0
0
-
-
-
(Incr)/Decr In LT loans & adv.
-
-
-
-
-
Others
(4)
(13)
(6)
1
1
Cash Flow from Investing
(77)
(146)
(62)
(61)
(63)
Issue of Equity
(15)
(7)
(0)
-
-
Inc./(Dec.) in loans
25
181
(87)
(47)
(18)
Dividend Paid (Incl. Tax)
(20)
(5)
(5)
(5)
(5)
Others
(89)
(107)
(111)
-
-
Cash Flow from Financing
(100)
61
(203)
(53)
(23)
Inc./(Dec.) in Cash
(2)
6
2
(5)
(9)
Opening Cash balances
21
19
25
26
22
Closing Cash balances
19
25
26
22
13
November 7, 2015
13
Surya Roshni | 2QFY2016 Result Update
Key Ratios
Y/E March
FY2013
FY2014
FY2015E
FY2016E
FY2017E
Valuation Ratio (x)
P/E (on FDEPS)
8.0
10.4
10.3
8.6
6.9
P/CEPS
4.4
5.1
5.0
4.4
3.9
P/BV
1.0
0.9
0.9
0.8
0.7
EV/Net sales
0.5
0.5
0.5
0.5
0.4
EV/EBITDA
5.7
6.5
6.4
5.7
5.1
EV / Total Assets
0.8
0.8
0.8
0.7
0.7
Per Share Data (`)
EPS (Basic)
15.8
12.2
12.3
14.7
18.3
EPS (fully diluted)
15.8
12.2
12.3
14.7
18.3
Cash EPS
28.7
24.9
25.1
28.6
32.8
DPS
4.0
1.0
1.0
1.0
1.0
Book Value
124.6
135.6
144.1
157.6
174.7
DuPont Analysis
EBIT margin
6.1
5.9
5.8
6.0
6.4
Tax retention ratio
1.0
0.8
0.9
0.8
0.7
Asset turnover (x)
1.9
1.8
1.6
1.7
1.8
ROIC (Post-tax)
11.4
8.5
8.4
7.8
8.0
Cost of Debt (Post Tax)
12.5
9.6
9.6
7.8
7.2
Leverage (x)
1.4
1.6
1.4
1.2
1.1
Operating ROE
9.8
6.8
6.7
7.7
8.8
Returns (%)
ROCE (Pre-tax)
11.1
10.1
9.0
9.8
11.0
Angel ROIC (Pre-tax)
11.9
10.7
9.6
10.4
11.6
ROE
13.3
9.4
8.8
9.7
11.0
Turnover ratios (x)
Asset TO (Gross Block)
2.2
2.1
1.9
1.9
1.9
Inventory / Net sales (days)
47
49
53
48
47
Receivables (days)
46
55
65
62
62
Payables (days)
18
23
30
30
30
WC cycle (ex-cash) (days)
84
93
105
98
96
Solvency ratios (x)
Net debt to equity
1.4
1.6
1.4
1.2
1.1
Net debt to EBITDA
3.3
4.1
3.9
3.4
3.0
Int. Coverage (EBIT/ Int.)
1.6
1.6
1.5
1.9
2.2
November 7, 2015
14
Surya Roshni | 2QFY2016 Result Update
Research Team Tel: 022 - 39357800
DISCLAIMER
Angel Broking Private Limited (hereinafter referred to as “Angel”) is a registered Member of National Stock Exchange of India Limited,
Bombay Stock Exchange Limited and Metropolitan Stock Exchange of India Limited. It is also registered as a Depository Participant with
CDSL and Portfolio Manager with SEBI. It also has registration with AMFI as a Mutual Fund Distributor. Angel Broking Private Limited is
a registered entity with SEBI for Research Analyst in terms of SEBI (Research Analyst) Regulations, 2014 vide registration number
INH000000164. Angel or its associates has not been debarred/ suspended by SEBI or any other regulatory authority for accessing
/dealing in securities Market. Angel or its associates including its relatives/analyst do not hold any financial interest/beneficial
ownership of more than 1% in the company covered by Analyst. Angel or its associates/analyst has not received any compensation /
managed or co-managed public offering of securities of the company covered by Analyst during the past twelve months. Angel/analyst
has not served as an officer, director or employee of company covered by Analyst and has not been engaged in market making activity
of the company covered by Analyst.
This document is solely for the personal information of the recipient, and must not be singularly used as the basis of any investment
decision. Nothing in this document should be construed as investment or financial advice. Each recipient of this document should
make such investigations as they deem necessary to arrive at an independent evaluation of an investment in the securities of the
companies referred to in this document (including the merits and risks involved), and should consult their own advisors to determine
the merits and risks of such an investment.
Reports based on technical and derivative analysis center on studying charts of a stock's price movement, outstanding positions and
trading volume, as opposed to focusing on a company's fundamentals and, as such, may not match with a report on a company's
fundamentals.
The information in this document has been printed on the basis of publicly available information, internal data and other reliable
sources believed to be true, but we do not represent that it is accurate or complete and it should not be relied on as such, as this
document is for general guidance only. Angel Broking Pvt. Limited or any of its affiliates/ group companies shall not be in any way
responsible for any loss or damage that may arise to any person from any inadvertent error in the information contained in this report.
Angel Broking Pvt. Limited has not independently verified all the information contained within this document. Accordingly, we cannot
testify, nor make any representation or warranty, express or implied, to the accuracy, contents or data contained within this document.
While Angel Broking Pvt. Limited endeavors to update on a reasonable basis the information discussed in this material, there may be
regulatory, compliance, or other reasons that prevent us from doing so.
This document is being supplied to you solely for your information, and its contents, information or data may not be reproduced,
redistributed or passed on, directly or indirectly.
Neither Angel Broking Pvt. Limited, nor its directors, employees or affiliates shall be liable for any loss or damage that may arise from
or in connection with the use of this information.
Note: Please refer to the important ‘Stock Holding Disclosure' report on the Angel website (Research Section). Also, please refer to the
latest update on respective stocks for the disclosure status in respect of those stocks. Angel Broking Pvt. Limited and its affiliates may
have investment positions in the stocks recommended in this report.
Disclosure of Interest Statement
Surya Roshni
1. Analyst ownership of the stock
No
2. Angel and its Group companies ownership of the stock
No
3. Angel and its Group companies' Directors ownership of the stock
No
4. Broking relationship with company covered
No
Note: We have not considered any Exposure below ` 1 lakh for Angel, its Group companies and Directors
Ratings (Based on expected returns
Buy (> 15%)
Accumulate (5% to 15%)
Neutral (-5 to 5%)
over 12 months investment period):
Reduce (-5% to -15%)
Sell (< -15)
November 7, 2015
15