2QFY2016 Result Update | Banking
November 7, 2015
State Bank of India
BUY
CMP
`243
Performance Highlights
Target Price
`283
Particulars (` cr)
2QFY16 1QFY16
% chg (qoq)
2QFY15
% chg (yoy)
Investment Period
12 months
NII
14,253
13,732
3.8
13,275
7.4
Pre-prov. profit*
10,266
9,202
11.6
8,422
21.9
Stock Info
PAT
3,879
3,692
5.1
3,100
25.1
Source: Company, Angel Research
Sector
Banking
Market Cap (` cr)
1,88,830
State Bank of India (SBI)’s 2QFY2016 results have outperformed our as well as
Beta
1.4
street expectations. The PAT for the bank grew 25.1% yoy to `3,879cr, led by
52 Week High / Low
336/221
healthy performance on all fronts.
Avg. Daily Volume
1,67,84,206
Slippages dip, NIM improves, qoq
Face Value (`)
1
During 2QFY2016, the bank’s advances grew by 10.5% yoy, which is the highest
BSE Sensex
26,265
growth rate amongst the previous 5 quarters. Consolidation continued in mid-
Nifty
7,954
corporate and Agri, which posted a decline of 5.2% and 2.2% yoy, respectively.
Reuters Code
SBI.BO
On the other hand, retail and large corporate continued to scale up with a
Bloomberg Code
SBIN@IN
growth of 16.8% yoy and 21.7% yoy, respectively. Deposits outpaced advances
with a 10.9% yoy growth for the quarter, with retail term deposits growing at
12.6% yoy. The Global NIM increased marginally by 2bp qoq to 3.01% in
Shareholding Pattern (%)
2QFY2016 which was mainly due to decline in the cost of funds; but yields
Promoters
60.2
witnessed a decline during the quarter. The non-interest income (excl. treasury)
MF / Banks / Indian Fls
18.4
for the bank grew by 14.2% yoy, with fee income growth of 1.4% yoy.
FII / NRIs / OCBs
10.4
Asset quality showed signs of improvement with Gross and Net NPA ratios
declining by 14bp and 10bp to 4.15% and 2.14% respectively. Fresh slippages
Indian Public / Others
11.1
came in at `5,875cr as against `7,318cr for 1QFY2016. Even restructuring of
loan assets came lower at `2,450cr as against `3,936cr in the sequential
previous quarter. The bank refinanced ~`4,000cr worth of loans under the 5/25
Abs. (%)
3m 1yr 3yr
scheme and `400cr worth of assets were sold to ARCs, during the quarter. Further, it
has guided for a refinacing pipeline of ~`6,600cr (8 loan accounts), going ahead.
Sensex
(7.2)
(5.9)
39.6
Outlook and valuation: SBI has been reporting stable numbers with respect to
SBI
(15.6)
(12.6)
11.9
slippages and NPA ratios over the past several quarters as compared to its peers.
With expectation of improvement in economic growth in the medium term, asset
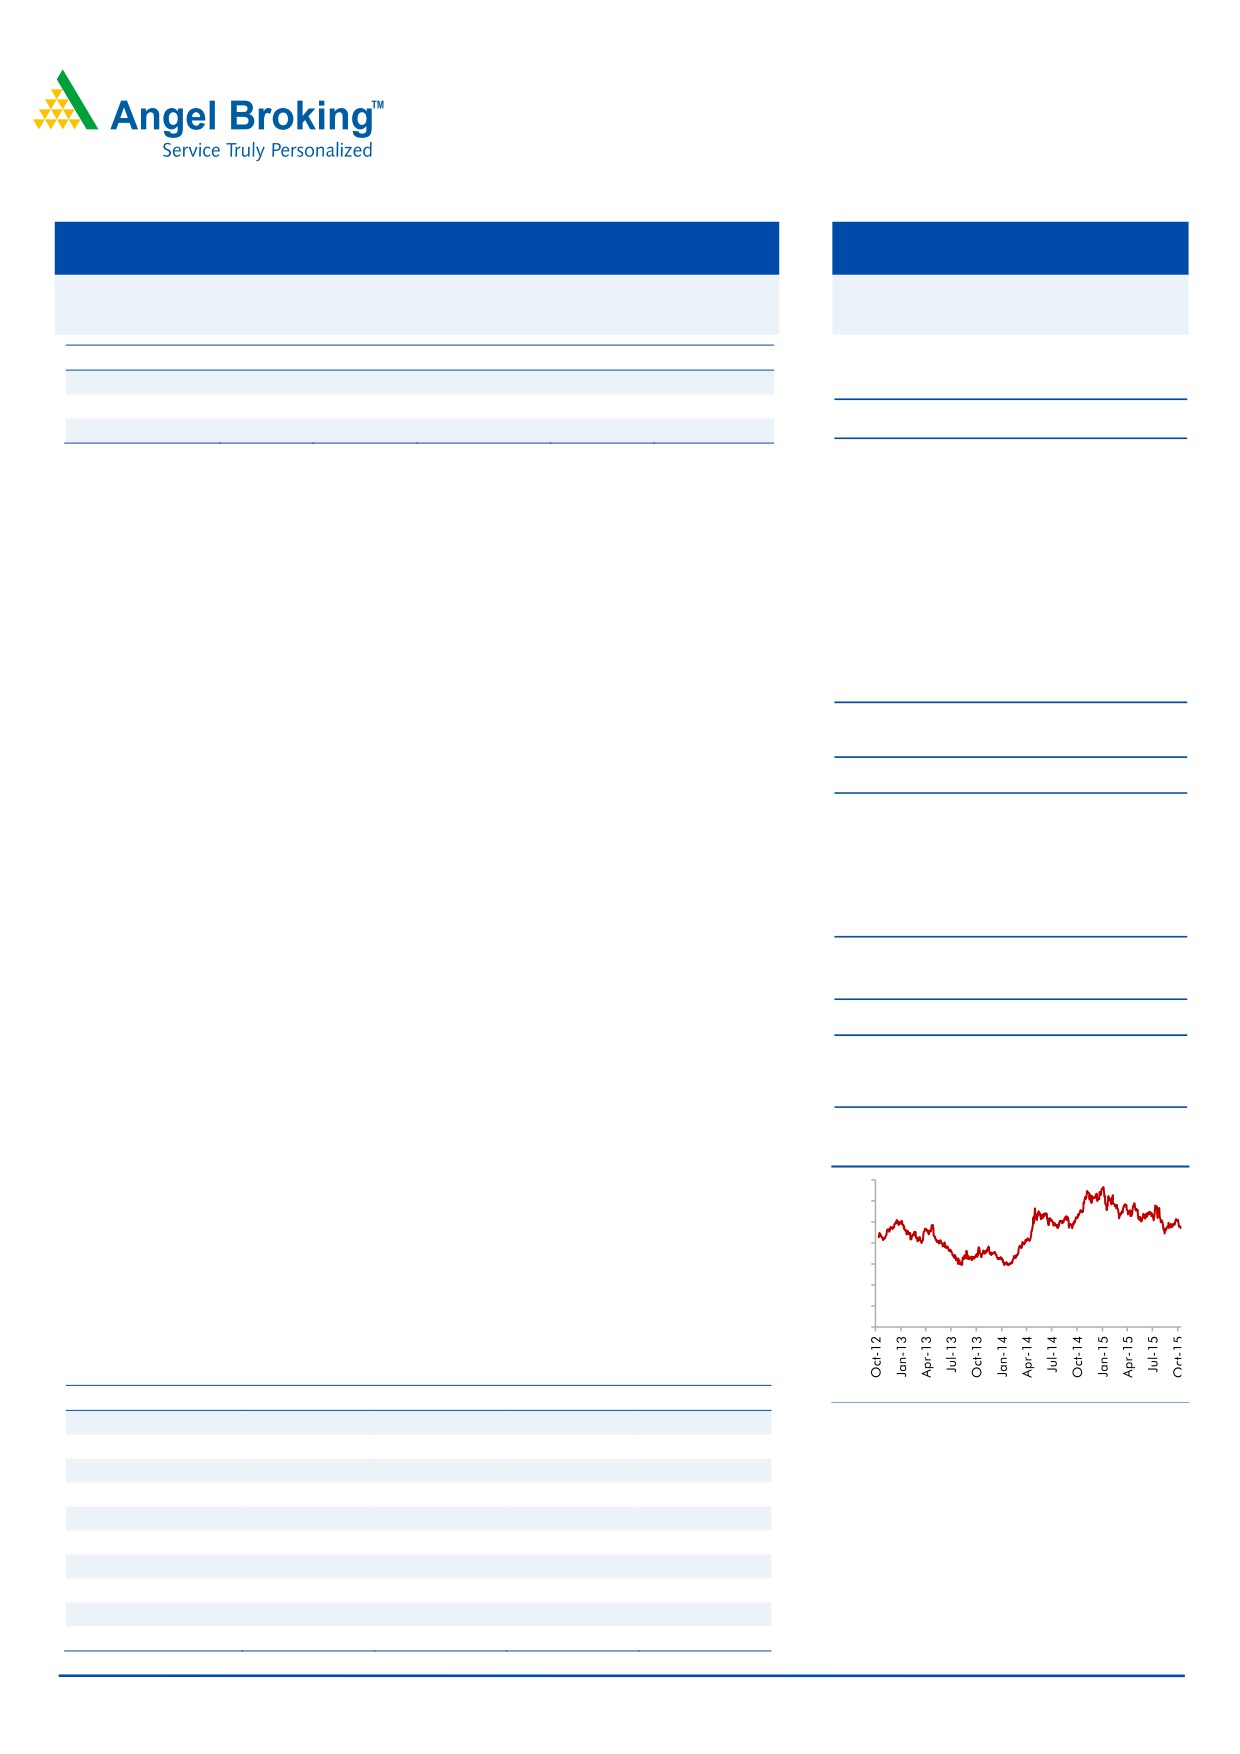
3-year price chart
quality woes could further reduce, which in turn could lead to further
350
improvement in return ratios. The bank’s core strength has been its high CASA
300
250
and fee income, which has supported its core profitability in challenging times. Its
200
strong capital adequacy also provides comfort. In our view, the stock is currently
150
trading at a moderate valuation of 0.9x FY2017E ABV (after adjusting `44/share
100
towards value of subsidiaries) as compared to its peers. Hence, we recommend a
50
0
BUY rating on the stock with a target price of `283.
Key financials (standalone)
Y/E March (` cr)
FY2014
FY2015E
FY2016E
FY2017E
NII
49,282
55,015
56,952
65,593
Source: Company, Angel Research
% chg
11.2
11.6
3.5
15.2
Net profit
10,891
13,169
14,954
18,266
% chg
(22.8)
20.9
13.6
22.2
Vaibhav Agrawal
NIM (%)
3.0
3.0
2.7
2.8
022 - 3935 7800 Ext: 6808
EPS (`)
14.6
17.6
20.0
24.5
P/E (x)
16.3
13.4
11.8
9.7
P/ABV (x)
1.6
1.5
1.3
1.1
Chintan Shah
RoA (%)
0.6
0.7
0.7
0.7
022 - 4000 3600 Ext: 6828
RoE (%)
10.4
11.1
11.5
12.8
Source: Company, Angel Research; Note: CMP as of November 6, 2015
Please refer to important disclosures at the end of this report
1
State Bank of India | 2QFY2016 Result Update
Exhibit 1: 2QFY2016 performance (standalone)
Particulars (` cr)
2QFY16
1QFY16
% chg (qoq)
2QFY15
% chg (yoy)
FY2015
FY2014
% chg
Interest earned
40,658
39,643
2.6
37,263
9.1
1,52,397
1,36,351
11.8
- on Advances / Bills
28,982
28,582
1.4
27,869
4.0
1,12,344
1,02,484
9.6
- on investments
10,565
10,019
5.4
9,061
16.6
37,088
31,942
16.1
- on balance with RBI & others
180
234
(23.2)
105
71.9
505
409
23.4
- on others
931
808
15.3
228
308.9
2,460
1,516
62.3
Interest Expended
26,405
25,911
1.9
23,988
10.1
97,382
87,069
11.8
Net Interest Income
14,253
13,732
3.8
13,275
7.4
55,015
49,283
11.6
Other income
6,197
5,088
21.8
4,571
35.6
22,576
18,553
21.7
Other income excl. treasury
4,703
4,216
11.6
4,118
14.2
18,957
16,477
15.1
- Fee Income
3,153
3,202
(1.5)
3,111
1.4
14,140
12,611
12.1
- Treasury Income*
1,494
872
71.3
453
229.8
3,619
2,076
74.3
- Forex Income
474
489
(3.1)
466
1.7
1,936
1,778
8.9
- Others
1,076
525
105.0
541
99.0
2,881
2,088
38.0
Operating income
20,450
18,820
8.7
17,845
14.6
77,591
67,835
14.4
Operating expenses
10,184
9,618
5.9
9,423
8.1
38,678
35,726
8.3
- Employee expenses
6,142
5,906
4.0
5,564
10.4
23,537
22,504
4.6
- Other Opex
4,042
3,712
8.9
3,860
4.7
15,141
13,222
14.5
Pre-provision Profit
10,266
9,202
11.6
8,422
21.9
38,913
32,109
21.2
Provisions & Contingencies
4,361
4,000
9.0
4,275
2.0
19,600
15,935
23.0
- Provisions for NPAs
3,842
3,359
14.4
4,028
(4.6)
18,709
14,224
31.5
- Provisions for Investments
(51)
180
(128.3)
(1)
5,000.0
(590)
563
(204.8)
- Provisions for Std. Assets
591
396
49.2
159
271.7
1,010
1,261
(19.9)
- Other Provisions
(21)
65
(132.5)
89
(123.8)
470
(112)
(518.9)
PBT
5,905
5,202
13.5
4,147
42.4
19,314
16,174
19.4
Provision for Tax
2,026
1,510
34.2
1,047
93.6
6,212
5,283
17.6
PAT
3,879
3,692
5.1
3,100
25.1
13,102
10,891
20.3
Effective Tax Rate (%)
34.3
29.0
529bp
25.2
908bp
32.2
32.7
(50)bp
Source: Company, Angel Research;
November 7, 2015
2
State Bank of India | 2QFY2016 Result Update
Exhibit 2: 2QFY2016 performance analysis (standalone)
Particulars
2QFY16
1QFY16 % chg (qoq) 2QFY15 % chg (yoy)
Balance sheet
Advances (` cr)
13,37,153 12,80,127
4.5 12,09,648
10.5
Deposits (` cr)
16,34,115 16,13,545
1.3 14,73,785
10.9
Credit-to-Deposit Ratio (%)
81.8
79.3
249bp
82.1
(25)bp
Current deposits (` cr)
1,01,033
96,845
4.3
90,939
11.1
Saving deposits (` cr)
5,50,397
5,39,050
2.1
5,00,861
9.9
CASA deposits (` cr)
6,51,430
6,35,895
2.4
5,91,800
10.1
CASA ratio (%)
39.9
39.4
45bp
40.2
(29)bp
CAR (%)*
12.2
12.0
17bp
12.3
(16)bp
Tier 1 CAR (%)*
9.9
9.6
29bp
10.1
(15)bp
Profitability Ratios (%)
Cost of deposits
6.30
6.35
(5)bp
6.31
(1)bp
Yield on advances
10.32
10.33
(1)bp
10.57
(25)bp
Cost of funds
-
-
0bp
6.4
(642)bp
Reported NIM (global)
3.01
2.99
2bp
3.11
(10)bp
Cost-to-income ratio
49.8
51.1
(131)bp
52.8
(301)bp
Asset quality
Gross NPAs (` cr)
56,834
56,421
0.7
60,712
(6.4)
Gross NPAs (%)
4.2
4.3
(14)bp
4.9
(74)bp
Net NPAs (` cr)
28,592
28,669
(0.3)
32,997
(13.4)
Net NPAs (%)
2.1
2.2
(10)bp
2.7
(59)bp
Provision Coverage Ratio (%)
70.5
69.5
99bp
63.2
730bp
Slippage ratio (%)
1.8
2.4
(61)bp
2.5
(74)bp
Loan loss prov. to avg assets (%)
0.8
0.7
7bp
0.9
(14)bp
Source: Company, Angel Research
November 7, 2015
3
State Bank of India | 2QFY2016 Result Update
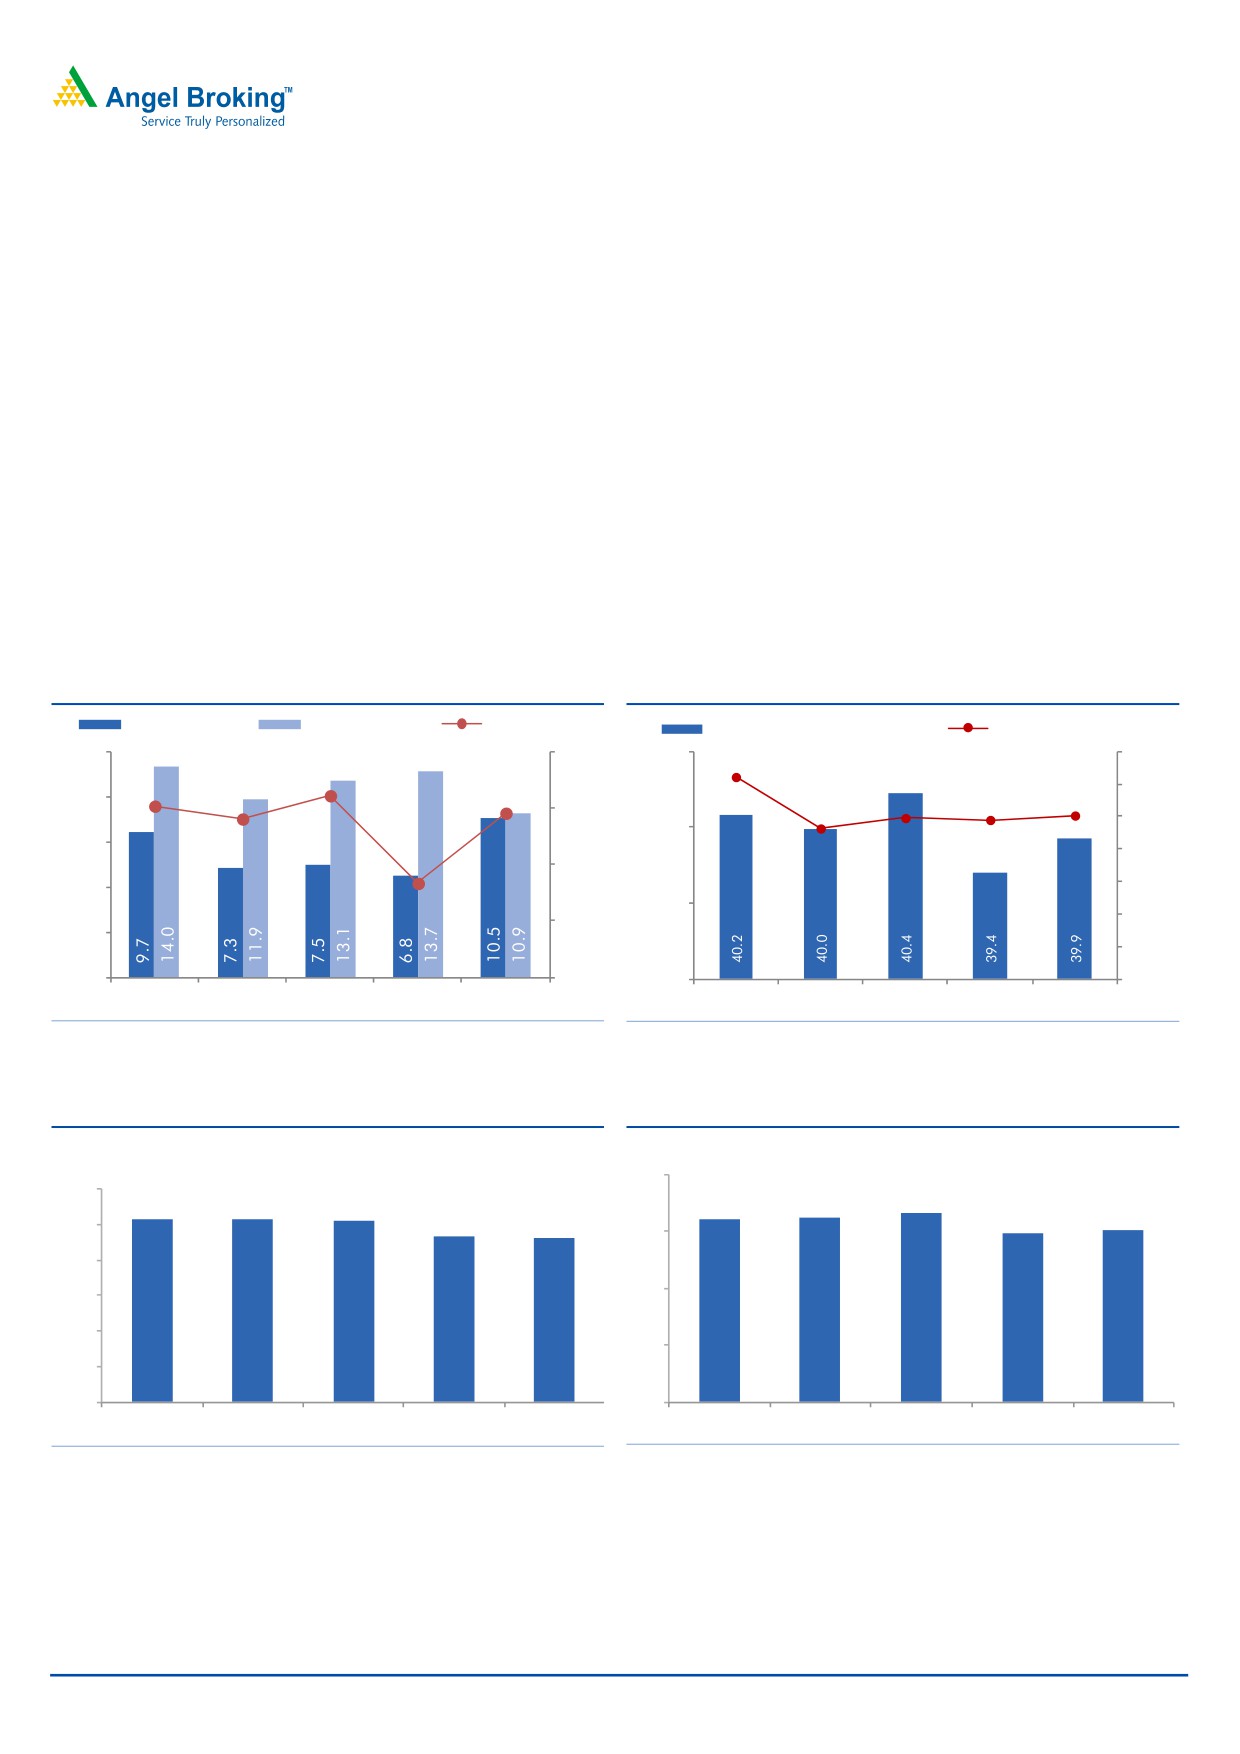
Pick-up in advances growth; Margin improves qoq
During 2QFY2016, the bank’s advances grew by 10.5% yoy, which is the highest
growth rate amongst the previous 5 quarters. Consolidation continued in mid-
corporate and Agri, which posted a decline of 5.2% and 2.2% yoy, respectively.
On the other hand, retail and large corporate continued to scale up with a growth
of 16.8% yoy and 21.7% yoy, respectively. Advances growth was also backed by a
17% yoy growth in overseas loans, which now constitute 19.4% of the total loan
portfolio. Deposits outpaced advances with a 10.9% yoy growth for the quarter,
with retail term deposits growing at 12.6% yoy.
The Global NIM increased marginally by 2bp qoq to 3.01% in 2QFY2016 which
was mainly due to decline in the cost of funds by 5bp qoq to 6.30% whereas the
benefits were partially offset by declining yields, which came at 10.32%. The bank
expects a marginal decline in the NIM from the current level due to a 30bp cut in
the base rate.
Exhibit 3: Business grows at steady pace
Exhibit 4: CASA growth remains moderate
Adv. YoY growth
Dep. YoY growth
CD ratio (RHS)
Reported domestic CASA ratio (%)
CASA yoy growth (%, RHS)
15.0
84.0
41.0
12.4
14.0
82.4
82.1
12.0
81.8
9.9
10.1
12.0
81.6
9.8
82.0
9.3
10.0
40.0
9.0
8.0
79.3
80.0
6.0
6.0
39.0
4.0
78.0
3.0
2.0
-
76.0
38.0
-
2QFY15
3QFY15
4QFY15
1QFY16
2QFY16
2QFY15
3QFY15
4QFY15
1QFY16
2QFY16
Source: Company, Angel Research
Source: Company, Angel Research
Exhibit 5: Yields on Advances witness a dip
Exhibit 6: Global NIM improves qoq
(%)
(%)
3.5
11.0
10.57
10.57
10.55
3.11
3.12
3.16
2.99
3.01
10.33
10.32
10.5
3.0
10.0
2.5
9.5
9.0
2.0
8.5
8.0
1.5
2QFY15
3QFY15
4QFY15
1QFY16
2QFY16
2QFY15
3QFY15
4QFY15
1QFY16
2QFY16
Source: Company, Angel Research
Source: Company, Angel Research, * Cumulative NIMs
Steady growth in non-interest income (excl. treasury)
The non-interest income (excl. treasury) for the bank grew by 14.2% yoy, with
subdued fee income growth of 1.4% yoy. The profit on sale on investments came
at `1,494cr, growing by 230% yoy, which boosted other income. The profit on sale
November 7, 2015
4
State Bank of India | 2QFY2016 Result Update
of investments grew 230% yoy to `1,494cr. It includes ~`1,000cr on account of
churning of the G-Sec portfolio. Also included in the non-interest income is a one-
time extraordinary profit of `485cr pertaining to repatriation of profits from
abroad.
Exhibit 7: Treasury enables healthy non-int. Income
Particulars (` cr)
2QFY16
1QFY16
% chg (qoq) 2QFY15
% chg (yoy)
Fee income
3,153
3,202
(1.5)
3,111
1.4
Treasury
1,494
872
71.3
453
229.8
Forex
474
489
(3.1)
466
1.7
Dividend
47
32
46.9
41
14.6
Others
1,029
493
108.8
500
106.0
Other income
6,197
5,088
21.8
4,571
35.6
Other income excl. treasury
4,703
4,216
11.6
4,118
14.2
Source: Company, Angel Research
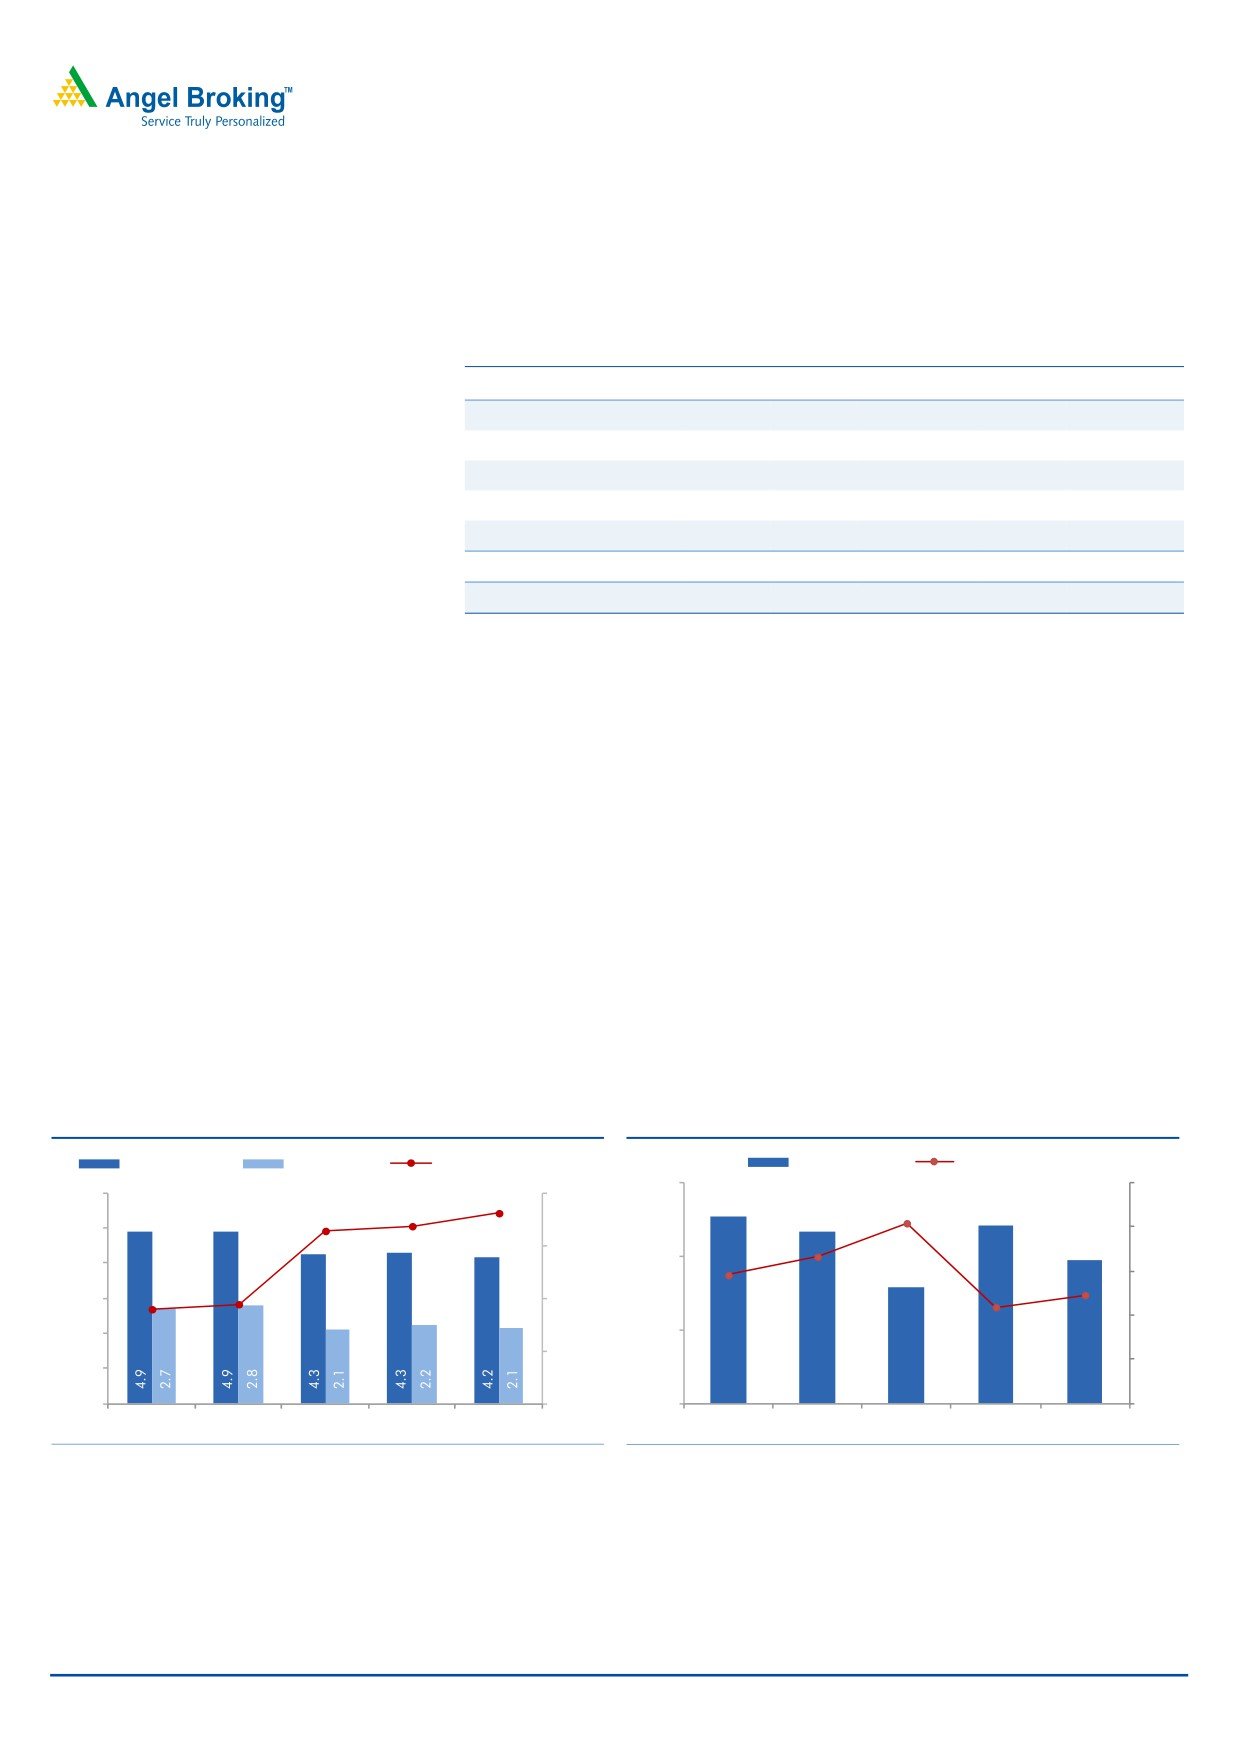
Asset quality improves; Slippages dip qoq
Asset quality showed signs of improvement with Gross and Net NPA ratios
declining by 14bp and 10bp to 4.15% and 2.14% respectively. Fresh slippages for
the quarter came in at `5,875cr as against `7,318cr for 1QFY2016 resulting in
annualized slippage ratio of 1.8% in 2QFY2016 as against 2.3% in 1QFY2016.
Sequential increase in fresh slippages was primarily due to higher slippages from
mid corporate and SME segments. Even restructuring of loan assets came lower at
`2,450cr as against `3,936cr in the sequential previous quarter. The bank
refinanced ~`4,000cr worth of loans under the 5/25 scheme and `400cr worth of
assets were sold to ARCs, during the quarter. Further, it has guided for a pipeline
of ~`6,600cr (8 loan accounts), going ahead. The Reported Gross NPA +
Restructured Std. to Gross advances stood at 8.04% for the quarter, as compared
to 8.55% in 1QFY2016.
Exhibit 8: NPA ratios improving
Exhibit 9: Slippages dip qoq
Gross NPAs (%)
Net NPAs (%)
NPA coverage (%, RHS)
Slippages (%)
Credit cost (%, RHS)
3.0
1.5
6.0
70.5
72.0
69.1
69.5
1.2
5.0
1.2
1.0
68.0
2.0
0.9
4.0
0.7
0.9
63.6
63.2
0.7
3.0
64.0
0.6
2.0
1.0
60.0
0.3
1.0
2.5
2.3
1.6
2.4
1.9
-
56.0
-
-
2QFY15
3QFY15
4QFY15
1QFY16
2QFY16
2QFY15
3QFY15
4QFY15
1QFY16
2QFY16
Source: Company, Angel Research
Source: Company, Angel Research
November 7, 2015
5
State Bank of India | 2QFY2016 Result Update
Performance overview of subsidiaries
SBI Life reported a PAT of `206cr for 2QFY2016, as compared to `218cr in
1QFY2015.
SBI Cards and Payment Services posted a PAT of `70cr for 2QFY2016 as
against `80cr posted in 2QFY2015, while SBI Funds Management recorded a
PAT of `43cr for 2QFY2016 as against `44cr for 2QFY2015.
SBI Capital Markets registered a PAT of
`57cr during 2QFY2016, as
compared to a PAT of `108cr in 2QFY2015.
SBI’s associate banks recorded earnings growth of 38.1% yoy to `873cr for
1QFY2016.
On a consolidated basis, the bottom-line of the bank rose 24% yoy to
`4,992cr during the quarter ended September 30, 2015
Outlook and valuation: SBI has been reporting stable numbers with respect to
slippages and NPA ratios over the past several quarters as compared to its peers.
With expectation of improvement in economic growth in the medium term, asset
quality woes could further reduce, which in turn could lead to further improvement
in return ratios. The bank’s core strength has been its high CASA and fee income,
which has supported its core profitability in challenging times. Its strong capital
adequacy also provides comfort. In our view, the stock is currently trading at a
moderate valuation of 0.9x FY2017E ABV (after adjusting `44/share towards value
of subsidiaries) as compared to its peers. Hence, we recommend a BUY rating on
the stock with a target price of `283.
Exhibit 10: Recommendation summary
CMP
Tgt. Price
Upside
FY2017E
FY2017E Tgt.
FY2017E
FY15-17E
FY2017E
FY2017E
Company
Reco.
(`)
(`)
(%)
P/ABV (x)
P/ABV (x)
P/E (x)
EPS CAGR (%)
RoA (%)
RoE (%)
HDFCBk
Buy
1,081
1,262
16.8
3.3
3.8
17.7
22.4
1.9
19.7
ICICIBk*
Buy
267
348
30.0
1.8
2.0
10.6
15.3
1.6
15.2
YesBk
Buy
758
914
20.5
2.0
2.4
10.9
20.2
1.6
19.6
AxisBk
Buy
465
630
35.5
1.9
2.6
10.7
18.4
1.8
18.9
SBI*
Buy
243
283
16.4
1.2
1.2
9.9
17.8
0.7
12.8
FedBk
Neutral
55
-
-
1.0
1.0
8.7
3.1
1.0
11.9
SIB
Neutral
21
-
-
0.7
0.8
6.2
21.6
0.7
11.6
BOB
Neutral
167
-
-
0.9
0.8
7.9
17.5
0.6
10.6
PNB
Neutral
133
-
-
0.6
0.6
4.9
28.5
0.7
12.0
BOI
Neutral
134
-
-
0.3
0.8
4.0
14.0
0.3
7.6
IndBk
Neutral
128
-
-
0.4
0.4
4.3
19.4
0.7
9.3
Vijaya Bank
Neutral
34
-
-
0.5
0.5
5.1
14.1
0.4
8.8
OBC
Neutral
145
-
-
0.3
0.5
3.2
65.5
0.5
9.4
Allahabad Bank
Neutral
74
-
-
0.3
0.3
2.9
53.5
0.6
10.9
UnionBk
Neutral
163
-
-
0.5
0.4
4.2
18.1
0.6
11.4
CanBk
Neutral
275
-
-
0.4
0.3
4.0
9.8
0.5
10.7
AllBk
Neutral
74
-
-
0.3
0.4
2.9
53.5
0.6
10.9
IDBI#
Neutral
85
-
-
0.6
0.6
6.0
61.6
0.6
9.3
Source: Company, Angel Research; Note:*Target multiples=SOTP Target Price/ABV (including subsidiaries), #Without adjusting for SASF
November 7, 2015
6
State Bank of India | 2QFY2016 Result Update
Company background
State Bank of India is the largest bank in India, with an asset size of ~`20.5lakh
cr. The bank has the widest network of ~16,400 branches, with dominant
presence across all regions in the country, with two-third of its branches in rural
and semi-urban areas. It has subsidiaries in life insurance, asset management,
credit cards and capital markets space, among others; and five regional subsidiary
banks.
Income statement (standalone)
Y/E March (` cr)
FY12
FY13
FY14
FY15
FY16E
FY17E
Net Interest Income
43,291
44,331
49,282
55,015
56,952
65,593
- YoY Growth (%)
33.1
2.4
11.2
11.6
3.5
15.2
Other Income
14,351
16,035
18,553
22,643
25,568
27,706
- YoY Growth (%)
(9.3)
11.7
15.7
22.0
12.9
8.4
Operating Income
57,643
60,366
67,835
77,659
82,520
93,299
- YoY Growth (%)
19.2
4.7
12.4
14.5
6.3
13.1
Operating Expenses
26,069
29,284
35,726
38,678
42,192
46,828
- YoY Growth (%)
13.3
12.3
22.0
8.3
9.1
11.0
Pre - Provision Profit
31,574
31,082
32,109
38,981
40,328
46,471
- YoY Growth (%)
24.6
(1.6)
3.3
21.4
3.5
15.2
Prov. & Cont.
13,090
11,131
15,793
19,599
17,733
18,537
- YoY Growth (%)
26.1
(15.0)
41.9
24.1
(9.5)
4.5
Profit Before Tax
18,483
19,951
16,316
19,382
22,595
27,934
- YoY Growth (%)
23.6
7.9
(18.2)
18.8
16.6
23.6
Prov. for Taxation
6,776
5,846
5,425
6,213
7,641
9,667
- as a % of PBT
36.7
29.3
33.2
32.1
33.8
34.6
PAT
11,707
14,105
10,891
13,169
14,954
18,266
- YoY Growth (%)
41.7
20.5
(22.8)
20.9
13.6
22.2
November 7, 2015
7
State Bank of India | 2QFY2016 Result Update
Balance sheet (standalone)
Y/E March (` cr)
FY12
FY13
FY14
FY15
FY16E
FY17E
Share Capital
671
684
747
747
747
747
Reserves & Surplus
83,280
98,200
1,17,536
1,28,741
1,40,353
1,54,347
Deposits
10,43,647
12,02,740
13,94,409
15,76,793
17,97,544
20,49,201
- Growth (%)
11.7
15.2
15.9
13.1
14.0
14.0
Borrowings
86,989
1,28,954
1,40,550
1,63,633
1,83,736
2,09,459
Tier 2 Capital
40,016
40,229
42,581
41,517
40,479
39,467
Other Liab & Prov.
80,915
94,826
96,413
1,37,677
1,37,278
1,57,226
Total Liabilities
13,35,519
15,65,632
17,92,235
20,49,108
23,00,137
26,10,447
Cash balances
54,076
65,830
84,956
1,15,884
89,877
1,02,460
Bank balances
43,087
48,990
47,594
58,978
66,223
75,494
Investments
3,12,198
3,50,927
3,98,308
4,96,055
6,52,554
7,46,591
Advances
8,67,579
10,45,617
12,09,829
13,00,026
14,04,029
15,86,552
- Growth (%)
14.7
20.5
15.7
7.5
8.0
13.0
Fixed Assets
5,467
7,005
8,002
9,329
10,161
11,236
Other Assets
53,113
47,263
43,546
68,836
77,292
88,113
Total Assets
13,35,519
15,65,632
17,92,235
20,49,108
23,00,137
26,10,447
- Growth (%)
9.1
17.3
14.5
14.3
12.3
14.0
November 7, 2015
8
State Bank of India | 2QFY2016 Result Update
Ratio analysis (standalone)
Y/E March
FY12
FY13
FY14
FY15
FY16E
FY17E
Profitability Ratios (%)
NIMs
3.6
3.2
3.0
3.0
2.7
2.8
Cost to Income Ratio
45.2
48.5
52.7
49.8
51.1
50.2
RoA
0.9
0.9
0.6
0.7
0.7
0.7
RoE
16.5
16.2
10.4
11.1
11.5
12.8
B/S ratios (%)
CASA Ratio
44.8
44.8
42.9
40.4
40.4
41.2
Credit/Deposit Ratio
83.1
86.9
86.8
82.4
78.1
77.4
CAR
13.9
12.9
12.4
11.6
11.0
10.4
- Tier I
9.8
9.5
9.6
9.1
8.8
8.5
Asset Quality (%)
Gross NPAs
4.5
4.8
5.0
4.3
5.1
5.6
Net NPAs
1.8
2.1
2.6
2.1
2.0
1.8
Slippages
3.2
3.6
3.8
2.4
2.4
2.3
Loan Loss Prov./Avg. Assets
0.9
0.7
0.9
1.0
0.8
0.7
Provision Coverage
68.1
66.6
62.9
65.0
71.0
75.0
Per Share Data (`)
EPS
17.4
20.6
14.6
17.6
20.0
24.5
ABVPS
120.0
136.5
144.8
162.9
183.9
207.7
DPS
35.0
41.5
30.0
58.2
39.5
50.5
Valuation Ratios
PER (x)
13.6
11.5
16.3
13.4
11.8
9.7
P/ABVPS (x)
2.0
1.7
1.6
1.5
1.3
1.1
Dividend Yield
14.8
17.5
12.6
24.5
16.7
21.3
DuPont Analysis (%)
NII
3.4
3.1
2.9
2.9
2.6
2.7
(-) Prov. Exp.
1.0
0.8
0.9
1.0
0.8
0.8
Adj. NII
2.4
2.3
2.0
1.9
1.8
1.9
Treasury
(0.1)
0.1
0.1
0.1
0.2
0.2
Int. Sens. Inc.
2.3
2.4
2.1
2.0
2.0
2.1
Other Inc.
1.2
1.0
1.0
1.0
1.0
1.0
Op. Inc.
3.5
3.4
3.1
3.0
3.0
3.1
Opex
2.0
2.0
2.1
2.0
1.9
1.9
PBT
1.4
1.4
1.0
1.0
1.0
1.1
Taxes
0.5
0.4
0.3
0.3
0.4
0.4
RoA
0.9
0.9
0.6
0.7
0.7
0.7
Leverage (x)
18.8
17.1
16.6
16.6
17.3
17.1
RoE
16.5
16.2
10.4
11.1
11.5
12.8
November 7, 2015
9
State Bank of India | 2QFY2016 Result Update
Research Team Tel: 022 - 39357800
DISCLAIMER
Angel Broking Private Limited (hereinafter referred to as “Angel”) is a registered Member of National Stock Exchange of India Limited,
Bombay Stock Exchange Limited and Metropolitan Stock Exchange of India Limited. It is also registered as a Depository Participant with
CDSL and Portfolio Manager with SEBI. It also has registration with AMFI as a Mutual Fund Distributor. Angel Broking Private Limited is
a registered entity with SEBI for Research Analyst in terms of SEBI (Research Analyst) Regulations, 2014 vide registration number
INH000000164. Angel or its associates has not been debarred/ suspended by SEBI or any other regulatory authority for accessing
/dealing in securities Market. Angel or its associates including its relatives/analyst do not hold any financial interest/beneficial
ownership of more than 1% in the company covered by Analyst. Angel or its associates/analyst has not received any compensation /
managed or co-managed public offering of securities of the company covered by Analyst during the past twelve months. Angel/analyst
has not served as an officer, director or employee of company covered by Analyst and has not been engaged in market making activity
of the company covered by Analyst.
This document is solely for the personal information of the recipient, and must not be singularly used as the basis of any investment
decision. Nothing in this document should be construed as investment or financial advice. Each recipient of this document should
make such investigations as they deem necessary to arrive at an independent evaluation of an investment in the securities of the
companies referred to in this document (including the merits and risks involved), and should consult their own advisors to determine
the merits and risks of such an investment.
Reports based on technical and derivative analysis center on studying charts of a stock's price movement, outstanding positions and
trading volume, as opposed to focusing on a company's fundamentals and, as such, may not match with a report on a company's
fundamentals.
The information in this document has been printed on the basis of publicly available information, internal data and other reliable
sources believed to be true, but we do not represent that it is accurate or complete and it should not be relied on as such, as this
document is for general guidance only. Angel Broking Pvt. Limited or any of its affiliates/ group companies shall not be in any way
responsible for any loss or damage that may arise to any person from any inadvertent error in the information contained in this report.
Angel Broking Pvt. Limited has not independently verified all the information contained within this document. Accordingly, we cannot
testify, nor make any representation or warranty, express or implied, to the accuracy, contents or data contained within this document.
While Angel Broking Pvt. Limited endeavors to update on a reasonable basis the information discussed in this material, there may be
regulatory, compliance, or other reasons that prevent us from doing so.
This document is being supplied to you solely for your information, and its contents, information or data may not be reproduced,
redistributed or passed on, directly or indirectly.
Neither Angel Broking Pvt. Limited, nor its directors, employees or affiliates shall be liable for any loss or damage that may arise from
or in connection with the use of this information.
Note: Please refer to the important ‘Stock Holding Disclosure' report on the Angel website (Research Section). Also, please refer to the
latest update on respective stocks for the disclosure status in respect of those stocks. Angel Broking Pvt. Limited and its affiliates may
have investment positions in the stocks recommended in this report.
Disclosure of Interest Statement
State Bank of India
1. Analyst ownership of the stock
No
2. Angel and its Group companies ownership of the stock
No
3. Angel and its Group companies' Directors ownership of the stock
No
4. Broking relationship with company covered
No
Note: We have not considered any Exposure below ` 1 lakh for Angel, its Group companies and Directors
Ratings (Based on expected returns
Buy (> 15%)
Accumulate (5% to 15%)
Neutral (-5 to 5%)
over 12 months investment period):
Reduce (-5% to -15%)
Sell (< -15%)
November 7, 2015
10