1QFY2017 Result Update | Textile
September 15, 2016
Siyaram Silk Mills
BUY
CMP
`1,250
Performance Highlights
Target Price
`1,469
Y/E March (` cr)
1QFY17
1QFY16
% chg. (yoy) 4QFY16
% chg. (qoq)
Investment Period
12 Months
Net Sales
281
298
(5.4)
505
(44.3)
Stock Info
Operating profit
30
31
(4.4)
60
(50.7)
Sector
Textile
OPM (%)
10.6
10.4
11bp
11.9
(137bp)
Market Cap (` cr)
1,167
Adj. PAT
10
13
(22.0)
32
(68.7)
Net debt (` cr)
334
Source: Company, Angel Research
Beta
1.0
52 Week High / Low
1,167 / 910
Siyaram Silk Mills (SSML)’ results for 1QFY2017 have come in below our
Avg. Daily Volume
1,883
estimates with the company having reported a de-growth in its top-line as well as
Face Value (`)
10
the bottom-line for the quarter.
BSE Sensex
28,372
Nifty
8,727
Top-line de-growth: The top-line for the quarter de-grew by ~5% yoy to `281cr
Reuters Code
SIYR.BO
which can be mainly attributed to lower volume growth.
Bloomberg Code
SIYA IN
Underperformance at the EBITDA level: The EBITDA for the quarter de-grew by
~4% yoy to `30cr and the EBITDA margin expansion by 11bp yoy to 10.6% due
Shareholding Pattern (%)
to lower raw material cost.
Promoters
67.1
PAT declines: During the quarter, the net profit de-grew ~22% yoy to `10cr
MF / Banks / Indian Fls
6.3
due to de-growth in sales and poor operating margin.
FII / NRIs / OCBs
0.6
Indian Public / Others
26.0
Outlook and Valuation: Going forward, we expect SSML to report a net sales
CAGR of ~12% to ~`2,040cr and adj.net profit CAGR of ~14% to `115cr over
FY2016-18E. The same would be on the back of market leadership in blended
Abs.(%)
3m 1yr
3yr
fabrics, strong branding, wide distribution channel, strong presence in tier II and
Sensex
7.4
9.7
43.3
tier III cities and emphasis on latest designs at affordable pricing points. At the
SSML
20.7
23.9
537.0
current market price, SSML trades at an inexpensive valuation (at a P/E of 10.2x
its FY2018E earnings). We have a Buy rating on the stock and target price of
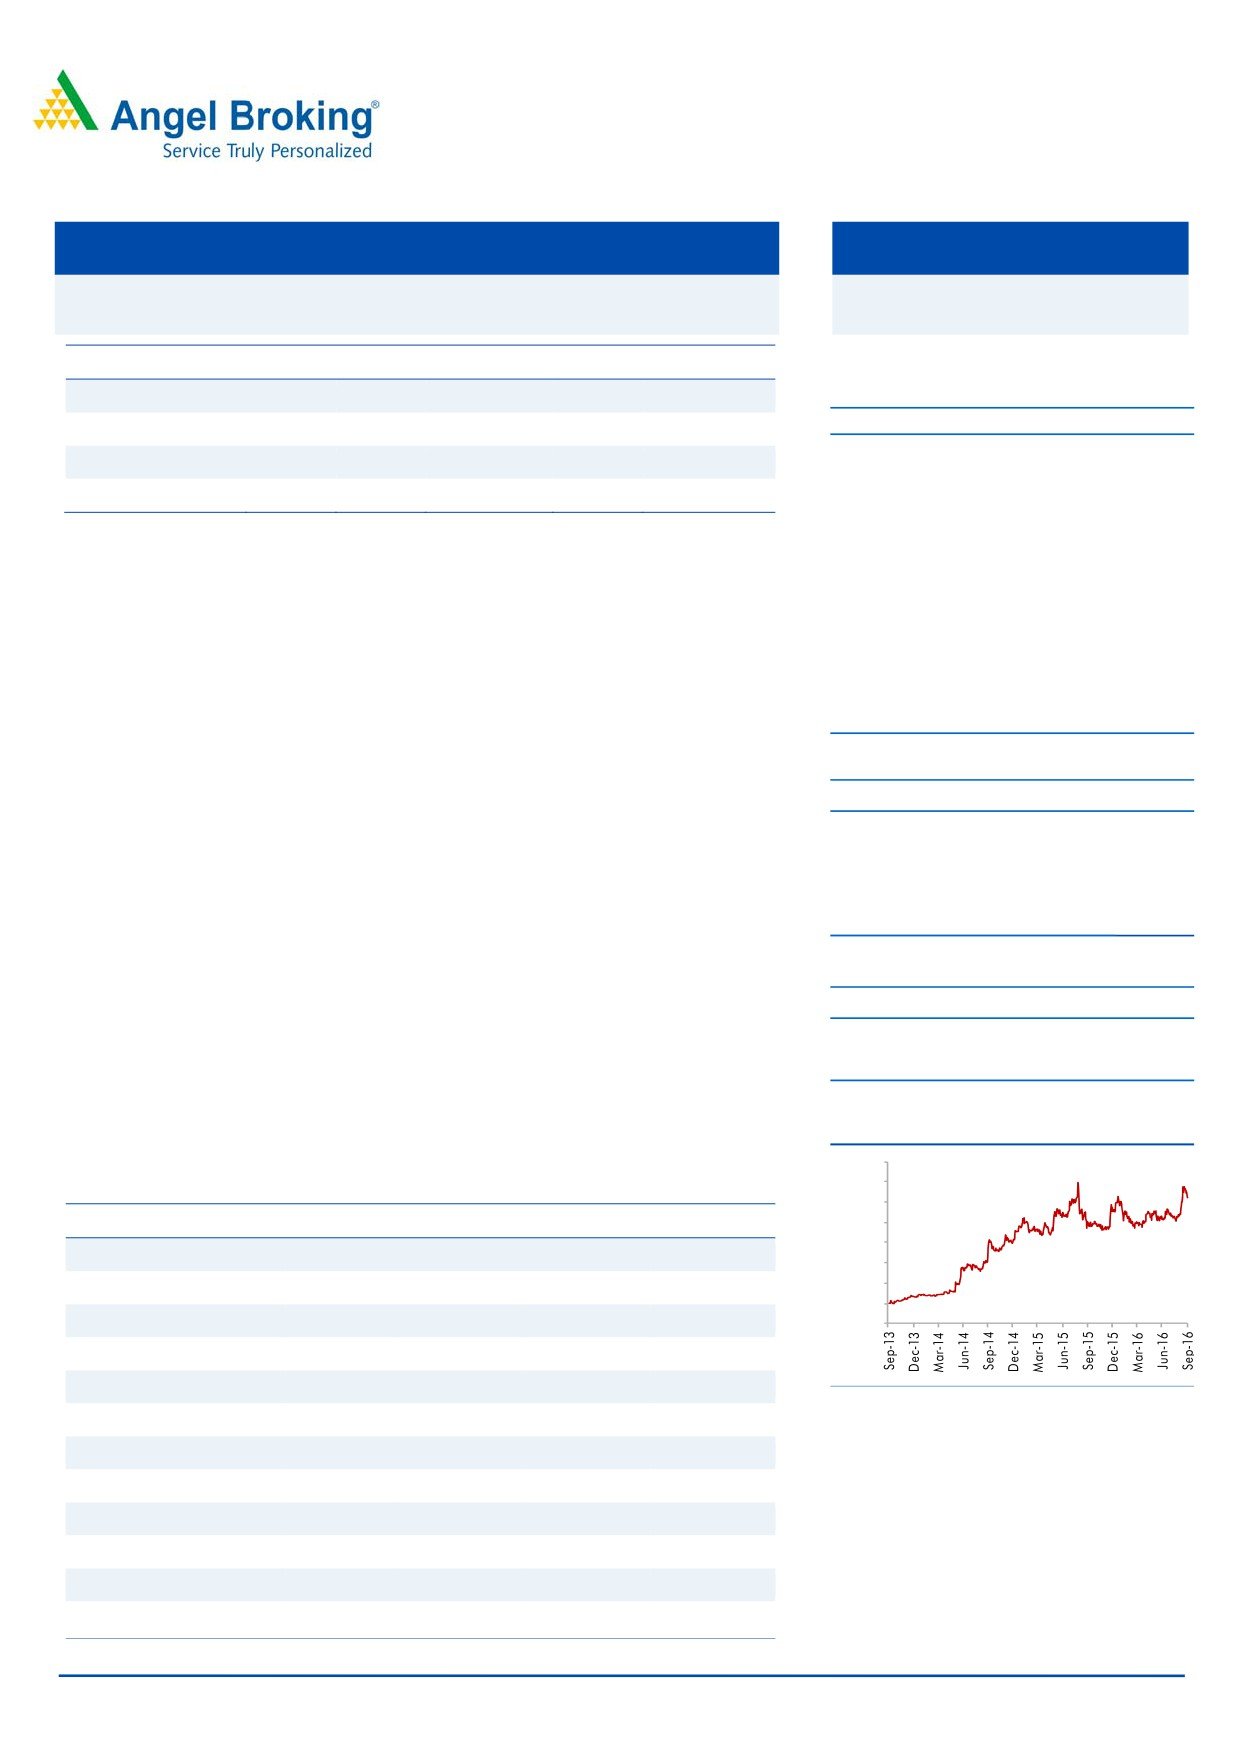
3-Year Daily price chart
`1,469.
1,600
1,400
Key financials
1,200
Y/E March (` cr)
FY2015
FY2016
FY2017E
FY2018E
1,000
800
Net Sales
1,510
1,619
1,799
2,040
600
400
% chg
15.9
7.2
11.1
13.4
200
Net Profit
79
88
98
115
0
% chg
78.8
87.6
98.3
114.7
OPM (%)
11.5
11.6
11.6
11.7
Source: Company, Angel Research
EPS (`)
84.1
93.5
104.9
122.4
P/E (x)
14.9
13.4
11.9
10.2
P/BV (x)
2.7
2.3
2.0
1.7
RoE (%)
18.1
17.1
16.4
16.4
RoCE (%)
17.9
16.3
16.5
17.7
EV/Sales (x)
1.0
0.9
0.8
0.7
Amarjeet S Maurya
022-39357800 Ext: 6868
EV/EBITDA (x)
8.5
8.0
7.3
6.3
Source: Company,Angel Research; Note: CMP as of September 14, 2016,
Please refer to important disclosures at the end of this report
1
Siyaram Silk Mills | 1QFY2017 Result Update
Exhibit 1: Quarterly performance
Y/E March (` cr)
1QFY17
1QFY16
% chg. (yoy)
4QFY16
% chg. (qoq)
FY2016
FY2015
% chg
Net Sales
281
298
(5.4)
505
(44.3)
1,619
1,510
7.2
Net raw material
122
137
(10.9)
267
(54.2)
810
794
2.0
(% of Sales)
43.5
46.2
(269)
52.9
(942)
50.0
52.6
Employee Cost
37
32
13.8
43
(13.6)
144
123
16.8
(% of Sales)
13.1
10.9
222
8.5
466
8.9
8.2
Other Expenses
92
97
(4.4)
135
(31.5)
478
419
14.1
(% of Sales)
32.8
32.5
36
26.7
613
29.5
27.7
Total Expenditure
252
266
(5.5)
445
(43.4)
1,432
1,336
7.2
Operating Profit
30
31
(4.4)
60
(50.7)
188
174
8
OPM (%)
10.6
10.4
11
11.9
(137)
11.6
11.5
6
Interest
9
7
32.5
8
7.9
30
31
(0.3)
Depreciation
11
10
11.7
11
3.0
42
41
1.6
Other Income
6
4
25.0
4
31.2
17
16
5.5
PBT
15
19
(19.0)
46
(66.3)
133
119
11.6
(% of Sales)
5.5
6.4
9.0
8.2
7.9
Tax
5
6
(12.7)
14
(60.5)
45
40
12.5
(% of PBT)
34.7
32.2
29.7
34.0
33.8
Reported PAT
10.03
12.86
(22.0)
32.05
(68.7)
88
79
11.1
PATM
3.6
4.3
6.3
5.4
5.2
Source: Company, Angel Research
September 15, 2016
2
Siyaram Silk Mills | 1QFY2017 Result Update
Investment arguments
Leadership in blended fabric to support growth
Revenue to grow at a CAGR of 12%
SSML is the largest manufacturer of blended high fashion suitings, shirtings and
over FY2016-18E to `2,040cr
apparels in the country. A portfolio of strong and value-for-money brands like
Siyaram’s, J Hampstead and Mistair in the fabric segment place SSML in a sweet
spot. The company has launched two new premium cotton brands - Zenesis and
Moretti, and has penetrated further into new growth areas like cotton shirting,
linen fabrics etc.
SSML has been able to differentiate itself from unorganized and organized
competitors in a highly fragmented market. The offerings of the company are
available at various price points in the low and mid-range which enable it to
compete with brands like Raymond, Reid & Taylor, Grasim, Digjam, and Gwalior,
which offer similar products. Shifting preference of consumers from unbranded
fabrics to branded blended fabrics would likely aid the company’s growth
prospects. With a strong market position, pan-India presence and high brand
recognition, along with increasing diversification in revenue profile, we expect the
company’s revenue to grow at a CAGR of 12% over FY2016-18E to `2040cr.
Rigorous advertisement and retail expansion to push demand
SSML has built a strong brand presence in the country through continuous
advertisement and brand-building efforts. Its emphasis on latest fabrics, innovative
and latest designs and affordable pricing points give it an edge over competition.
Every brand of the company holds a distinct position in the consumers’ minds
which has helped the company in creating a niche for itself in a highly competitive
industry.
Additionally, the company has been spending rigorously on advertising for the
recognition of its brands. The company has signed up celebrities like M S Dhoni
(Siyaram’s, MSD), Saif Ali Khan (Oxemberg) and Hrithik Roshan (J. Hampstead) as
brand ambassadors for its products.
Moreover, SSML has one of the largest distribution networks in the country with
over 1,600 dealers and 500 agents supplying to more than 40,000 outlets across
India. This enables the company to launch new products with a high success ratio
and low marketing cost, giving it an edge over competition. In order to expand its
retail footprint, the company continues to add stores through the franchise model.
The company plans to increase the number of stores through franchisees to 500 by
FY2017.
Venturing into women’s segment - a long term growth driver
Company has roped in celebrities like
The company has ventured into the salwar kameez and ethnic women’s wear
Parineeti Chopra and Karishma Kapoor
segment with its brand - Siya. The Siya brand comprises of semi-stitched cotton,
to endorse Siya
polyester and embroidered designer fabrics, with prices ranging from `700 to
`7,000. For FY2015, the company generated a revenue of ~`38cr from the
segment and it plans to grow it to `500cr in the coming four to five years as there
are hardly any national-level mass brands in the category. SSML has roped in
celebrities Parineeti Chopra and Karishma Kapoor to endorse the brand. As per
industry reports (Technopak study in 2011), salwar kameez and ethnic women’s
September 15, 2016
3
Siyaram Silk Mills | 1QFY2017 Result Update
wear is a `20,690cr category, growing at a CAGR of 10%, which gives immense
opportunity to the company.
Outlook and valuation
Going forward, we expect SSML to report a net sales CAGR of ~12% to
~`2,040cr and adj.net profit CAGR of ~14% to `115cr over FY2016-18E. The
same would be on the back of market leadership in blended fabrics, strong
branding, wide distribution channel, strong presence in tier II and tier III cities and
emphasis on latest designs at affordable pricing points. At the current market
price, SSML trades at an inexpensive valuation (at a P/E of 10.2x its FY2018E
earnings). We have a Buy rating on the stock and target price of `1,469.
Concerns
Decline in rural spending: Unseasonal rains or deficient rainfall in the rural areas
may result in lower agriculture output. This in turn could result in lower
discretionary spending among rural consumers which could impact the company’s
overall sales.
Competition from the unorganized sector: SSML, being in a sector that’s highly
fragmented, faces intense competition from unorganized players as they usually
sell their products at a much cheaper rate compared to it. However, due to strong
branding efforts, huge distribution network and affordable price points, the
company is easily able to differentiate its products from those of competitors.
Fluctuation in raw material prices: SSML operates in a highly price-sensitive
market. Any fluctuation in raw-material prices can lead to margin compression, as
the company may not be able to pass on the entire increase to the end-user.
September 15, 2016
4
Siyaram Silk Mills | 1QFY2017 Result Update
Company background
SSML is the largest manufacturer of blended fabrics in India. The company enjoys
a strong brand presence across the country, with brands such as Siyaram’s,
Mistair, MSD, J. Hampstead and Oxemberg in its kitty. The company has also
launched three premium brands - Royal Linen (linen fabrics for men and women),
Moretti (cotton shirting) and Zenesis (cotton suitings). SSML has built a strong
brand presence in the country through continuous advertisement and brand-
building efforts over the past 30 years. The company has created a niche for itself
in a highly competitive industry.
It has a wide distribution network comprising 1,600 dealers and 500 agents
supplying to more than 40,000 outlets across India and has ~160 franchise
stores. The company operates four plants - one at Tarapur near Mumbai for
weaving and yarn dyeing, two at Daman for garments and one at Silvassa for
weaving.
September 15, 2016
5
Siyaram Silk Mills | 1QFY2017 Result Update
Profit and loss statement
Y/E March (` cr)
FY13
FY14
FY15
FY16
FY17E
FY18E
Total operating income
1,041
1,303
1,510
1,619
1,799
2,040
% chg
13.7
25.2
15.9
7.2
11.1
13.4
Total Expenditure
931
1,163
1,336
1,432
1,590
1,801
Cost of Materials
532
671
794
810
948
1,077
Personnel
89
108
123
144
151
173
Others Expenses
310
384
419
478
491
550
EBITDA
110
140
174
188
209
240
% chg
(5.4)
27.1
24.3
7.8
11.2
14.8
(% of Net Sales)
10.6
10.7
11.5
11.6
11.6
11.7
Depreciation& Amortisation
22
29
41
42
44
45
EBIT
88
111
133
146
165
194
% chg
(6.1)
25.5
20.1
9.6
12.9
17.6
(% of Net Sales)
8.5
8.5
8.8
9.0
9.2
9.5
Interest & other Charges
25
29
31
30
35
40
Other Income
19
16
16
17
17
17
(% of PBT)
22.6
16.1
13.6
12.9
11.7
10.0
Share in profit of Associates
-
-
-
-
-
-
Recurring PBT
82
98
119
133
147
171
% chg
0.7
19.8
21.4
11.6
10.5
16.7
Prior Period & Extra. Exp./(Inc.)
-
-
-
-
-
-
PBT (reported)
82
98
119
133
147
171
Tax
27
34
40
45
48
57
(% of PBT)
32.7
35.1
33.8
34.0
33.0
33.0
PAT (reported)
55
64
79
88
98
115
Add: Share of earnings of asso.
-
-
-
-
-
-
ADJ. PAT
55
64
79
88
98
115
% chg
55.0
63.6
78.8
87.6
98.3
114.7
(% of Net Sales)
5.3
4.9
5.2
5.4
5.5
5.6
Basic EPS (`)
58.7
67.8
84.1
93.5
104.9
122.4
Fully Diluted EPS (`)
58.7
67.8
84.1
93.5
104.9
122.4
% chg
(3.0)
15.6
23.9
11.1
12.3
16.7
September 15, 2016
6
Siyaram Silk Mills | 1QFY2017 Result Update
Balance sheet
Y/E March (` cr)
FY13
FY14
FY15
FY16
FY17E
FY18E
SOURCES OF FUNDS
Equity Share Capital
9
9
9
9
9
9
Reserves& Surplus
305
360
426
503
589
690
Shareholders Funds
314
370
435
512
599
699
Minority Interest
-
-
-
-
-
-
Total Loans
278
314
309
386
400
400
Deferred Tax Liability
22
26
23
23
23
23
Total Liabilities
614
709
767
920
1,021
1,122
APPLICATION OF FUNDS
Gross Block
499
570
589
609
639
659
Less: Acc. Depreciation
194
220
258
299
343
388
Net Block
305
349
332
310
297
271
Capital Work-in-Progress
16
3
7
7
7
7
Investments
0
0
0
46
46
46
Current Assets
466
543
638
773
900
1,054
Inventories
222
225
238
326
384
447
Sundry Debtors
200
260
335
368
419
486
Cash
3
6
5
6
7
8
Loans & Advances
33
39
45
57
72
92
Other Assets
8
13
15
16
18
20
Current liabilities
176
190
214
221
234
262
Net Current Assets
290
353
424
551
666
792
Deferred Tax Asset
3
3
4
4
4
4
Mis. Exp. not written off
-
-
-
-
-
-
Total Assets
614
709
767
920
1,021
1,122
September 15, 2016
7
Siyaram Silk Mills | 1QFY2017 Result Update
Cash flow statement
Y/E March (` cr)
FY13
FY14
FY15
FY16
FY17E
FY18E
Profit before tax
82
98
119
133
147
171
Depreciation
22
29
41
42
44
45
Change in Working Capital
(28)
(87)
(120)
(127)
(113)
(125)
Interest / Dividend (Net)
17
19
21
30
35
40
Direct taxes paid
(25)
(34)
(40)
(45)
(48)
(57)
Others
1
41
38
-
-
-
Cash Flow from Operations
68
65
58
33
64
76
(Inc.)/ Dec. in Fixed Assets
(70)
(61)
(23)
(112)
(30)
(20)
(Inc.)/ Dec. in Investments
3
-
-
(46)
-
-
Cash Flow from Investing
(73)
(61)
(23)
(66)
(30)
(20)
Issue of Equity
-
0
-
-
-
-
Inc./(Dec.) in loans
-
-
-
76
14
-
Dividend Paid (Incl. Tax)
(7)
(7)
(7)
11
12
14
Interest / Dividend (Net)
14
5
(30)
(52)
(59)
(68)
Cash Flow from Financing
7
(2)
(38)
35
(33)
(54)
Inc./(Dec.) in Cash
2
3
(2)
2
1
2
Opening Cash balances
2
3
5
3
6
7
Closing Cash balances
3
5
3
6
7
8
September 15, 2016
8
Siyaram Silk Mills | 1QFY2017 Result Update
Key ratios
Y/E March
FY13
FY14
FY15
FY16
FY17E
FY18E
Valuation Ratio (x)
P/E (on FDEPS)
21.3
18.4
14.9
13.4
11.9
10.2
P/CEPS
58.7
67.8
84.1
93.5
104.9
122.4
P/BV
3.7
3.2
2.7
2.3
2.0
1.7
Dividend yield (%)
0.6
0.6
0.7
0.8
0.9
1.1
EV/Sales
1.4
1.1
1.0
0.9
0.8
0.7
EV/EBITDA
13.1
10.6
8.5
8.0
7.3
6.3
EV / Total Assets
1.8
1.6
1.5
1.3
1.2
1.1
Per Share Data (`)
EPS (Basic)
58.7
67.8
84.1
93.5
104.9
122.4
EPS (fully diluted)
58.7
67.8
84.1
93.5
104.9
122.4
Cash EPS
18.0
15.6
12.6
11.3
10.1
8.6
DPS
7.0
7.5
9.4
10.5
11.8
13.8
Book Value
335.2
394.5
464.2
546.4
638.8
746.5
Returns (%)
ROCE
14.9
16.2
17.9
16.3
16.5
17.7
Angel ROIC (Pre-tax)
15.0
16.4
18.0
17.3
17.4
18.6
ROE
17.5
17.2
18.1
17.1
16.4
16.4
Turnover ratios (x)
Asset Turnover (Gross Block)
2.1
2.3
2.6
2.7
2.8
3.1
Inventory / Sales (days)
78
63
58
74
78
80
Receivables (days)
70
73
81
83
85
87
Payables (days)
42
34
34
34
34
34
WC cycle (ex-cash) (days)
106
102
105
123
129
133
September 15, 2016
9
Siyaram Silk Mills | 1QFY2017 Result Update
Research Team Tel: 022 - 39357800
DISCLAIMER
Angel Broking Private Limited (hereinafter referred to as “Angel”) is a registered Member of National Stock Exchange of India Limited,
Bombay Stock Exchange Limited and Metropolitan Stock Exchange Limited. It is also registered as a Depository Participant with CDSL
and Portfolio Manager with SEBI. It also has registration with AMFI as a Mutual Fund Distributor. Angel Broking Private Limited is a
registered entity with SEBI for Research Analyst in terms of SEBI (Research Analyst) Regulations, 2014 vide registration number
INH000000164. Angel or its associates has not been debarred/ suspended by SEBI or any other regulatory authority for accessing
/dealing in securities Market. Angel or its associates/analyst has not received any compensation / managed or co-managed public
offering of securities of the company covered by Analyst during the past twelve months.
This document is solely for the personal information of the recipient, and must not be singularly used as the basis of any investment
decision. Nothing in this document should be construed as investment or financial advice. Each recipient of this document should
make such investigations as they deem necessary to arrive at an independent evaluation of an investment in the securities of the
companies referred to in this document (including the merits and risks involved), and should consult their own advisors to determine
the merits and risks of such an investment.
Reports based on technical and derivative analysis center on studying charts of a stock's price movement, outstanding positions and
trading volume, as opposed to focusing on a company's fundamentals and, as such, may not match with a report on a company's
fundamentals. Investors are advised to refer the Fundamental and Technical Research Reports available on our website to evaluate the
contrary view, if any.
The information in this document has been printed on the basis of publicly available information, internal data and other reliable
sources believed to be true, but we do not represent that it is accurate or complete and it should not be relied on as such, as this
document is for general guidance only. Angel Broking Pvt. Limited or any of its affiliates/ group companies shall not be in any way
responsible for any loss or damage that may arise to any person from any inadvertent error in the information contained in this report.
Angel Broking Pvt. Limited has not independently verified all the information contained within this document. Accordingly, we cannot
testify, nor make any representation or warranty, express or implied, to the accuracy, contents or data contained within this document.
While Angel Broking Pvt. Limited endeavors to update on a reasonable basis the information discussed in this material, there may be
regulatory, compliance, or other reasons that prevent us from doing so.
This document is being supplied to you solely for your information, and its contents, information or data may not be reproduced,
redistributed or passed on, directly or indirectly.
Neither Angel Broking Pvt. Limited, nor its directors, employees or affiliates shall be liable for any loss or damage that may arise from
or in connection with the use of this information.
Disclosure of Interest Statement
Siyaram Silk Mills
1. Financial interest of research analyst or Angel or his Associate or his relative
No
2. Ownership of 1% or more of the stock by research analyst or Angel or associates or relatives
No
3. Served as an officer, director or employee of the company covered under Research
No
4. Broking relationship with company covered under Research
No
Ratings (Based on expected returns
Buy (> 15%)
Accumulate (5% to 15%)
Neutral (-5 to 5%)
over 12 months investment period):
Reduce (-5% to -15%)
Sell (< -15)
September 15, 2016
10