3QFY2016 Result Update | Textile
January 28, 2016
Siyaram Silk Mills
BUY
CMP
`1,104
Performance Highlights
Target Price
`1,354
Y/E March (` cr)
3QFY16
3QFY15
% chg. (yoy) 2QFY16
% chg. (qoq)
Investment Period
12 Months
Net Sales
416
330
25.9
398
4.4
Operating profit
47
35
34.9
50
(6.1)
Stock Info
Sector
Textile
OPM (%)
11.3
10.5
76bp
12.5
(126bp)
Market Cap (` cr)
1,069
Adj. PAT
21
13
60.0
23
(9.7)
Net debt (` cr)
276
Source: Company, Angel Research
Beta
1.0
52 Week High / Low
1400 / 857
Siyaram Silk Mills (SSML)’ results for 3QFY2016 have come in above our
Avg. Daily Volume
1,164
estimates. The company has reported a healthy top-line and bottom-line growth.
Face Value (`)
10
Healthy top-line growth: The top-line for the quarter grew by 26% yoy to `416cr.
BSE Sensex
24,492
Nifty
7,438
Underperformance at the EBITDA level: The EBITDA for the quarter grew by
Reuters Code
SIYR.BO
~35% yoy to `47cr and the EBITDA margin expanded by 76bp yoy to 11.3%. The
Bloomberg Code
SIYA IN
employee cost as a percentage of sales declined by 125bp yoy to 8.1% but the
raw material cost as a percentage of sales increased by 56bp yoy.
Shareholding Pattern (%)
Strong PAT growth: During the quarter, the net profit grew 60% yoy to `21cr
Promoters
67.1
MF / Banks / Indian Fls
6.3
on the back of healthy sales growth and operating margin improvement.
FII / NRIs / OCBs
0.8
Outlook and Valuation: Going forward, we expect SSML to report a net sales
Indian Public / Others
25.9
CAGR of ~10% to ~`1,815cr and adj.net profit CAGR of ~12% to `98cr over
FY2015-17E. The same would be on the back of market leadership in blended
Abs.(%)
3m 1yr
3yr
fabrics, strong branding, a wide distribution channel, strong presence in tier II
Sensex
(10.1)
(17.2)
21.8
and tier III cities and emphasis on latest designs at affordable pricing points. At
SSML
15.9
15.9
282.0
the current market price, SSML trades at an inexpensive valuation (at a P/E of
10.9x its FY2017E earnings). We have a Buy rating on the stock and target price
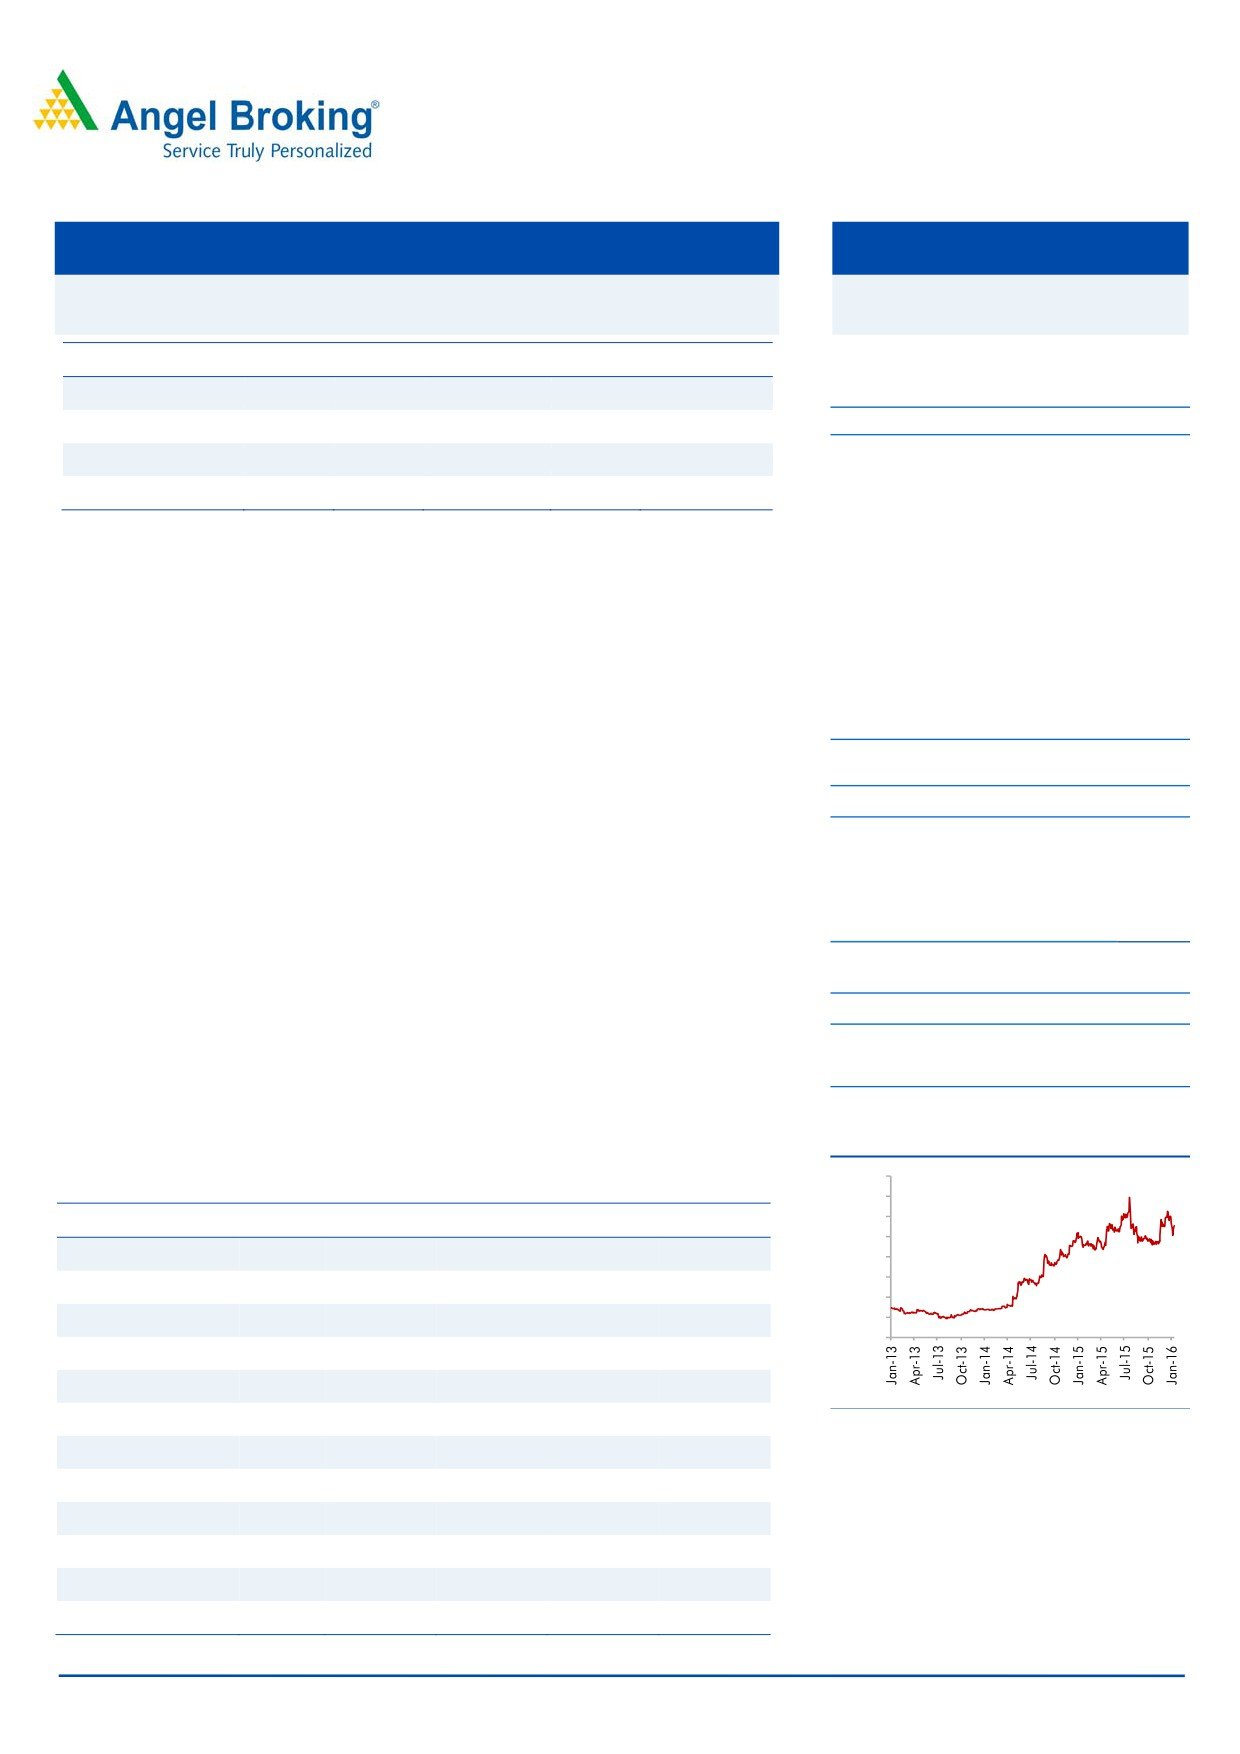
3-Year Daily price chart
of `1,354.
1600
Key financials
1400
1200
Y/E March (` cr)
FY2013
FY2014
FY2015
FY2016E
FY2017E
1000
Net Sales
1,041
1,303
1,510
1,636
1,815
800
600
% chg
13.7
25.2
15.9
8.3
10.9
400
Adj. Net Profit
55
64
79
84
98
200
0
% chg
(3.1)
15.6
23.9
7.0
15.8
OPM (%)
10.6
10.7
11.5
11.5
11.5
EPS (`)
58.8
68.6
84.1
89.9
104.1
Source: Company, Angel Research
P/E (x)
19.4
16.8
13.6
12.7
10.9
P/BV (x)
3.4
2.9
2.5
2.1
1.8
RoE (%)
18.9
18.6
19.6
17.9
17.8
RoCE (%)
15.2
16.4
17.7
16.9
17.4
Amarjeet S Maurya
EV/Sales (x)
1.3
1.0
0.9
0.8
0.7
022-39357800 Ext: 6868
EV/EBITDA (x)
11.9
9.6
7.7
7.0
6.3
Source: Company, Angel Research; Note: CMP as of January 27, 2015
Please refer to important disclosures at the end of this report
1
Siyaram Silk Mills | 3QFY2016 Result Update
Exhibit 1: Quarterly performance
Y/E March (` cr)
3QFY16
3QFY15
% chg. (yoy)
2QFY16
% chg. (qoq)
9MFY16
9MFY15
% chg
Net Sales
416
330
25.9
398
4.4
1,114
1,030
8.2
Net raw material
212
167
27.2
193
9.8
543
516
5.2
(% of Sales)
51.1
50.5
56
48.6
251
48.7
50.1
Employee Cost
34
31
9.1
35
(2.6)
101
91
11.8
(% of Sales)
8.1
9.4
(125)
8.7
(59)
9.1
8.8
Other Expenses
123
98
25.6
120
2.2
343
308
11.3
(% of Sales)
29.6
29.6
(7)
30.2
(66)
30.8
29.9
Total Expenditure
369
296
24.8
348
5.9
987
915
7.9
Operating Profit
47
35
34.9
50
(6.1)
127
116
10
OPM (%)
11.3
10.5
76
12.5
(126)
11.4
11.2
20
Interest
8
8
(0.6)
7
12.2
22
24
(7.1)
Depreciation
10
10
5.9
11
(3.1)
31
31
0.3
Other Income
5
5
(8.9)
4
24.4
13
12
3.4
PBT
33
22
51.1
36
(7.5)
87
74
18.6
(% of Sales)
7.9
6.6
8.9
7.8
7.1
Tax
12
9
37.8
12
(3.5)
32
27
17.8
(% of PBT)
36.6
40.1
35.1
36.3
36.6
Reported PAT
21
13
60.0
23
(9.7)
56
47
19.0
PATM (%)
5.0
3.9
5.8
5.0
4.5
Source: Company, Angel Research
January 28, 2016
2
Siyaram Silk Mills | 3QFY2016 Result Update
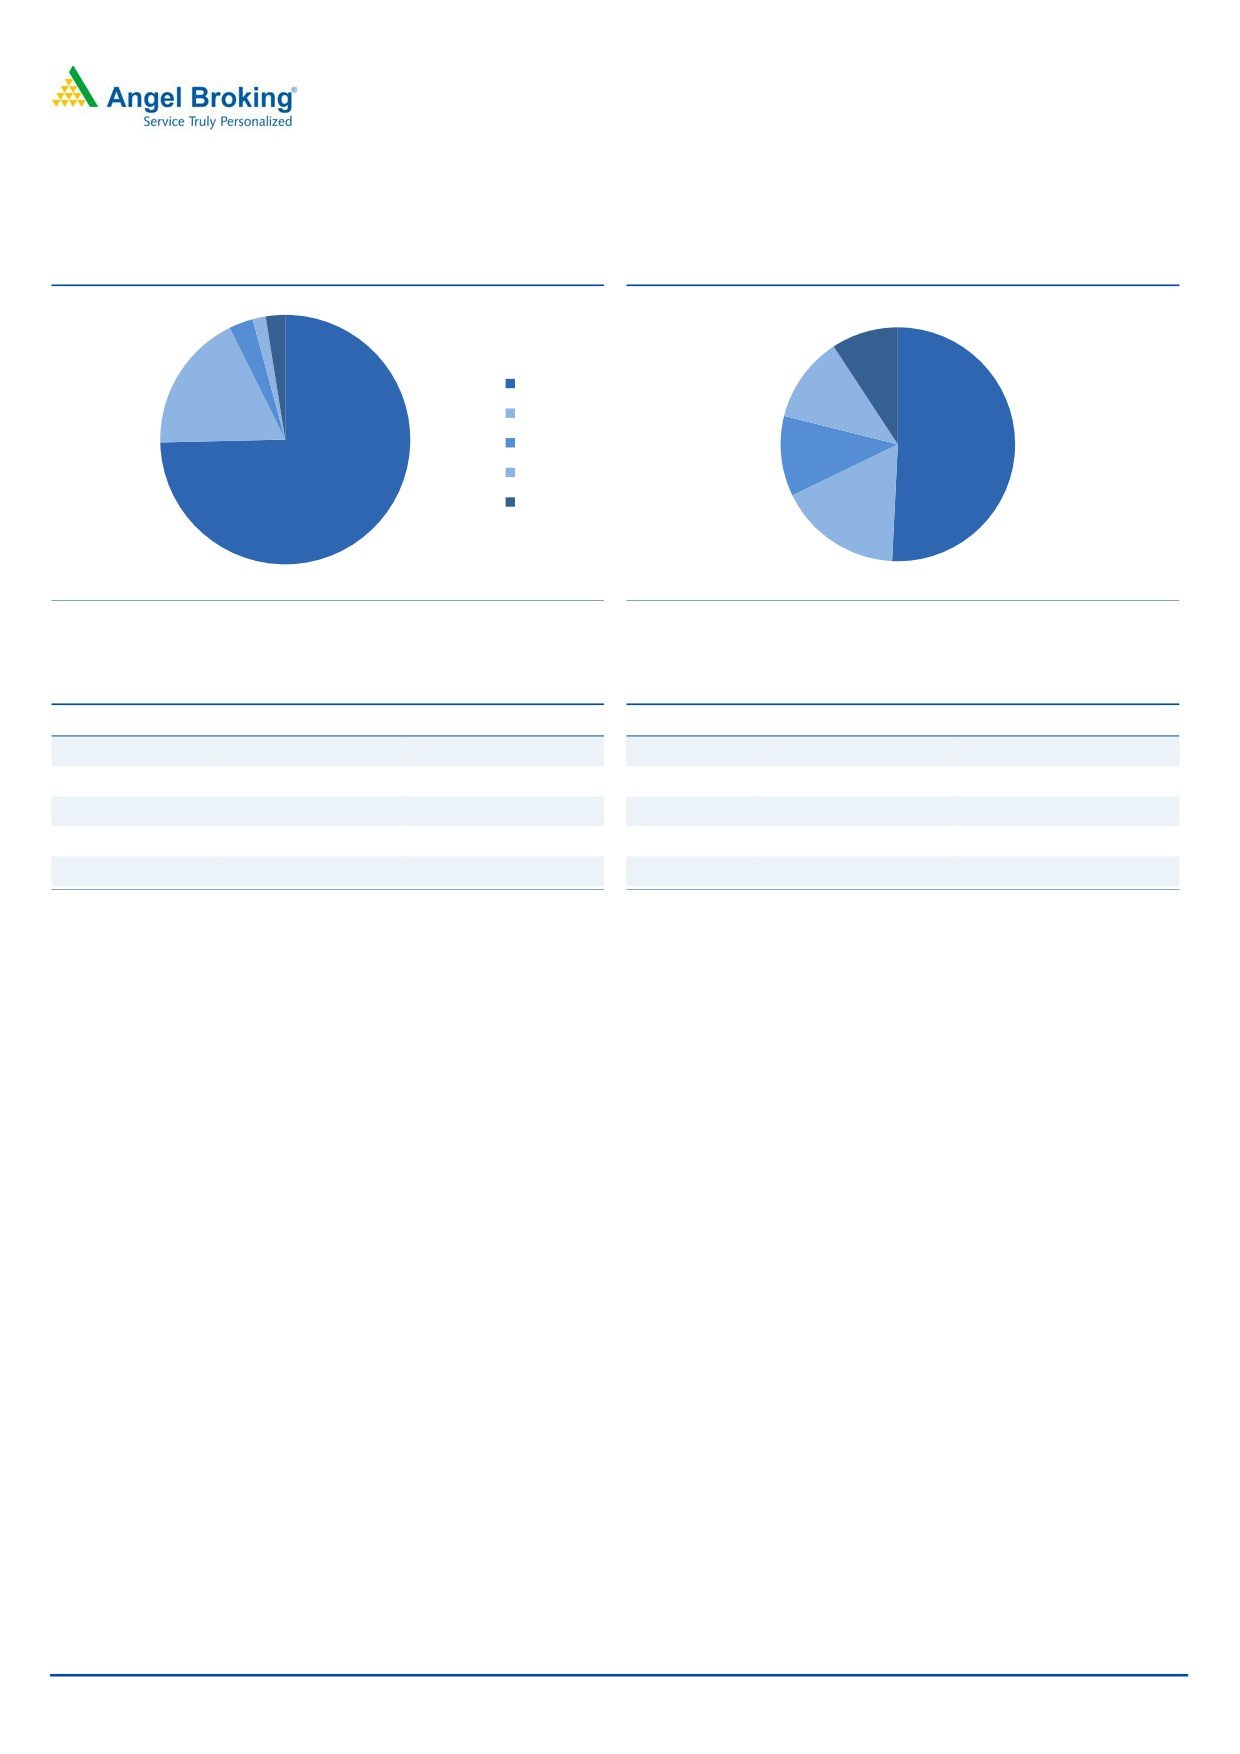
Segmental performance
Exhibit 2: Sales break-up (FY2015)
Exhibit 3: Fabric segment break-up (FY2015)
3% 2% 2%
Cotton
Brands,9%
Mistair,12%
Fabric
18%
Garment
Yarn
J.Hampstead,1
Suiting,51%
1%
Furnishing
SKD
Shirting,17%
75%
Source: Company, Angel Research
Source: Company, Angel Research
Exhibit 4: Volume and Realization growth - FY2015
Exhibit 5: Volume and Realization growth - FY2015
All Segments
Volume Growth (yoy) Realization growth (yoy)
Fabric Segment
Volume Growth (yoy)
Realization growth (yoy)
Fabric
9.4
3.3
Suiting
5.7
(0.1)
Garment
16.7
9.6
Shirting
19.7
22.2
Yarn
(14.6)
19.8
J.Hampstead
19.6
5.6
Furnishing
(22.0)
36.5
Mistair
11.9
(7.3)
SKD
90.3
(15.4)
Cotton Brands
(20.3)
37.3
Source: Company, Angel Research
Source: Company, Angel Research
January 28, 2016
3
Siyaram Silk Mills | 3QFY2016 Result Update
Investment arguments
Leadership in blended fabric to support growth
Revenue to grow at a CAGR of 9.6%
SSML is the largest manufacturer of blended high fashion suitings, shirtings and
over FY2015-17E to `1,815cr
apparels in the country. A portfolio of strong and value-for-money brands like
Siyaram’s, J Hampstead and Mistair in the fabric segment place SSML in a sweet
spot. The company has launched two new premium cotton brands - Zenesis and
Moretti, and has penetrated further into new growth areas like cotton shirting,
linen fabrics etc.
SSML has been able to differentiate itself from unorganized and organized
competitors in a highly fragmented market. The offerings of the company are
available at various price points in the low and mid-range which enable it to
compete with brands like Raymond, Reid & Taylor, Grasim, Digjam, and Gwalior,
which offer similar products. Shifting preference of consumers from unbranded
fabrics to branded blended fabrics would likely aid the company’s growth
prospects. With a strong market position, pan-India presence and high brand
recognition, along with increasing diversification in revenue profile, we expect the
company’s revenue to grow at a CAGR of 9.6% over FY2015-17E to `1,815cr.
Rigorous advertisement and retail expansion to push demand
SSML has built a strong brand presence in the country through continuous
advertisement and brand-building efforts. Its emphasis on latest fabrics, innovative
and latest designs and affordable pricing points give it an edge over competition.
Every brand of the company holds a distinct position in the consumers’ minds
which has helped the company in creating a niche for itself in a highly competitive
industry.
Additionally, the company has been spending rigorously on advertising for the
recognition of its brands. The company has signed up celebrities like M S Dhoni
(Siyaram’s, MSD), Saif Ali Khan (Oxemberg) and Hrithik Roshan (J. Hampstead) as
brand ambassadors for its products. In FY2014, the company spent ~`36cr on
advertising.
Moreover, SSML has one of the largest distribution networks in the country with
over 1,600 dealers and 500 agents supplying to more than 40,000 outlets across
India. This enables the company to launch new products with a high success ratio
and low marketing cost, giving it an edge over competition. In order to expand its
retail footprint, the company continues to add stores through the franchise model
(franchisees invest ~`25lakh on an average for interior works and inventory with
minimum space requirement being 800 sq ft). The company plans to increase the
number of stores through franchisees to 500 by FY2017E.
Venturing into women’s segment - a long term growth driver
Company has roped in celebrities like
The company has ventured into the salwar kameez and ethnic women’s wear
Parineeti Chopra and Karishma Kapoor
segment with its brand - Siya. The Siya brand comprises of semi-stitched cotton,
to endorse Siya
polyester and embroidered designer fabrics, with prices ranging from `700 to
`7,000. For FY2015, the company generated a revenue of ~`38cr from the
segment and it plans to grow it to `500cr in the coming four to five years as there
are hardly any national-level mass brands in the category. SSML has roped in
January 28, 2016
4
Siyaram Silk Mills | 3QFY2016 Result Update
celebrities Parineeti Chopra and Karishma Kapoor to endorse the brand. As per
industry reports (Technopak study in 2011), salwar kameez and ethnic women’s
wear is a `20,690cr category, growing at a CAGR of 10%, which gives immense
opportunity to the company.
Outlook and valuation
Going forward, we expect SSML to report a net sales CAGR of ~10% to
~`1,815cr and adj.net profit CAGR of ~12% to `98cr over FY2015-17E on back
of market leadership in blended fabrics, strong branding, wide distribution
channel, strong presence in tier II and tier III cities and emphasis on latest designs
and affordable pricing points. At the current market price, SSML trades at an
inexpensive valuation (at a P/E of 10.9x its FY2017E earnings). We have a Buy
rating on the stock and target price of `1,354.
Concerns
Decline in rural spending: Unseasonal rains and deficient rainfall in the rural
areas may result in lower agriculture output. This in turn could result in lower
discretionary spending among rural consumers which could impact the company’s
overall sales.
Competition from the unorganized sector: SSML, being in a sector that’s highly
unorganized, faces intense competition from unorganized players as they usually
sell their products at a much cheaper rate compared to it. However, due to strong
branding efforts, huge distribution network and affordable price points, the
company is easily able to differentiate its products from those of competitors.
Fluctuation in raw material prices: SSML operates in a highly price-sensitive
market. Any fluctuation in raw-material prices can lead to margin compression, as
the company may not be able to pass on the entire increase to the end-user.
January 28, 2016
5
Siyaram Silk Mills | 3QFY2016 Result Update
Company background
SSML is the largest manufacturer of blended fabrics in India. The company enjoys
a strong brand presence across the country, with brands such as Siyaram’s,
Mistair, MSD, J. Hampstead and Oxemberg in its kitty. The company has also
launched three premium brands - Royal Linen (linen fabrics for men and women),
Moretti (cotton shirting) and Zenesis (cotton suitings). SSML has built a strong
brand presence in the country through continuous advertisement and brand-
building efforts over the past 30 years. The company has created a niche for itself
in a highly competitive industry.
It has a wide distribution network comprising 1,600 dealers and 500 agents
supplying to more than 40,000 outlets across India and has ~160 franchise
stores. The company operates four plants - one at Tarapur near Mumbai for
weaving and yarn dyeing, two at Daman for garments and one at Silvassa for
weaving.
January 28, 2016
6
Siyaram Silk Mills | 3QFY2016 Result Update
Profit and loss statement
Y/E Mar. (` cr)
FY2013
FY2014
FY2015
FY2016E
FY2017E
Net Sales
1,041
1,303
1,510
1,636
1,815
Other operating income
-
-
-
-
-
Total operating income
1,041
1,303
1,510
1,636
1,815
% chg
13.7
25.2
15.9
8.3
10.9
Net Raw Materials
532
671
794
860
955
% chg
15.7
26.2
18.3
8.3
10.9
Power and Fuel
19
27
32
34
38
% chg
21.5
37.9
18.0
8.3
10.9
Personnel
89
108
123
134
149
% chg
41.8
21.0
14.3
8.8
10.9
Other
290
357
387
419
465
% chg
11.6
23.0
8.3
8.2
10.9
Total Expenditure
931
1,163
1,336
1,448
1,606
EBITDA
110
140
174
188
209
% chg
(5.4)
27.1
24.3
8.0
10.9
(% of Net Sales)
10.6
10.7
11.5
11.5
11.5
Depreciation
22
29
41
47
49
EBIT
88
111
133
141
160
% chg
(6.2)
25.5
20.1
5.7
13.7
(% of Net Sales)
8.5
8.5
8.8
8.6
8.8
Interest & other Charges
25
29
31
32
33
Other Income
19
16
16
17
18
(% of Net Sales)
1.8
1.2
1.1
1.0
1.0
Recurring PBT
63
82
103
109
127
% chg
(9.9)
30.0
24.9
6.2
16.9
PBT (reported)
82
98
119
126
146
Tax
27
34
40
42
48
(% of PBT)
32.8
35.1
33.8
33.0
33.0
PAT (reported)
55
64
79
84
98
Extraordinary Expense/(Inc.)
-
-
-
-
-
ADJ. PAT
55
64
79
84
98
% chg
(3.1)
15.6
23.9
7.0
15.8
(% of Net Sales)
5.3
4.9
5.2
5.2
5.4
Basic EPS (`)
58.8
68.6
84.1
89.9
104.1
Fully Diluted EPS (`)
58.8
68.6
84.1
89.9
104.1
% chg
(0.5)
16.6
22.5
7.0
15.8
January 28, 2016
7
Siyaram Silk Mills | 3QFY2016 Result Update
Balance sheet
Y/E Mar. (` cr)
FY2013
FY2014
FY2015
FY2016E
FY2017E
SOURCES OF FUNDS
Equity Share Capital
9
9
9
9
9
Reserves& Surplus
305
360
426
499
581
Shareholders’ Funds
314
370
435
509
590
Total Loans
241
275
280
286
292
Other Long Term Liabilities
23
26
31
31
31
Long Term Provisions
5
6
7
7
7
Deferred Tax (Net)
19
22
19
16
16
Total liabilities
602
698
772
849
936
APPLICATION OF FUNDS
Gross Block
499
570
596
685
747
Less: Acc. Depreciation
194
220
261
308
357
Net Block
305
349
335
377
390
Capital Work-in-Progress
16
3
4
6
8
Goodwill
-
-
-
-
-
Investments
0
0
0
0
0
Long Term Loans and adv.
8
13
15
16
18
Other Non-current asset
-
-
-
-
-
Current Assets
458
530
623
672
769
Cash
3
6
5
31
54
Loans & Advances
33
39
45
49
54
Inventory
222
225
238
265
298
Debtors
200
260
335
327
363
Other current assets
0
0
0
0
0
Current liabilities
186
198
205
223
249
Net Current Assets
273
333
418
450
520
Misc. Exp. not written off
-
-
-
-
-
Total Assets
602
698
772
849
936
January 28, 2016
8
Siyaram Silk Mills | 3QFY2016 Result Update
Cash flow statement
Y/E Mar. (` cr)
FY2013 FY2014
FY2015 FY2016E FY2017E
Profit before tax
82
98
119
126
146
Depreciation
22
29
41
47
49
Change in Working Capital
(15)
(57)
(86)
(5)
(48)
Direct taxes paid
(27)
(34)
(40)
(42)
(48)
Others
6
30
(16)
(17)
(18)
Cash Flow from Operations
68
66
17
110
80
(Inc.)/Dec. in Fixed Assets
(97)
(58)
(27)
(91)
(63)
(Inc.)/Dec. in Investments
3
-
-
-
-
(Incr)/Decr In LT loans & adv.
12
(5)
(2)
(1)
(2)
Others
10
2
16
17
18
Cash Flow from Investing
(73)
(61)
(13)
(76)
(47)
Issue of Equity
-
0
-
-
-
Inc./(Dec.) in loans
26
34
5
6
6
Dividend Paid (Incl. Tax)
(8)
(9)
(11)
(13)
(16)
Others
(12)
(28)
1
-
-
Cash Flow from Financing
6
(3)
(5)
(8)
(11)
Inc./(Dec.) in Cash
1
2
(1)
26
23
Opening Cash balances
2
3
6
5
31
Closing Cash balances
3
6
5
31
54
January 28, 2016
9
Siyaram Silk Mills | 3QFY2016 Result Update
Key ratios
Y/E Mar.
FY2013
FY2014
FY2015
FY2016E
FY2017E
Valuation Ratio (x)
P/E (on FDEPS)
19.4
16.8
13.6
12.7
10.9
P/CEPS
13.9
11.5
8.9
8.1
7.3
P/BV
3.4
2.9
2.5
2.1
1.8
EV/Net sales
1.3
1.0
0.9
0.8
0.7
EV/EBITDA
11.9
9.6
7.7
7.0
6.3
EV / Total Assets
2.2
2.0
1.8
1.6
1.4
Per Share Data (`)
EPS (Basic)
58.7
67.8
84.1
89.9
104.1
EPS (fully diluted)
58.7
67.8
84.1
89.9
104.1
Cash EPS
81.9
98.9
127.7
140.3
155.9
DPS
7.5
8.0
10.0
12.0
15.0
Book Value
335
394
464
543
629
DuPont Analysis
EBIT margin
8.5
8.5
8.8
8.6
8.8
Tax retention ratio
0.7
0.6
0.7
0.7
0.7
Asset turnover (x)
1.8
2.0
2.0
2.1
2.1
ROIC (Post-tax)
10.6
10.8
11.9
11.9
12.5
Cost of Debt (Post Tax)
7.4
7.2
7.3
7.5
7.6
Leverage (x)
0.8
0.7
0.6
0.5
0.4
Operating ROE
12.9
13.4
14.8
14.0
14.5
Returns (%)
ROCE (Pre-tax)
15.2
16.4
17.7
16.9
17.4
Angel ROIC (Pre-tax)
15.7
16.6
17.9
17.7
18.7
ROE
18.9
18.6
19.6
17.9
17.8
Turnover ratios (x)
Asset TO (Gross Block)
2.3
2.4
2.6
2.6
2.5
Inventory / Net sales (days)
72
63
56
56
57
Receivables (days)
68
64
72
74
69
Payables (days)
76
60
55
54
54
WC cycle (ex-cash) (days)
94
92
100
93
94
Solvency ratios (x)
Net debt to equity
0.8
0.7
0.6
0.5
0.4
Net debt to EBITDA
2.2
1.9
1.6
1.4
1.1
Int. Coverage (EBIT/ Int.)
3.5
3.9
4.4
4.4
4.9
January 28, 2016
10
Siyaram Silk Mills | 3QFY2016 Result Update
Research Team Tel: 022 - 39357800
DISCLAIMER
Angel Broking Private Limited (hereinafter referred to as “Angel”) is a registered Member of National Stock Exchange of India Limited,
Bombay Stock Exchange Limited and Metropolitian Stock Exchange of India Limited. It is also registered as a Depository Participant
with CDSL and Portfolio Manager with SEBI. It also has registration with AMFI as a Mutual Fund Distributor. Angel Broking Private
Limited is a registered entity with SEBI for Research Analyst in terms of SEBI (Research Analyst) Regulations, 2014 vide registration
number INH000000164. Angel or its associates has not been debarred/ suspended by SEBI or any other regulatory authority for
accessing /dealing in securities Market. Angel or its associates including its relatives/analyst do not hold any financial
interest/beneficial ownership of more than 1% in the company covered by Analyst. Angel or its associates/analyst has not received any
compensation / managed or co-managed public offering of securities of the company covered by Analyst during the past twelve
months. Angel/analyst has not served as an officer, director or employee of company covered by Analyst and has not been engaged in
market making activity of the company covered by Analyst.
This document is solely for the personal information of the recipient, and must not be singularly used as the basis of any investment
decision. Nothing in this document should be construed as investment or financial advice. Each recipient of this document should
make such investigations as they deem necessary to arrive at an independent evaluation of an investment in the securities of the
companies referred to in this document (including the merits and risks involved), and should consult their own advisors to determine
the merits and risks of such an investment.
Reports based on technical and derivative analysis center on studying charts of a stock's price movement, outstanding positions and
trading volume, as opposed to focusing on a company's fundamentals and, as such, may not match with a report on a company's
fundamentals.
The information in this document has been printed on the basis of publicly available information, internal data and other reliable
sources believed to be true, but we do not represent that it is accurate or complete and it should not be relied on as such, as this
document is for general guidance only. Angel Broking Pvt. Limited or any of its affiliates/ group companies shall not be in any way
responsible for any loss or damage that may arise to any person from any inadvertent error in the information contained in this report.
Angel Broking Pvt. Limited has not independently verified all the information contained within this document. Accordingly, we cannot
testify, nor make any representation or warranty, express or implied, to the accuracy, contents or data contained within this document.
While Angel Broking Pvt. Limited endeavors to update on a reasonable basis the information discussed in this material, there may be
regulatory, compliance, or other reasons that prevent us from doing so.
This document is being supplied to you solely for your information, and its contents, information or data may not be reproduced,
redistributed or passed on, directly or indirectly.
Neither Angel Broking Pvt. Limited, nor its directors, employees or affiliates shall be liable for any loss or damage that may arise from
or in connection with the use of this information.
Note: Please refer to the important ‘Stock Holding Disclosure' report on the Angel website (Research Section). Also, please refer to the
latest update on respective stocks for the disclosure status in respect of those stocks. Angel Broking Pvt. Limited and its affiliates may
have investment positions in the stocks recommended in this report.
Disclosure of Interest Statement
Siyaram Silk Mills
1. Analyst ownership of the stock
No
2. Angel and its Group companies ownership of the stock
No
3. Angel and its Group companies' Directors ownership of the stock
No
4. Broking relationship with company covered
No
Note: We have not considered any Exposure below ` 1 lakh for Angel, its Group companies and Directors
Ratings (Based on expected returns
Buy (> 15%)
Accumulate (5% to 15%)
Neutral (-5 to 5%)
over 12 months investment period):
Reduce (-5% to -15%)
Sell (< -15%)
January 28, 2016
11