2QFY2016 Result Update | Infrastructure
November 17, 2015
Simplex Infrastructures
NEUTRAL
CMP
`319
Performance Highlights
Target Price
-
Quarterly highlights - Standalone
Investment Period
-
Y/E March (` cr)
2QFY16 1QFY16 2QFY15
% chg (yoy)
% chg (qoq)
Stock Info
Net sales
1,392
1,505
1,248
11.5
(7.5)
Sector
Infrastructure
EBITDA
143
147
128
12.3
(2.3)
Market Cap (` cr)
1,578
Reported PAT
14
18
13
6.4
(24.3)
Net debt (` cr)
3,172
Source: Company, Angel Research
Beta
1.1
Simplex Infrastructures (Simplex) reported in-line set of numbers for 2QFY2016.
52 Week High / Low
508/255
The company reported a top-line of `1,392cr, up 11.5% yoy, but slightly below
Avg. Daily Volume
6,558
Face Value (`)
2
our expectation of `1,399cr. The EBITDA for the quarter stood at `143cr, ahead
BSE Sensex
25,760
of our estimate of `141cr while the EBITDA margin expanded by 7bp yoy to
Nifty
7,807
10.3%, for 2QFY2016. Stronger execution and almost in-line operating
Reuters Code
SINF.BO
performance helped Simplex report a PAT of `14cr. The reported PAT margin of
Bloomberg Code
SINF@IN
the company was almost flat on a yoy basis at 1.0% in 2QFY2016.
Simplex’s order book (including L1) as of 2QFY2016 stands at ~`18,321cr
Shareholding Pattern (%)
(order book to LTM sales ratio stands at 3.1x).
Promoters
56.0
MF / Banks / Indian Fls
23.8
Outlook and valuation: At the current market price of `319, the standalone EPC
FII / NRIs / OCBs
6.1
business is trading at FY2016E and FY2017E P/E multiple of 20.3x and 10.1x,
Indian Public / Others
14.2
respectively.
(1)
10.6% top-line and
57.8% bottom-line CAGR during
FY2015-17E, (2) strong order book of `18,321cr (OB to LTM sales ratio of 3.1x),
and (3) scope for improvement in WC as % of sales ratio from 64% in FY2015 to
Abs. (%)
3m 1yr 3yr
Sensex
(7.6)
(8.6)
40.5
53% in FY2017E, should lead to improvement in D/E ratio from 2.2x in FY2015
Simplex Infra
(2.1)
2.2
69.4
to 1.8x in FY2017E. We have assigned a 1-year forward P/E multiple of 11.0x to
our FY2017E EPS estimates of `31/share, resulting in a value of `346 per share.
3-Year Daily Price Chart
Given the limited upside in the stock from the current levels, we have a Neutral
600
rating on the stock.
500
400
Key financials (Standalone)
300
Y/E March (` cr)
FY13
FY14
FY15
FY16E
FY17E
200
Net Sales
5,821
5,513
5,582
5,955
6,829
100
0
% chg
0.0
(5.3)
1.2
6.7
14.7
Net Profit
60
61
62
78
156
% chg
0.0
1.3
3.1
24.6
99.9
Source: Company, Angel Research
EBITDA (%)
8.0
9.4
10.1
10.3
10.5
EPS (`)
12
12
13
16
31
P/E (x)
26.4
26.0
25.3
20.3
10.1
P/BV (x)
1.2
1.1
1.1
1.1
1.0
RoE (%)
4.8
4.5
4.4
5.3
9.9
RoCE (%)
10.5
10.2
10.7
11.1
13.2
Yellapu Santosh
EV/Sales (x)
0.7
0.8
0.9
0.8
0.7
022 - 3935 7800 Ext: 6811
EV/EBITDA (x)
8.9
8.5
8.5
7.4
6.2
Source: Company, Angel Research; CMP as of November 16, 2015
Please refer to important disclosures at the end of this report
1
Simplex Infrastructures | 2QFY2016 Result Update
Exhibit 1: Quarterly Performance (Standalone)
Particulars (` cr)
2QFY16
1QFY16
% chg (qoq) 1QFY15
% chg (yoy) 1HFY16 1HFY15
% chg (yoy)
Net Sales
1,392
1,505
(7.5)
1,248
11.5
2,898
2,589
11.9
Total Expenditure
1,249
1,359
(8.1)
1,121
11.4
2,608
2,333
11.8
Cost of materials consumed
472
506
(6.7)
371
27.1
977
810
20.7
Sub-Contractor's Charges
400
456
(12.3)
361
10.8
856
743
15.1
Employee Benefits Expense
127
131
(3.1)
111
13.7
258
224
14.8
Other Expenses
251
266
(5.9)
277
(9.6)
517
555
(6.9)
EBITDA
143
147
(2.3)
128
12.3
290
256
13.4
EBIDTA %
10.3
9.7
10.2
10.0
9.9
Depreciation
34
34
1.7
37
(6.3)
68
72
(5.2)
EBIT
109
113
(3.5)
91
19.8
222
184
20.6
Interest and Financial Charges
106
106
0.3
93
14.0
212
184
15.0
Other Income
18
20
(10.2)
22
(16.4)
28
22
26.0
PBT before Exceptional Items
21
28
(23.0)
20
7.0
38
22
72.7
Exceptional Items
0
0
0
0
0
PBT after Exceptional Items
21
28
(23.0)
20
7.0
38
22
72.7
Tax
8
10
(20.5)
7
8.1
18
15
20.7
% of PBT
36.4
35.2
36.0
45.8
65.5
PAT
14
18
(24.3)
13
6.4
21
8
171.5
PAT %
1.0
1.2
1.0
0.7
0.3
EPS
2.74
3.62
(24.3)
2.58
6.2
6.36
5.14
23.7
Source: Company, Angel Research
Standalone Business Review
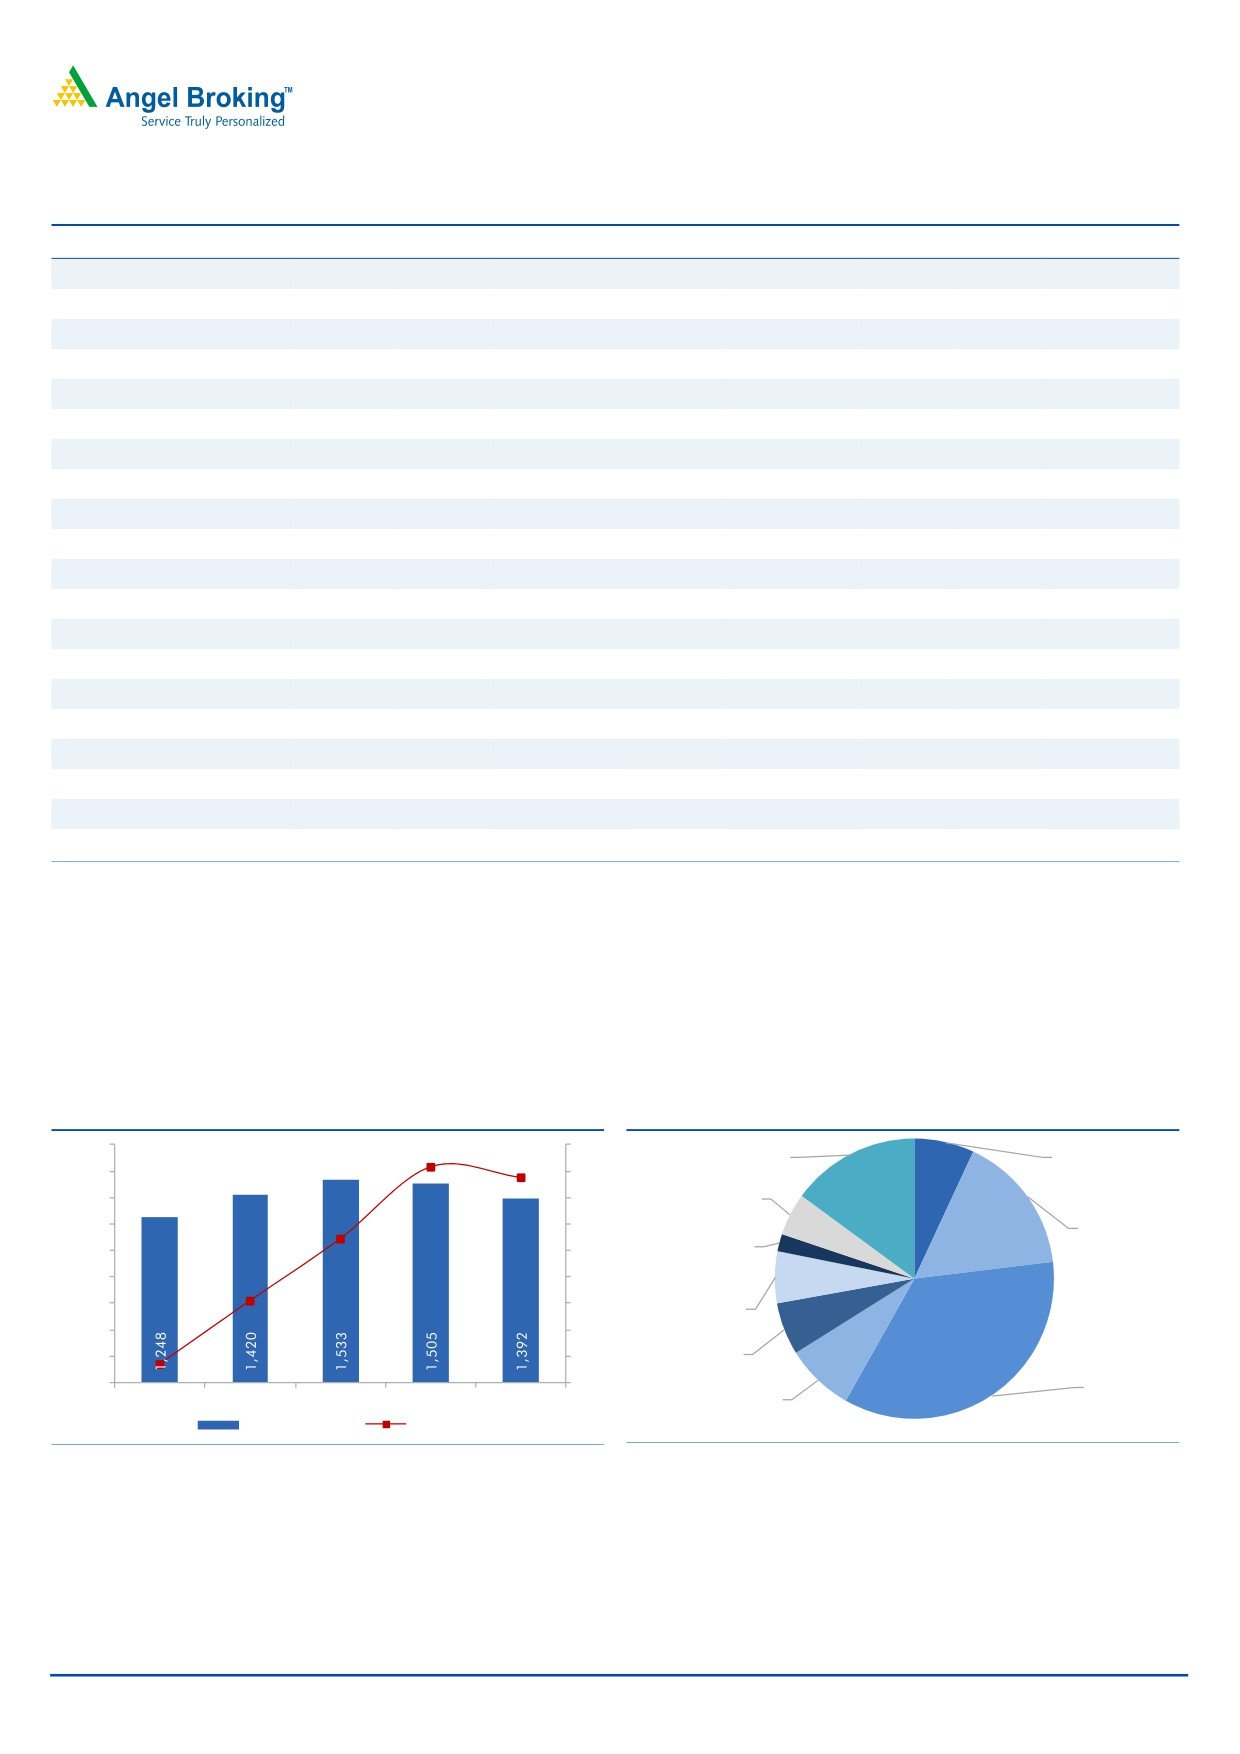
11.5% yoy revenue growth
Simplex reported a top-line of `1,392cr, up 11.5% yoy, but slightly below our
expectation of `1,399cr. However, on a sequential basis it was down 7.5%.
Exhibit 2: Quarterly Revenues
Exhibit 3: Revenue mix for 1HFY2016
1,800
14
Urban Utilities,
Piling & Gound
1,600
12
15%
Eng., 7%
12.3
11.5
1,400
10
Bridges, 5%
1,200
8
Industrial, 16%
6.9
Railways, 2%
1,000
6
800
4
600
2.2
2
Roads, 6%
400
0
Marine, 6%
200
(2)
(2.6)
Building &
0
(4)
Housing, 35%
Power, 8%
2QFY15
3QFY15
4QFY15
1QFY16
2QFY16
Revenues (` cr)
y/y change (%)
Source: Company, Angel Research
Source: Company, Angel Research
Revenue growth on a yoy basis was on account of better execution seen across
Buildings & Housing segment (35% of 2QFY2016 revenues) and Marine segment
(6% of 2QFY2016 revenues).
November 17, 2015
2
Simplex Infrastructures | 2QFY2016 Result Update
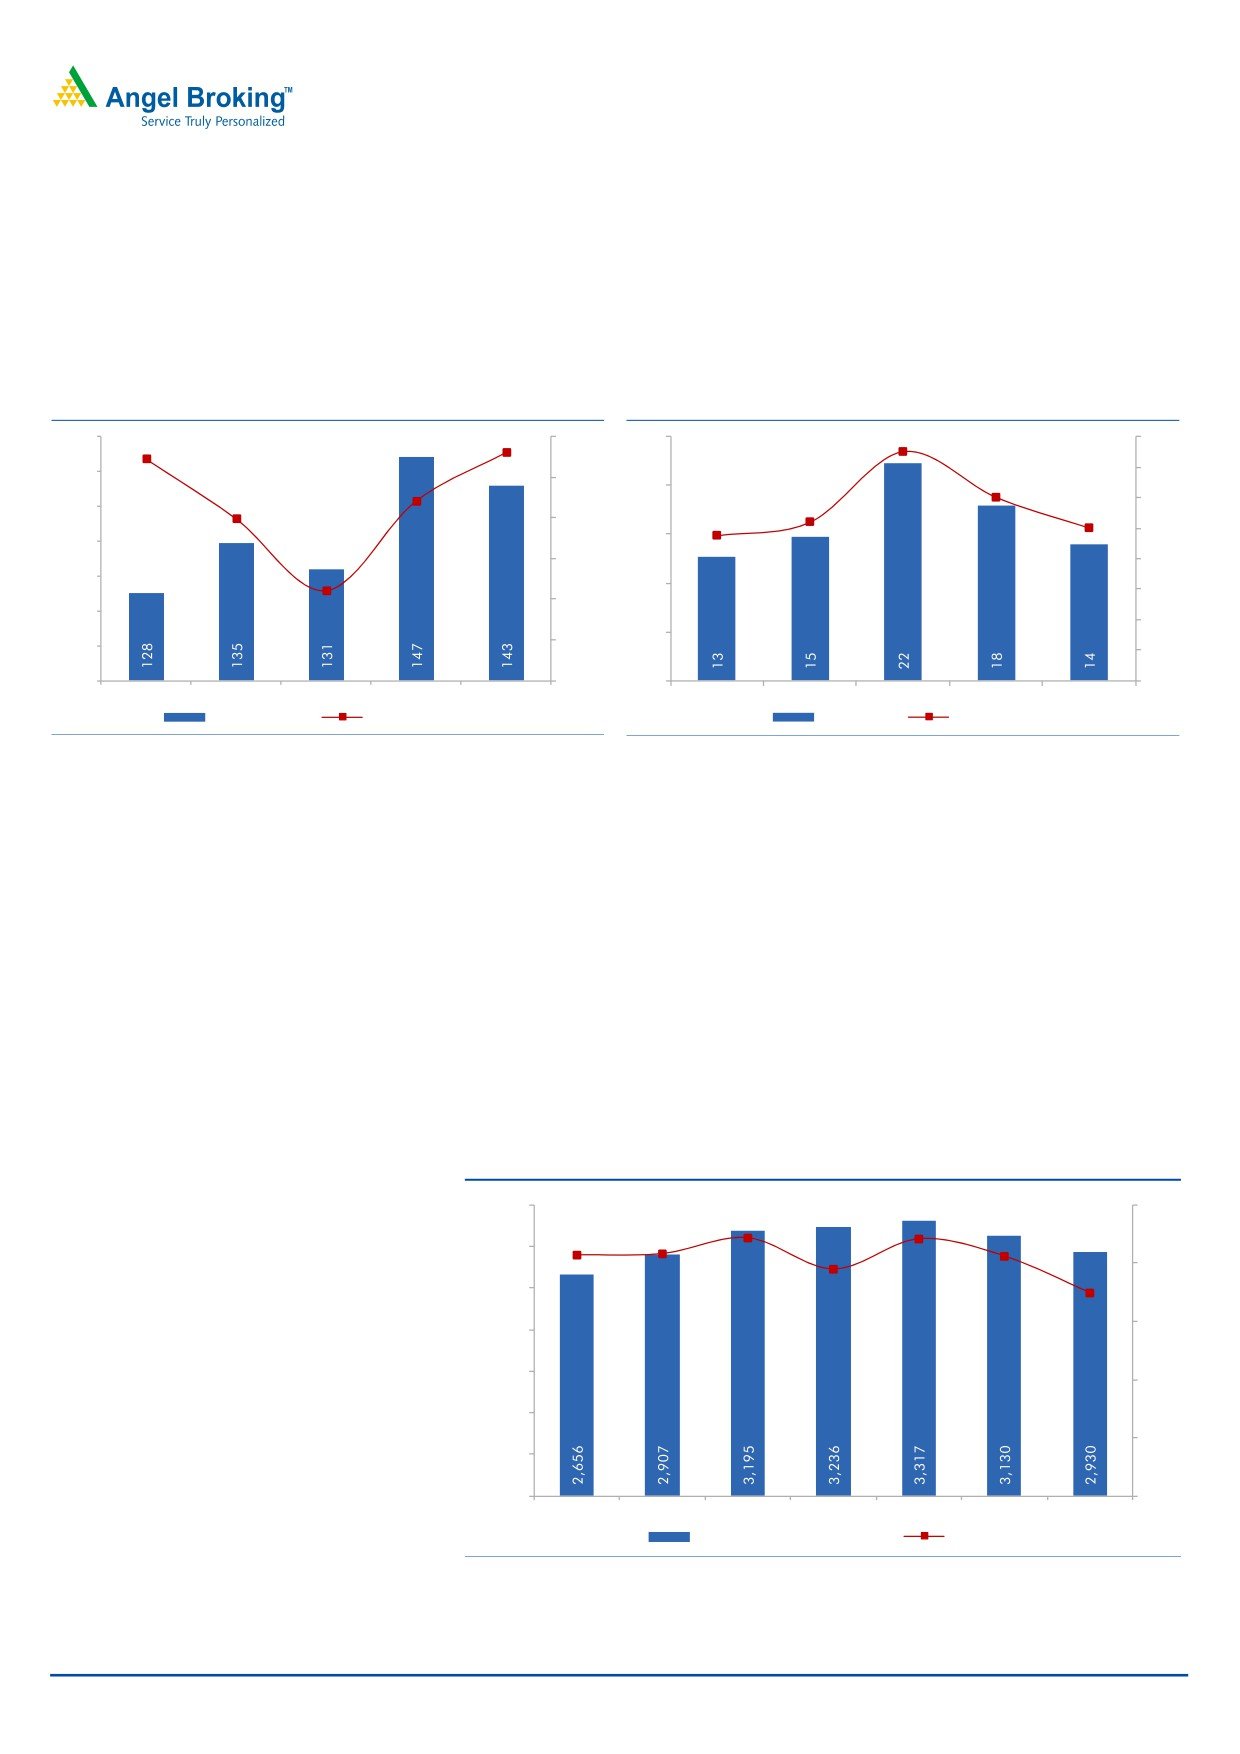
EBITDA margin expands marginally
On the EBITDA margin front, Simplex reported an EBITDA of `141cr, ahead of our
estimates of `143cr. Simplex reported 7bp yoy EBITDA margin expansion to 10.3%
for 2QFY2016. Surge in EBITDA margins is owing to 9.6% yoy decline in other
expenses (18.0% of 2QFY2016 sales) to `251cr.
Exhibit 4: EBITDA margin at 10.3% for the quarter
Exhibit 5: PAT Margin at 1.0% for the quarter
150
10.2
10.3
10.5
25
1.5
1.6
145
1.4
10.0
1.2
20
9.5
9.7
1.0
1.2
140
1.0
9.5
1.0
1.0
15
135
8.6
9.0
0.8
130
10
0.6
8.5
125
0.4
5
8.0
120
0.2
115
7.5
0
0.0
2QFY15
3QFY15
4QFY15
1QFY16
2QFY16
2QFY15
3QFY15
4QFY15
1QFY16
2QFY16
EBITDA (` cr)
EBITDA Margins (%)
PAT (` cr)
PAT Margins (%)
Source: Company, Angel Research
Source: Company, Angel Research
PAT grows yoy
Stronger execution and almost in-line operating performance helped Simplex
report a PAT of `14cr. Reported PAT margins of the company were almost flat on a
yoy basis at 1.0% in 2QFY2016. Flat yoy PAT margins reflect (1) 6.3% decline in
depreciation expenses (to `34cr), and (2) 14.0% increase in interest expenses (to
`106cr).
Comfortable D/E ratio
Simplex reported ~`339cr of recoveries in 1HFY2016 (including `144cr from a
Qatar based cement company and `80cr from Tata Power). Despite recoveries,
stretch in working capital led to surge in D/E ratio to 2.2x (as of 2QFY2016-end).
Exhibit 6: Standalone D/E at 2.2x
3,500
2.2x
2.5x
2.2x
2.1x
2.1x
2.1x
3,000
2.0x
1.9x
1.7x
2,500
1.5x
2,000
1,500
1.0x
1,000
0.5x
500
0
0.0x
FY2013
FY2014
FY2015
1QFY2015
2QFY2015
FY2016E FY2017E
Standalone Debt (` cr)
D/E ratio (x)
Source: Company, Angel Research
November 17, 2015
3
Simplex Infrastructures | 2QFY2016 Result Update
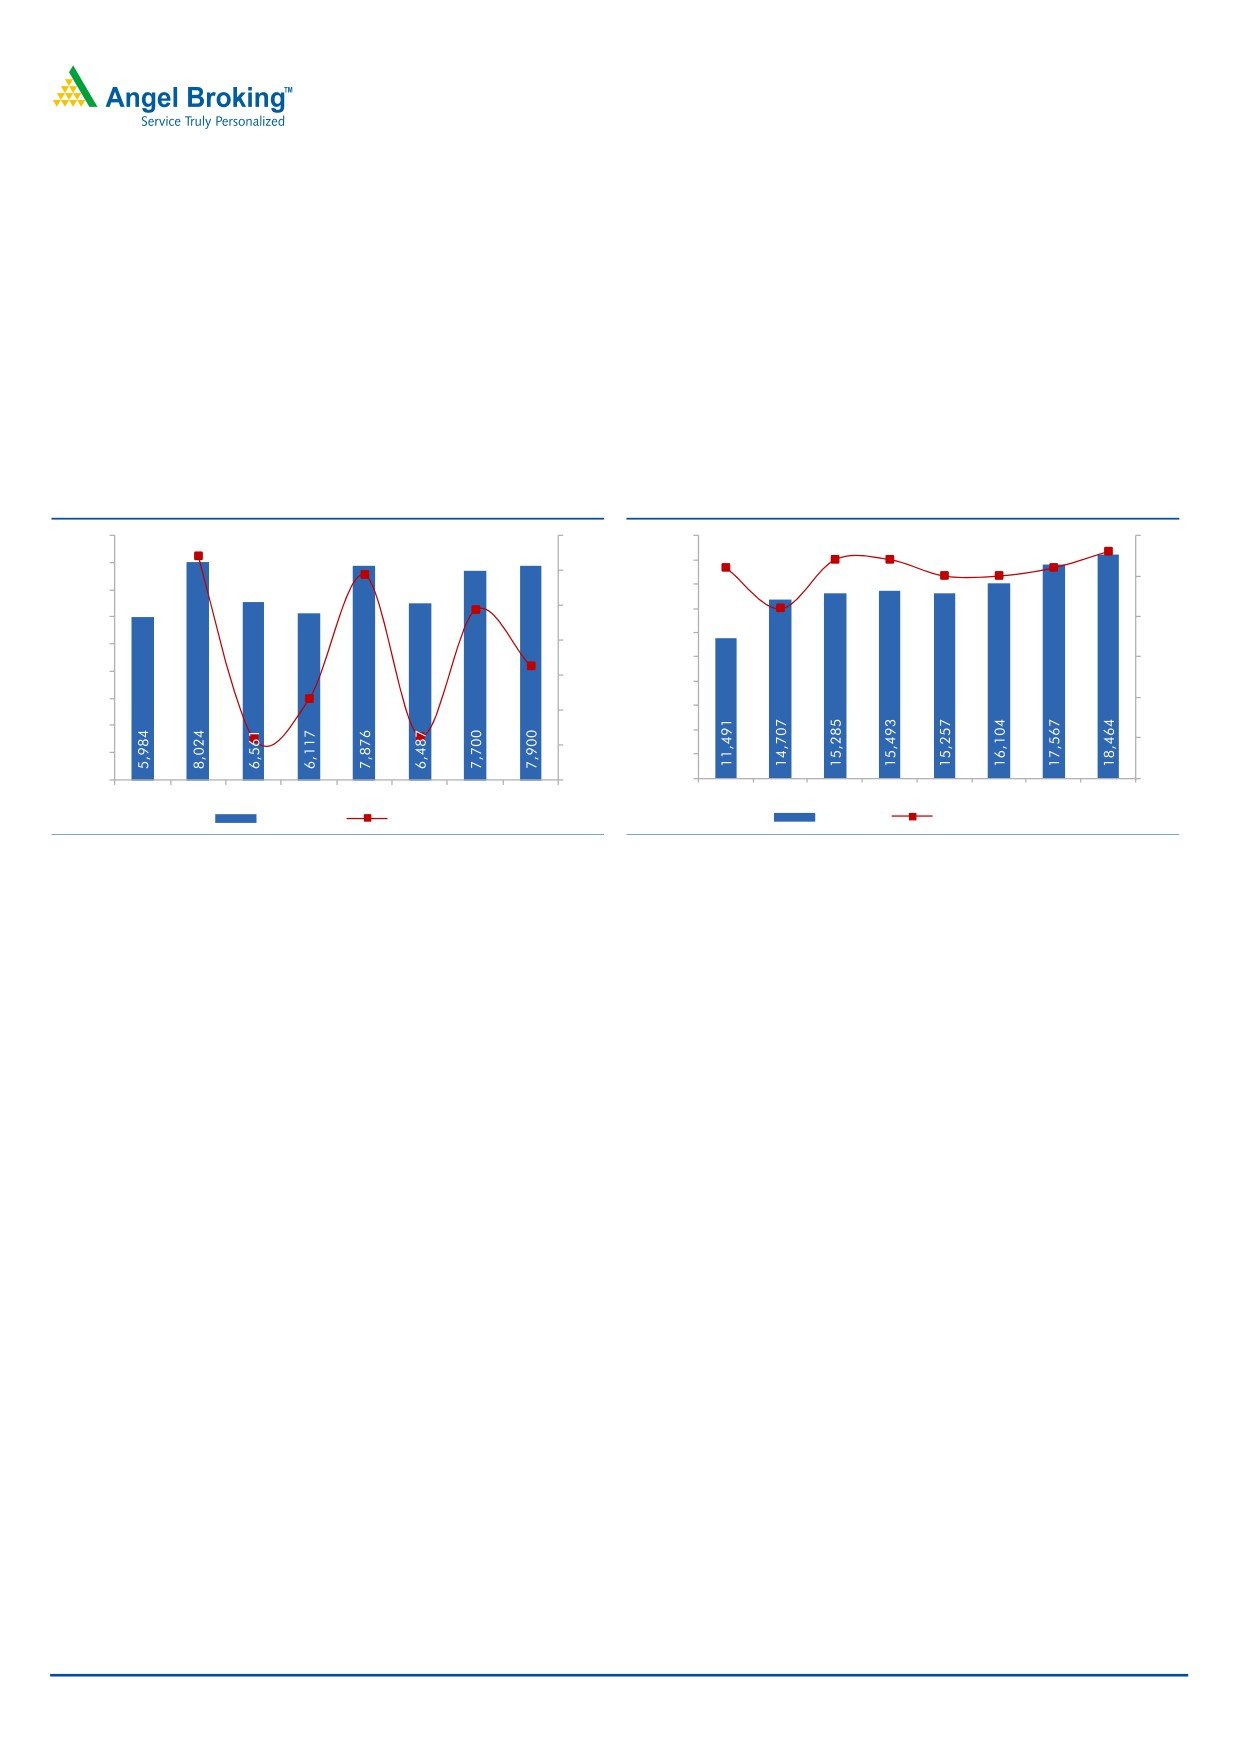
Order Inflow gains momentum
In 2QFY2016, Simplex reported order inflow to the tune of ~`1,197cr, taking the
total order inflow for 1HFY2016 to `1,938cr. Currently, Simplex enjoys L1 position
at projects worth `3,433cr.
Simplex’s Management has given order inflow guidance of
~`8,000cr for
FY2016E. Based on the bid pipeline and order wins reported in 1HFY2016, we
expect Simplex to report
`7,700/7,900cr of order wins in FY2016/2017E,
respectively.
Exhibit 7: Order Inflows to see uptrend
Exhibit 8: Order Book gives better revenue visibility
9,000
34
40
20,000
0.3x
0.3x
0.3x
0.3x
0.3x
0.3x
29
0.3x
0.3x
8,000
18,000
30
0.3x
7,000
19
16,000
0.2x
20
14,000
6,000
0.2x
12,000
5,000
3
10
10,000
0.2x
4,000
(7)
0
8,000
3,000
0.1x
6,000
-10
(18)
(18)
2,000
4,000
0.1x
-20
1,000
2,000
0
-30
0
0.0x
FY10
FY11
FY12
FY13
FY14
FY15
FY16E FY17E
FY10
FY11
FY12
FY13
FY14
FY15
FY16E FY17E
OI (` cr)
y/y change (%)
OB (` cr)
Execution Rate (x)
Source: Company, Angel Research
Source: Company, Angel Research
At 2QFY2016-end, Simplex reported an order book of `14,888cr, which reflects
8% yoy de-growth. However, if we include projects where Simplex stands L1, then
the order book at 2QFY2016-end stands at `18,321cr, which reflects OB to LTM
sales ratio of 3.1x. As of 2QFY2016, Simplex’s order book is majorly dominated
by Buildings & Housing vertical (40%).
November 17, 2015
4
Simplex Infrastructures | 2QFY2016 Result Update
Outlook & Valuation
Considering the external macro environment, the Management in its 2QFY2016
post results concall, guided that it expects 5-7% revenue growth for FY2016.
However, recent order wins and expectations of an improvement in the economy
lead the Management to tone-up the revenue growth estimate for FY2017E at 15-
20%. Accordingly, we have revised our FY2016/17E estimates.
Exhibit 9: Earnings Revision
FY2016E
FY2017E
Y/E March (` cr)
Old
New Chg. (%)
Old
New Chg. (%)
Net Sales
6,241
5,955
(4.6)
7,008
6,829
(2.6)
EBITDA
649
613
(5.5)
750
717
(4.4)
EBITDA Margins (%)
10.4
10.3
10.7
10.5
PAT
101
78
(22.8)
177
156
(11.9)
PAT Margins (%)
1.6
1.3
2.5
2.4
Source: Angel Research
Recommend Neutral with a target price of `346
At the current market price of `319, the standalone EPC business is trading at
FY2016E and FY2017E P/E multiple of 20.3x and 10.1x, respectively. (1) 10.6%
top-line and 57.8% bottom-line CAGR during FY2015-17E, (2) strong order book
of `18,321cr (OB to LTM sales ratio of 3.1x), and (3) scope for improvement in
WC as % of sales ratio from 64% in FY2015 to 53% in FY2017E, should lead to
improvement in D/E ratio from 2.2x in FY2015 to 1.8x in FY2017E. We have
assigned a 1-year forward P/E multiple of 11.0x to our FY2017E EPS estimates of
`31/share, resulting in a value of `346 per share. Given the limited upside in the
stock from the current levels, we have a Neutral rating on the stock.
November 17, 2015
5
Simplex Infrastructures | 2QFY2016 Result Update
Investment arguments
Recent order wins/ L1 give better revenue visibility: Revival in award activity
across verticals has helped Simplex build an order pipeline across sub-
segments. To-date in FY2016, Simplex has reported L1+ order wins
(combined) to the tune of `3,433cr. At 2QFY2016-end (including L1), the
order book of Simplex stands at ~`18,321cr (order book to LTM sales ratio
stands at 3.1x). We expect the flattish order book scenario to take a few more
quarters to catch-up growth momentum from here-on. Accordingly, we expect
Simplex to report a 10.6% top-line CAGR during FY2016-18E to `6,829cr.
57.8% PAT CAGR during FY2015-17E: Uptick in execution, benefits of
operating levers coming into play, coupled with decline in interest expenses,
resulting from ease in working capital cycle (WC excluding cash as % of sales
would decline from 64% in FY2015 to 53% in FY2017E), should translate to
strong earnings growth for the company. We expect Simplex to report a strong
57.8% PAT CAGR during FY2015-17E.
Risks & Concerns
Delay in ease of WC cycle than expected could pose as a risk to our estimates.
Delay in capex cycle revival than anticipated and slowdown in infra award
activity could affect our order inflow and financial estimates adversely.
Company background
Simplex Infrastructure is a diversified engineering and construction company with
an execution track record of more than 83 years. The company has presence
across a wide range of infrastructure domains with expertise in piling, roads,
railways, bridges, ports, power, industrial construction, buildings and housing, and
urban infrastructure.
November 17, 2015
6
Simplex Infrastructures | 2QFY2016 Result Update
Profit and Loss Statement (Standalone)
Y/E March (` cr)
FY13
FY14
FY15
FY16E
FY17E
Net Sales
5,821
5,513
5,582
5,955
6,829
% Chg
(5.3)
1.2
6.7
14.7
Total Expenditure
5,353
4,997
5,020
5,342
6,112
Cost of Raw Materials Consumed
2,195
1,979
1,839
2,037
2,380
Change in Inventories of WIP
26
(18)
36
(60)
(123)
Employee benefits Expense
490
462
481
512
584
Other Expenses
2,641
2,574
2,664
2,853
3,271
EBITDA
468
516
562
613
717
% Chg
10.2
8.9
9.1
16.9
EBIDTA %
8.0
9.4
10.1
10.3
10.5
Depreciation
130
136
137
147
158
EBIT
338
380
425
467
560
% Chg
12.6
11.8
9.8
19.9
Interest and Financial Charges
289
334
384
397
371
Other Income
42
39
53
48
47
PBT
90
86
94
118
236
Tax
31
25
31
40
80
% of PBT
33.8
29.2
33.5
34.0
34.0
PAT before Exceptional item
60
61
62
78
156
Exceptional item
0
0
0
0
0
PAT
60
61
62
78
156
% Chg
1.3
3.1
24.6
99.9
PAT %
1.0
1.1
1.1
1.3
2.3
Diluted EPS
12
12
13
16
31
% Chg
1.3
3.1
24.6
99.9
November 17, 2015
7
Simplex Infrastructures | 2QFY2016 Result Update
Balance Sheet (Standalone)
Y/E March (` cr)
FY13
FY14
FY15
FY16E
FY17E
Sources of Funds
Equity Capital
10
10
10
10
10
Reserves Total
1,274
1,388
1,432
1,490
1,628
Networth
1,284
1,398
1,442
1,500
1,638
Total Debt
2,656
2,907
3,195
3,130
2,950
Other Long-term Liabilities
18
18
18
18
18
Deferred Tax Liability
205
207
192
192
192
Total Liabilities
4,163
4,531
4,847
4,839
4,798
Application of Funds
Gross Block
1,863
1,954
2,023
2,133
2,261
Accumulated Depreciation
642
790
927
1,074
1,231
Net Block
1,221
1,164
1,096
1,060
1,029
Cap.l WIP & Intan.
18
53
25
15
11
Assets under Develop.
Investments
127
134
148
152
156
Current Assets
Inventories
785
862
952
943
1,005
Sundry Debtors
2,274
2,095
2,165
2,233
2,504
Cash and Bank Balance
72
81
23
159
73
Loans & Advances
742
723
822
844
911
Other Current Asset
1,660
2,029
2,562
2,564
2,656
Current Liabilities
2,911
2,756
2,993
3,177
3,595
Net Current Assets
2,622
3,034
3,532
3,566
3,554
Other Assets
175
146
46
47
49
Total Assets
4,163
4,531
4,847
4,839
4,798
November 17, 2015
8
Simplex Infrastructures | 2QFY2016 Result Update
Cash Flow Statement (Standalone)
Y/E March (` cr)
FY13
FY14
FY15
FY16E
FY17E
Profit before tax
90
86
94
118
236
Dep. & Other Non-cash Charges
182
183
101
104
126
Change in Working Capital
(621)
(421)
(457)
102
(75)
Interest & Financial Charges
289
334
384
397
371
Direct taxes paid
(74)
17
(50)
(40)
(80)
Cash Flow from Operations
(133)
199
72
681
577
(Inc)/ Dec in Fixed Assets
(47)
(101)
(41)
(100)
(123)
(Inc)/ Dec in Investments
(31)
18
11
22
23
Cash Flow from Investing
(77)
(83)
(29)
(78)
(100)
Issue/ (Buy Back) of Equity
0
0
0
0
0
Inc./ (Dec.) in Loans
531
233
288
(65)
(180)
Dividend Paid (Incl. Tax)
(11)
(6)
(4)
(5)
(12)
Net Interest Expenses
(282)
(333)
(384)
(397)
(371)
Cash Flow from Financing
237
(105)
(100)
(468)
(563)
Inc./(Dec.) in Cash
28
11
(57)
135
(86)
Opening Cash balances
41
69
80
24
159
Closing Cash balances
69
80
24
159
73
November 17, 2015
9
Simplex Infrastructures | 2QFY2016 Result Update
Key Ratios (Standalone)
Y/E March
FY13
FY14
FY15
FY16E
FY17E
Valuation Ratio (x)
P/E (on FDEPS)
26.4
26.0
25.3
20.3
10.1
P/CEPS
8.3
8.0
7.9
7.0
5.0
Dividend yield (%)
6.4
12.9
10.2
6.8
3.2
EV/Sales
0.7
0.8
0.9
0.8
0.7
EV/EBITDA
8.9
8.5
8.5
7.4
6.2
EV / Total Assets
0.6
0.6
0.6
0.6
0.5
Per Share Data (`)
EPS (fully diluted)
12.1
12.2
12.6
15.7
31.4
Cash EPS
38.4
39.6
40.3
45.4
63.3
DPS
1.0
0.5
0.6
0.9
2.0
Book Value
260
283
292
303
331
Returns (%)
RoCE (Pre-tax)
10.5
10.2
10.7
11.1
13.2
Angel RoIC (Pre-tax)
10.8
10.5
10.9
11.4
13.5
RoE
4.8
4.5
4.4
5.3
9.9
Turnover ratios (x)
Asset Turnover (Gross Block) (X)
3.2
2.9
2.8
2.9
3.1
Inventory / Sales (days)
52
55
59
58
52
Receivables (days)
124
145
139
135
127
Payables (days)
108
122
128
125
121
Leverage Ratios (x)
D/E ratio (x)
2.1
2.1
2.2
2.1
1.8
Interest Coverage Ratio (x)
1.3
1.3
1.2
1.3
1.6
November 17, 2015
10
Simplex Infrastructures | 2QFY2016 Result Update
Research Team Tel: 022 - 39357800
DISCLAIMER
Angel Broking Private Limited (hereinafter referred to as “Angel”) is a registered Member of National Stock Exchange of India Limited,
Bombay Stock Exchange Limited and Metropolitan Stock Exchange of India Limited. It is also registered as a Depository Participant with
CDSL and Portfolio Manager with SEBI. It also has registration with AMFI as a Mutual Fund Distributor. Angel Broking Private Limited is
a registered entity with SEBI for Research Analyst in terms of SEBI (Research Analyst) Regulations, 2014 vide registration number
INH000000164. Angel or its associates has not been debarred/ suspended by SEBI or any other regulatory authority for accessing
/dealing in securities Market. Angel or its associates including its relatives/analyst do not hold any financial interest/beneficial
ownership of more than 1% in the company covered by Analyst. Angel or its associates/analyst has not received any compensation /
managed or co-managed public offering of securities of the company covered by Analyst during the past twelve months. Angel/analyst
has not served as an officer, director or employee of company covered by Analyst and has not been engaged in market making activity
of the company covered by Analyst.
This document is solely for the personal information of the recipient, and must not be singularly used as the basis of any investment
decision. Nothing in this document should be construed as investment or financial advice. Each recipient of this document should
make such investigations as they deem necessary to arrive at an independent evaluation of an investment in the securities of the
companies referred to in this document (including the merits and risks involved), and should consult their own advisors to determine
the merits and risks of such an investment.
Reports based on technical and derivative analysis center on studying charts of a stock's price movement, outstanding positions and
trading volume, as opposed to focusing on a company's fundamentals and, as such, may not match with a report on a company's
fundamentals.
The information in this document has been printed on the basis of publicly available information, internal data and other reliable
sources believed to be true, but we do not represent that it is accurate or complete and it should not be relied on as such, as this
document is for general guidance only. Angel Broking Pvt. Limited or any of its affiliates/ group companies shall not be in any way
responsible for any loss or damage that may arise to any person from any inadvertent error in the information contained in this report.
Angel Broking Pvt. Limited has not independently verified all the information contained within this document. Accordingly, we cannot
testify, nor make any representation or warranty, express or implied, to the accuracy, contents or data contained within this document.
While Angel Broking Pvt. Limited endeavors to update on a reasonable basis the information discussed in this material, there may be
regulatory, compliance, or other reasons that prevent us from doing so.
This document is being supplied to you solely for your information, and its contents, information or data may not be reproduced,
redistributed or passed on, directly or indirectly.
Neither Angel Broking Pvt. Limited, nor its directors, employees or affiliates shall be liable for any loss or damage that may arise from
or in connection with the use of this information.
Note: Please refer to the important ‘Stock Holding Disclosure' report on the Angel website (Research Section). Also, please refer to the
latest update on respective stocks for the disclosure status in respect of those stocks. Angel Broking Pvt. Limited and its affiliates may
have investment positions in the stocks recommended in this report.
Disclosure of Interest Statement
Simplex Infrastructures
1. Analyst ownership of the stock
No
2. Angel and its Group companies ownership of the stock
No
3. Angel and its Group companies' Directors ownership of the stock
No
4. Broking relationship with company covered
No
Note: We have not considered any Exposure below ` 1 lakh for Angel, its Group companies and Directors
Ratings (Based on expected returns
Buy (> 15%)
Accumulate (5% to 15%)
Neutral (-5 to 5%)
over 12 months investment period):
Reduce (-5% to -15%)
Sell (< -15%)
November 17, 2015
11