2QFY2016 Result Update | Infrastructure
November 10, 2015
Sadbhav Engineering
NEUTRAL
CMP
`312
Performance Highlights
Target Price
-
Quarterly highlights - Standalone
Investment Period
-
Y/E March (` cr)
2QFY16 2QFY15
% chg (yoy) 1QFY16
% chg (qoq)
Net sales
746
595
25.4
829
(10.1)
Stock Info
Operating profit
81
60
35.5
89
(9.7)
Adj. Profit
38
10
274.7
39
(3.8)
Sector
Infrastructure
Source: Company, Angel Research
Market Cap (` cr)
5,355
Net Debt (` cr)
903
Sadbhav Engineering (SEL) reported a strong set of numbers for 2QFY2016. On
Beta
0.8
the top-line front, SEL reported a strong 25.4% yoy growth to `746cr in
52 Week High / Low
156/65
2QFY2016. This was mainly on account of execution of in-house BOT projects
Avg. Daily Volume
32,119
(mainly Rohtak-Hissar project, which contributed ~`190cr) and lower base of the
Face Value (` )
1
corresponding period of last year. The company posted an EBITDA margin of
BSE Sensex
26,121
10.8%, up 80bp yoy. Interest cost declined by 20.4% yoy to `18cr. On the
bottom-line front, the company’s reported PAT grew 158.4% yoy to `26cr. On
Nifty
7,915
adjusting for an exceptional item, the Adj. PAT grew 274.7% yoy to `38cr.
Reuters Code
SADE.BO
Bloomberg Code
SADE@IN
SEL reported order inflow of `1,608cr during the quarter, taking the total inflows won
during 1HFY2016 to `2,684cr. SEL is sitting on an order book of `9,306cr (Order
Book to LTM ratio at 2.9x) as of 2QFY2016, which provides good revenue visibility.
Shareholding Pattern (%)
Promoters
47.1
Outlook and valuation: Considering recent order wins and strong 1HFY2016
MF / Banks / Indian Fls
27.1
execution, we model revenue estimates of `3,481cr/`4,219cr for FY2016E/
FII / NRIs / OCBs
14.7
FY2017E, respectively. Given the low competitive intensity for recently won Road
Indian Public / Others
11.1
EPC projects, cool-down in bitumen and aggregate prices (as captive BOT
projects have fixed price contracts), we expect EBITDA margins to expand by 53bp
during FY2015-17E to 10.8%. Further, we model conservative other income
Abs. (%)
3m 1yr
3yr
numbers and low tax rate for FY2016/2017E at `13/14cr and 24%, respectively.
Sensex
(7.0)
(6.3)
39.9
Accordingly, we expect SEL’s PAT margin to expand by
109bp during
Sadbhav
(10.0)
27.7
122.0
FY2015-17E to 5.1%. We value SEL using Sum-Of-The-Parts methodology. We
value standalone entity on P/E multiple of 15.0x its FY2017E EPS of `12.4cr,
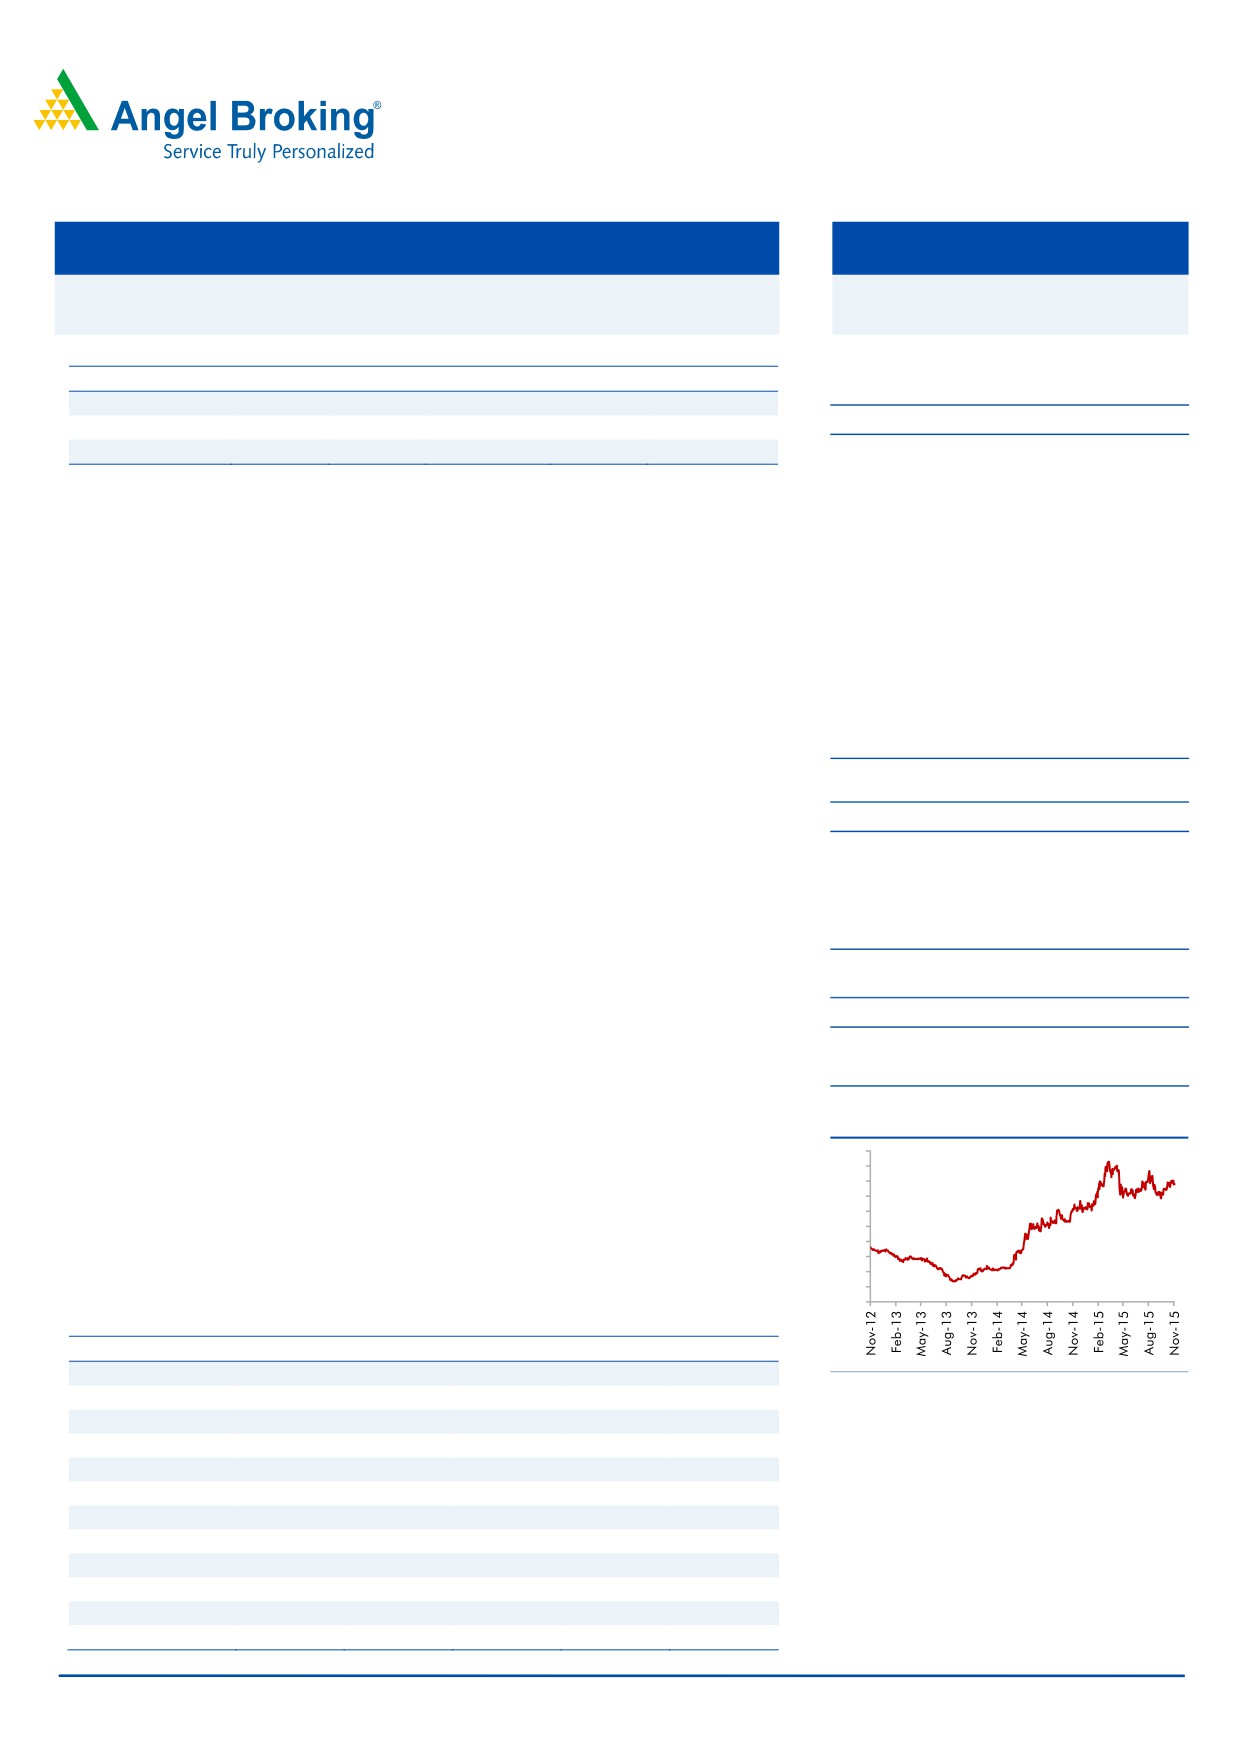
3-Year Daily Price Chart
resulting in value of `187 per share. We value BOT projects individually using
400
360
Free Cash flow to Equity holder’s method. Our value for SIPL’s portfolio of BOT
320
280
projects comes to `141/share, which is 43% of the overall SOTP value for the
240
200
company. On combining the value of EPC business and BOT projects, we arrive
160
120
at a combined business value of `328/share, reflecting limited upside in the stock
80
price from current levels. Accordingly, we maintain Neutral rating on the stock.
40
0
Key financials (Standalone)
Y/E March (` cr)
FY13
FY14
FY15
FY16E
FY17E
Net Sales
1,811
2,358
2,970
3,481
4,219
Source: Company, Angel Research
% chg
(32.3)
30.2
25.9
17.2
21.2
Net Profit
13
145
118
145
213
% chg
(47.3)
1,000.3
(18.4)
23.2
46.9
EBITDA (%)
8.6
10.6
10.3
10.7
10.8
EPS (`)
5
7
7
8
12
P/E (x)
62.1
43.4
41.9
35.9
24.4
P/BV (x)
5.6
4.8
3.9
3.5
0.0
RoE (%)
9.3
11.9
9.9
10.3
13.5
RoCE (%)
9.0
12.0
10.3
12.1
0.0
Yellapu Santosh
EV/Sales (x)
2.9
2.3
2.1
1.8
1.5
022 - 3935 7800 Ext: 6811
EV/EBITDA (x)
33.7
21.6
20.4
16.5
13.5
Source: Company, Angel Research
Please refer to important disclosures at the end of this report
1
Sadbhav Engineering | 2QFY2016 Result Update
Exhibit 1: 2QFY2016 performance (Standalone)
Particulars (` cr)
2QFY16
1QFY16
% chg (qoq) 2QFY15
% chg (yoy) 1HFY16 1HFY15
% chg (yoy)
Net Sales
746
829
(10.1)
595
25.4
1,575
1,280
23.1
Total Expenditure
665
740
(10.1)
535
24.3
1,405
1,149
22.3
Construction Expenses
602
680
(11.4)
483
24.8
1,282
1,054
21.6
Changes in Inv. Of FG & WIP
0
0
nmf
0
nmf
0
0
nmf
Employee Benefits Expense
32
28
12.8
25
30.1
60
44
36.6
Other Expenses
31
32
(3.2)
28
11.4
63
51
23.3
EBITDA
81
89
(9.7)
60
35.5
170
131
29.8
EBIDTA %
10.8
10.8
10.0
10.8
10.2
Depreciation
21
20
5.5
22
(3.9)
42
44
(5.6)
EBIT
59
69
(14.1)
37
59.1
128
87
47.8
Interest and Financial Charges
18
21
(17.0)
22
(20.4)
39
44
(12.3)
Other Income
3
2
65.9
2
57.2
5
3
35.2
PBT before Exceptional Items
45
50
(10.2)
17
162.3
94
46
104.7
Exceptional Items
12
0
0
12
0
PBT after Exceptional Items
33
50
(33.9)
17
93.0
82
46
79.1
Tax
7
10
(35.0)
7
(4.0)
17
9
88.3
% of PBT
20.0
20.4
40.3
20.2
19.3
PAT
26
39
(33.6)
10
158.4
66
37
76.9
Adj. PAT
38
39
(3.8)
10
274.7
77
37
108.6
Adj. PAT %
5.1
4.8
1.7
4.9
2.9
Dil. EPS
1.53
2.30
(33.5)
0.65
135.4
3.83
2.40
59.6
Source: Company, Angel Research
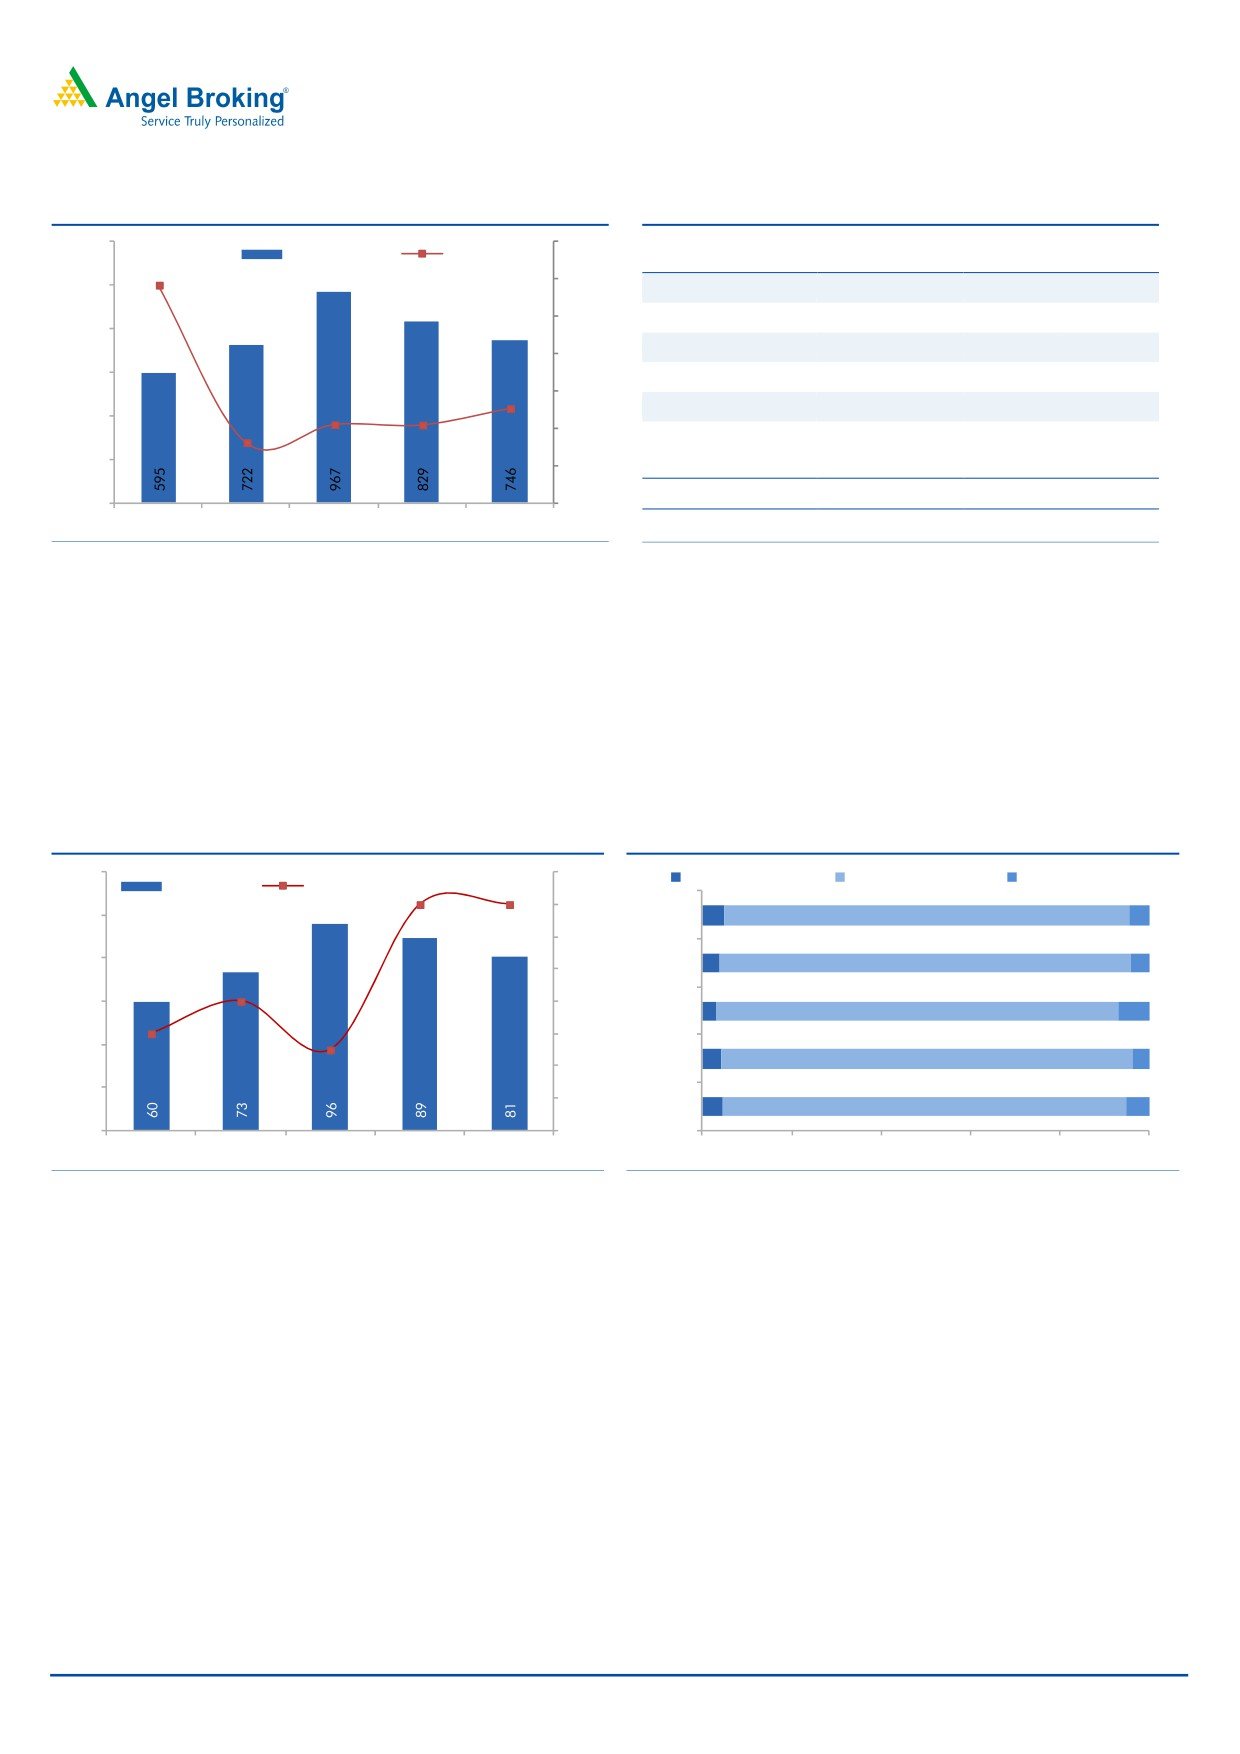
Strong execution seen during the quarter
On the top-line front, SEL reported a strong 25.4% yoy revenue growth to `746cr
in 2QFY2016. This was mainly on account of strong execution seen across their
captive BOT projects (53.9% yoy increase to `461cr), which are under construction
and had a lower base in the corresponding period of last year. Revenue booking
from EPC road projects declined 10.3% yoy to `132cr, owing to completion of old
projects in the order book.
Exhibit 2: Segment-wise revenue growth
Segment
2QFY16
1QFY16
4QFY15
3QFY15
2QFY15
% chg (qoq)
% chg (yoy)
Roads
593
507
659
445
446
17.0
32.8
BOT
461
407
470
374
300
13.3
53.9
EPC
132
100
189
72
147
32.1
(10.3)
Irrigation
31
201
166
138
35
(84.3)
(10.1)
Mining
120
120
139
139
112
(0.3)
7.1
Power Generation
2
2
1
1
1
6.4
33.6
Revenues (ex. Oth. Opr. Income)
746
829
965
722
595
(10.1)
25.4
Source: Company, Angel Research
Again, if we look at revenue booking for the quarter from top 5 projects, then the
top 5 projects contributed 68.4% of 2QFY2016 revenues (vs 55.2% in the previous
quarter). Further, all the 4 Captive Road projects contributed a major chunk of the
quarter’s revenues (accounted for 60.9% of the quarter’s revenues).
November 10, 2015
2
Sadbhav Engineering | 2QFY2016 Result Update
Exhibit 3: Quarterly Revenue growth
Exhibit 4: Revenues booked from Top 5 Projects
1,200
70.0
Revenues (` cr)
yoy growth (%)
Project Name
Vertical 2QFY2016 1QFY2016
58.4
60.0
1,000
Rohtak-Hissar
Captive BOT
190
149
50.0
Mysore-Bellary
Captive BOT
89
108
800
Bhilwara-Rajsamand
Captive BOT
95
78
40.0
600
Omkareshwar Canal
Irrigation
64
25.4
30.0
21.1
21.0
Shreenathji-Udaipur
Captive BOT
81
60
400
16.3
20.0
Jodhpur-Pachpadra
Road EPC
56
200
10.0
Total Revenues
746
829
0
0.0
4QFY14
1QFY15
4QFY15
1QFY16
2QFY16
As % of total
68.4%
55.2%
Source: Company, Angel Research
Source: Company, Angel Research
EBITDA Margins expand to 10.8%
SEL reported an EBITDA of `81cr for 2QFY2016, up 35.5% yoy, but down 9.7%
qoq. Alternatively, the EBITDA margin of the company improved 80bp yoy to
10.8%. However, on a qoq basis, reported margins were flat. In addition to the
stronger execution, surge in yoy EBITDA margin is also attributable to 11.4% yoy
growth (less than the revenue growth) seen across other expenses (to `31cr).
Exhibit 5: EBITDA% expands
Exhibit 6: Quarterly Expense movement
120
10.8
10.8
11.0
Emp. Exp as % of sales Const. Exp as % of sales Oth. Exp as % of sales
EBITDA (` cr)
EBITDA (%)
10.8
100
2QFY16
4.3
80.8
4.1
10.6
80
1QFY16
3.4
82.0
3.8
10.4
10.2
60
10.2
10.0
4QFY15 2.8
81.2
6.2
9.9
10.0
40
1QFY15
3.7
82.1
3.5
9.8
20
9.6
4QFY14
4.1
81.2
4.7
0
9.4
4QFY14
1QFY15
4QFY15
1QFY16
2QFY16
0%
20%
40%
60%
80%
100%
Source: Company, Angel Research
Source: Company, Angel Research
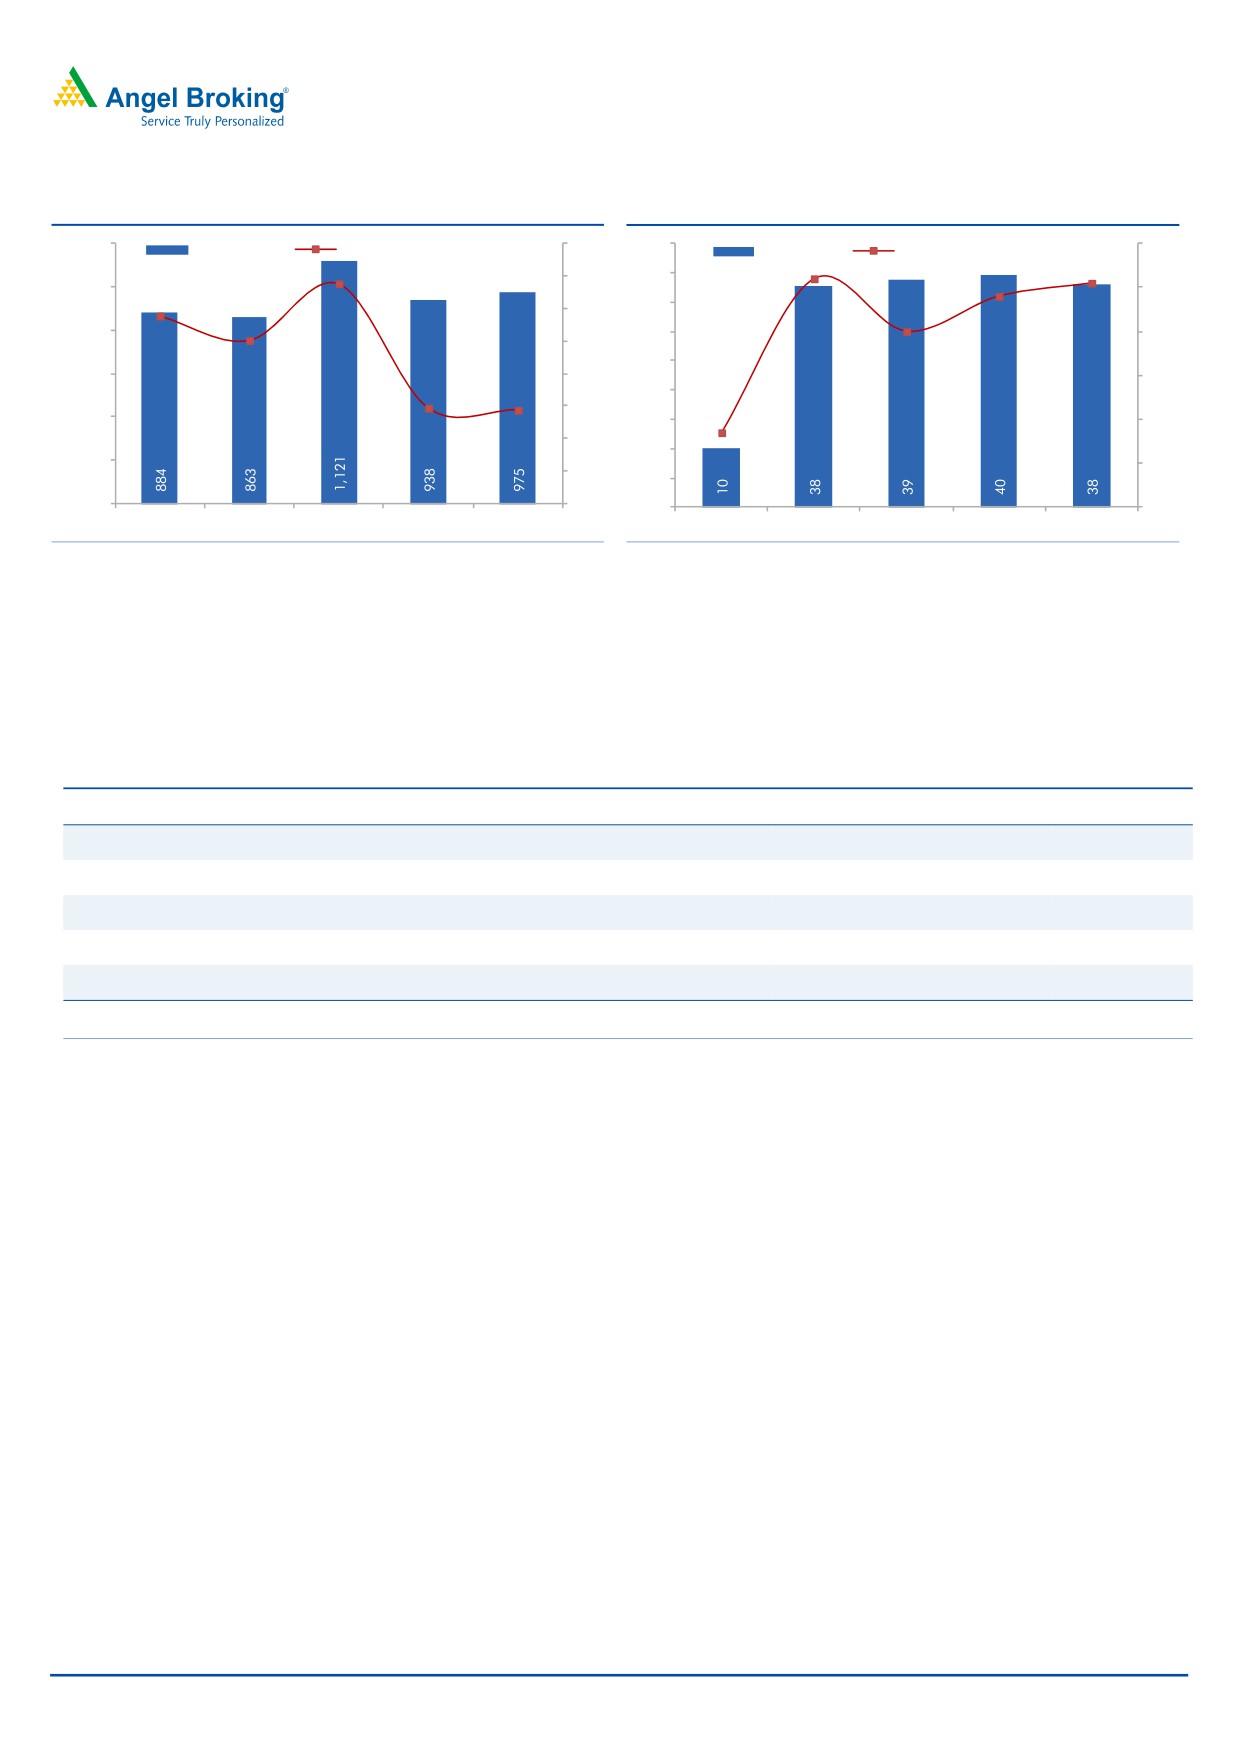
Lower Interest costs aid PAT growth
In line with strong growth seen across EBITDA level, SEL reported a sharp 158.4%
yoy increase in the quarter’s PAT numbers. During the quarter, SEL wrote-off dues
receivable from Ocean Bright Corporation, against sale of assets to the tune of
`11.7cr. On adjusting for this one-time exceptional transaction, SEL reported Adj.
PAT of `38cr, which is up 274.7% on a yoy basis. The Adj. PAT margin of the
company expanded from 1.7% in 2QFY2015 to 5.1% in 2QFY2016. Adj. PAT also
benefitted from a 20.4% yoy decline in interest expenses to `18cr. Decline in yoy
interest expenses is owing to reduction in overall debt from `1,121cr in 2QFY2015
to `975cr in 2QFY2016.
November 10, 2015
3
Sadbhav Engineering | 2QFY2016 Result Update
Exhibit 7: D/E ratio at 0.7x
Exhibit 8: PAT% also expands
1,200
1.2
45
6.0
Debt o/s (` cr)
D/E (x)
Adj. PAT (` cr)
Adj. PAT %
5.1
1.1
40
1,000
5.0
35
5.2
4.0
1.1
1.0
4.8
800
30
4.0
1.0
0.9
0.9
25
600
0.8
3.0
20
0.7
400
15
1.7
2.0
0.7
0.7
0.6
10
200
1.0
0.5
5
0
0.4
0
0.0
2QFY14
4QFY14
2QFY15
4QFY15
2QFY16
4QFY14
1QFY15
4QFY15
1QFY16
2QFY16
Source: Company, Angel Research
Source: Company, Angel Research
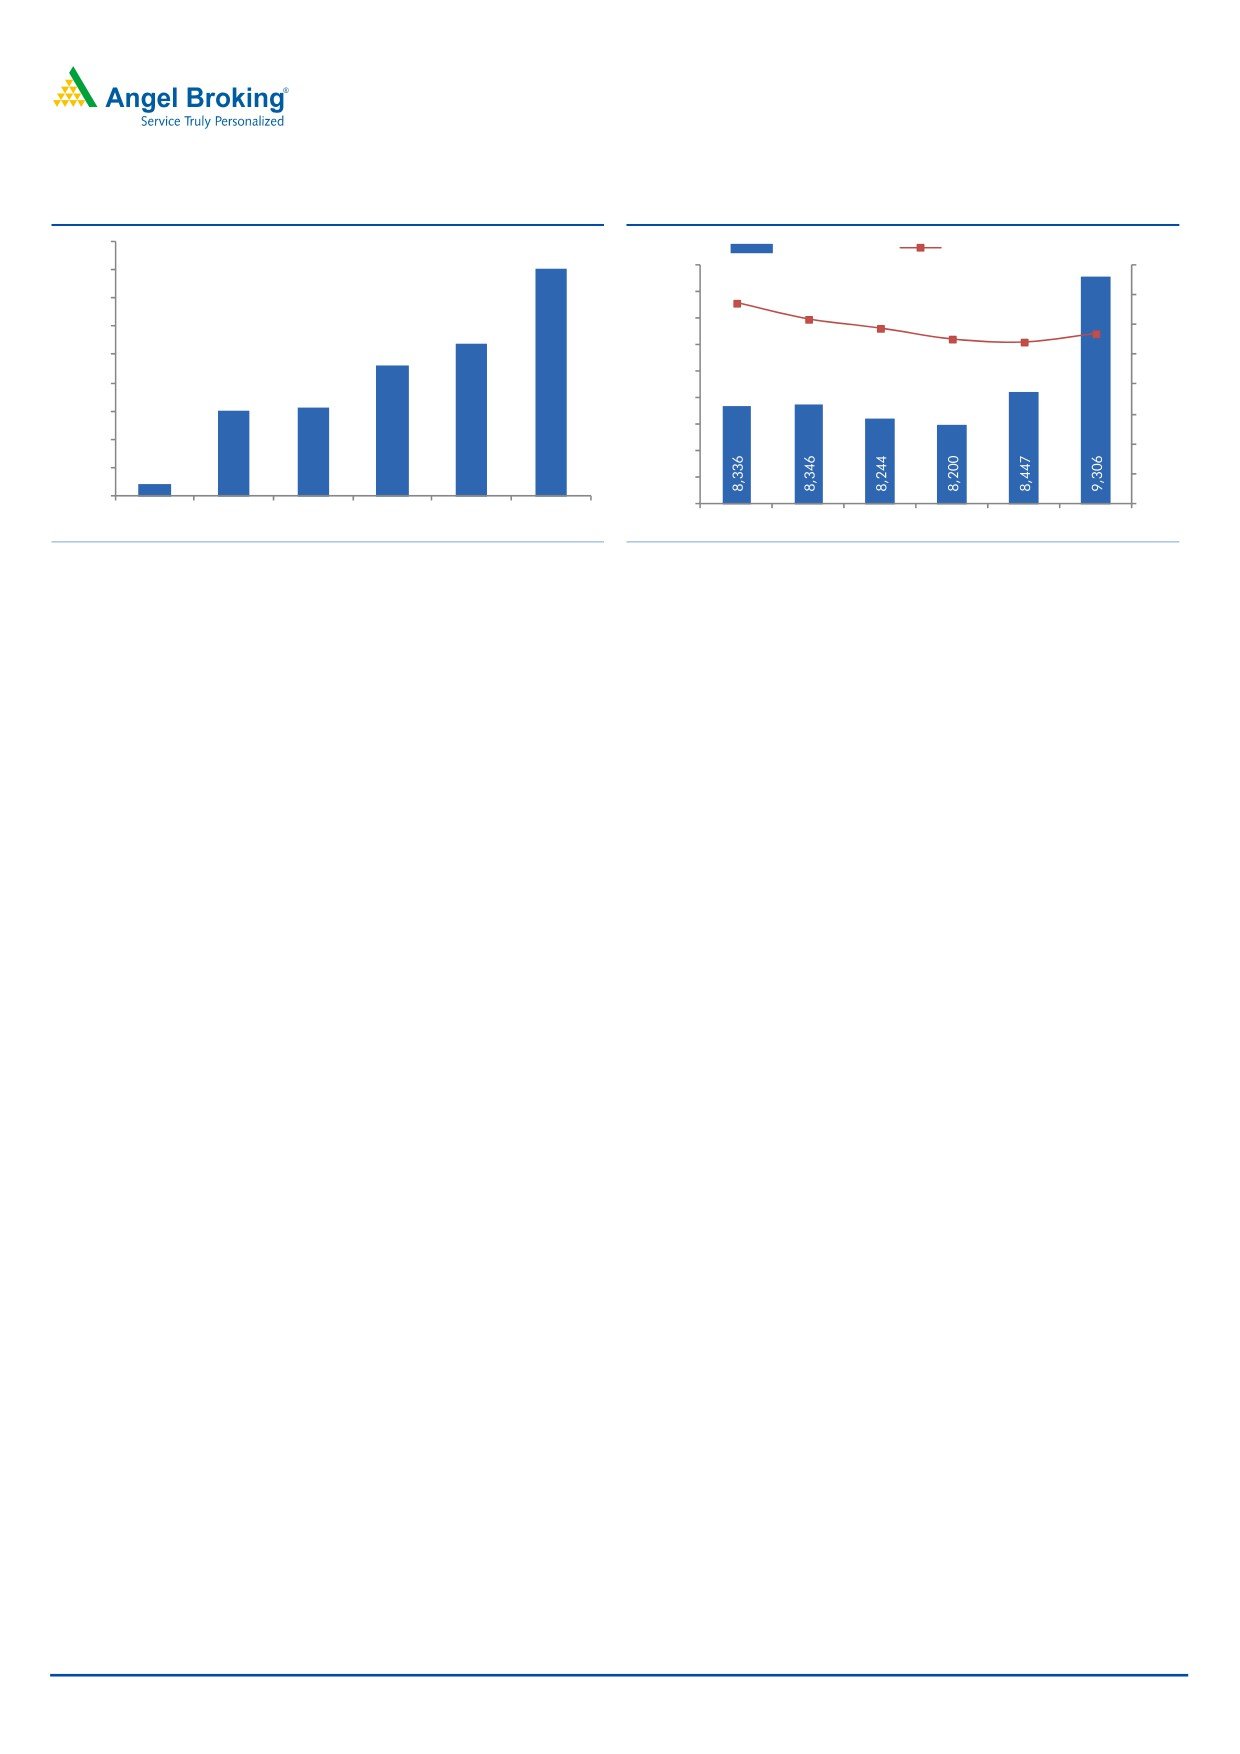
Company to gain from recent order inflow…
In FY2015 SEL reported an order inflow of `2,229cr, majorly from the Road EPC
projects (worth `1,084cr). In 1HFY2016 SEL won projects worth `2,684cr, entirely
from the Road EPC space.
Exhibit 9: Details of Order Inflows during 1HFY2016
Project Detail
Segment
Length (kms)
TPC (` cr)
Duration
6-lane Eastern peripheral Expressway
Road EPC
21
792
2.5 yrs
6-lane Eastern peripheral Expressway
Road EPC
25
756
2.5 yrs
6-lane of UP/ Haryana border-Yamunanagar-Saha-Barwala-Panchkula
Road EPC
45
468
2.5 yrs
6-lane of UP/ Haryana border-Yamunanagar-Saha-Barwala-Panchkula
Road EPC
42
437
2.5 yrs
4-lane of Tapa-Bathinda (SEL stake-51%)
Road EPC
41
231
2.5 yrs
Total (5 Road Projects)
173
2,684
Source: Company, Angel Research
SEL’s unexecuted order book as of 2QFY2016 stands at ~`9,306cr (order book to
LTM sales ratio at 2.9x). The Roads & Highways vertical (58%) continues to
dominate SEL’s order book mix.
The Management expects uptick in NHAI & MoRTH’s award activity in 2HFY2016.
SEL expects to participate in 28 tenders worth `1,800cr which are from Himachal
Pradesh, Punjab, Uttar Pradesh, and Madhya Pradesh. Tenders for these projects
are to be opened up in the next 3-6 months. SEL is pre-qualified for NHAI based
projects to the tune of `2,650cr.
SEL’s Management indicated that 2 large ticket multi-year MDO orders worth
`35,000cr from the Mining space, would come-up for awarding.
Considering the emerging bid-pipeline, the Management maintained optimism
that it would win orders to the tune of `5,000cr. Accordingly, we have built order
inflow assumption of `4,550/5,830cr for FY2016/FY2017E, respectively. With
surge in the order inflows, we expect uptick in the execution cycle as well.
November 10, 2015
4
Sadbhav Engineering | 2QFY2016 Result Update
Exhibit 10: Quarterly Order Inflows (` cr)
Exhibit 11: Order Book (OB/ LTM sales at 2.9x)
1,800
Order Book (` cr)
OB/LTM sales (x)
1,608
9,400
4.0
1,600
3.4
1,400
9,200
3.1
3.5
2.9
2.9
9,000
2.8
2.7
1,200
1,076
3.0
923
8,800
1,000
2.5
8,600
800
2.0
605
620
8,400
600
1.5
8,200
400
1.0
8,000
200
81
7,800
0.5
0
7,600
0.0
1QFY2015
2QFY2015
3QFY2015
4QFY2015
1QFY2016
2QFY2016
1QFY2015 2QFY2015 3QFY2015 4QFY2015 1QFY2016 2QFY2016
Source: Company, Angel Research
Source: Company, Angel Research
Outlook and Valuation
Considering recent order wins and strong 1HFY2016 execution, we model revenue
estimates of `3,481cr/`4,219cr for FY2016E/ FY2017E, respectively. Given the
low competitive intensity for recently won Road EPC projects, and cool-down in
bitumen and aggregate prices (as captive BOT projects have fixed price contracts),
we expect EBITDA margins to expand by 53bps during FY2015-17E to 10.8%.
Further, we have modeled conservative other income numbers and low tax rate for
FY2016/2017E at `13cr/14cr and 24%, respectively. Accordingly, we expect SEL’s
PAT margins to expand by 109bp during FY2015-17E to 5.1%.
We value SEL using Sum-Of-The-Parts method. SEL’s EPC business (under
standalone entity) has been valued using FY2017E P/E multiple, whereas we have
used Free Cash flow to Equity holders method to value BOT Road projects, which
are held under SIPL, the holding company for BOT Road projects.
Value of Core EPC business
Considering better visibility on SEL’s core EPC business (standalone entity), we
have valued the standalone entity on P/E multiple of 15.0x its FY2017E EPS of
`12.4cr, resulting in a value of `187 per share.
Value of BOT projects
We have used Free Cash flow to Equity holders method to value BOT Road
projects, which are held under SIPL, the holding company for BOT Road projects.
Our value for SIPL’s portfolio of BOT projects comes to `141/share, which is 43%
of the overall SOTP value for the company.
On combining the value of EPC business and BOT projects, we arrive at a
combined business value of `328/share, reflecting limited upside in the stock price
from the current levels. Accordingly, we maintain Neutral rating on the stock.
November 10, 2015
5
Sadbhav Engineering | 2QFY2016 Result Update
Exhibit 12: SOTP break-up
FY17E Std.
Target
Target
Value/
% of
Particulars
Segment
Basis
PAT (` cr)
Multiple
Value (` cr)
share (`)
SoTP
EPC business
Construction
213
15.0
3,202
187
57
P/E of 15.0x
Total
3,202
187
57
Disounted
Subsidiary
Adj. FCFE
Value/
% of
Subsidiary
Segment
Basis
FCFE (` cr)
Stake
Value (` cr)
share (`)
SoTP
Sadbhav Infra. Projects
BOT Projects
3,506
69%
2,425
141
43
FCFE valuation
Total
3,506
2,425
141
43
Grand Total
5,627
328
100
Upside
5%
CMP
312
Source: Company, Angel Research
Risks & Concerns
Any slowdown in orders from NHAI / State governments could affect the
company’s order inflow adversely.
Delays in the commencement of BOT projects than the estimated time-line.
November 10, 2015
6
Sadbhav Engineering | 2QFY2016 Result Update
Investment arguments
Strong Order Backlog: Sadbhav in FY2015/ 1HFY2016 has reported order wins to
the tune of `2,229cr/`2,684cr. Notably, all these EPC order wins have been from
Captive as well as Non-Captive Road works, Irrigation and Mining works projects.
At 2QFY2016-end, Sadbhav was sitting on healthy order book of `9,306cr (2.9x
order book to LTM ratio). We expect the awarding activity from NHAI & MoRTH to
further gain momentum and SEL to emerge as a strong beneficiary. Accordingly,
we model 1.3x growth in order backlog from `8,200cr in FY2015 to `10,880cr by
FY2017E.
Order Backlog gives strong revenue visibility: As of 2QFY2016-end, SEL was sitting
on a strong order book of `9,306cr. Considering their diligent bidding strategy,
and past execution track record, we are comforted that the project execution
momentum at the company level would further gain from the current levels.
Accordingly, we expect Sadbhav to report a strong 19.2% top-line CAGR during
FY2015-17E.
Strong execution to further drive PAT growth: At the back-drop of strong execution,
benign bitumen costs and other operating levers coming into play, we expect SEL
to report 22.2% EBITDA CAGR during FY2015-17E. In-line with EBITDA growth,
we expect SEL to report 34.5% PAT CAGR during FY2015-17E.
Sound balance sheet: SEL has a sound balance sheet with parent net debt/equity
of 0.6x as of 1HFY2016. The company’s working capital position (Working Capital
to LTM sales ratio as of 1HFY2016 stands at 20.9%) is also much better than its
peers. This has helped the company maintain strong earnings growth up to a
certain extent.
Funds tied up for SIPL projects in the portfolio: SEL had successfully raised `400cr
through 22% stake dilution in its subsidiary, Sadbhav Infrastructure Projects Ltd.
(SIPL) in Aug-2010. Further, in Sep-2015, SIPL got listed on the Indian bourses,
where it raised equity for its last pending project Shreenathji-Udaipur (SUTPL). Now,
SIPL is fully tied-up for all of its BOT projects in-hand. The timely fund raising
exercise at regular intervals have helped the company focus on project execution,
thereby, leading to early completion of projects.
Company background
SEL was incorporated in 1988. The company is a leading EPC and infrastructure
development company based in Ahmedabad. SEL is present in the Roads and
Highways (69.7% of order book), Irrigation (14.7%) and Mining (15.2%) sectors.
The company forayed into the road sector in 1995 and has since then executed
several projects for NHAI and state governments. Currently, SEL through its
subsidiary SIPL is one of the largest BOT players in India with 12 projects in its
portfolio.
November 10, 2015
7
Sadbhav Engineering | 2QFY2016 Result Update
Profit & loss statement (Standalone)
Y/E March (` cr)
FY13
FY14
FY15
FY16E
FY17E
Net Sales
1,811
2,358
2,970
3,481
4,219
% Chg
(32.3)
30.2
25.9
17.2
21.2
Total Expenditure
1,655
2,109
2,665
3,110
3,764
Construction Expenses
1,520
1,945
2,432
2,854
3,455
Employee benefits Expense
43
60
97
113
136
Other Expenses
93
104
136
143
173
EBITDA
156
249
304
371
455
% Chg
(46.3)
60.1
22.1
21.8
22.7
EBIDTA %
8.6
10.6
10.3
10.7
10.8
Depreciation
32
47
82
89
98
EBIT
124
202
223
282
357
% Chg
(51.0)
63.0
10.3
26.5
26.6
Interest and Financial Charges
84
93
89
88
90
Other Income
10
11
16
13
14
PBT
50
120
150
207
281
Tax
37
(24)
32
50
67
% of PBT
73.7
(20.1)
21.4
24.0
24.0
PAT before Exceptional item
13
145
118
157
213
Exceptional item
0
0
0
12
0
PAT
13
145
118
145
213
% Chg
(47.3)
1000.3
(18.4)
23.2
46.9
PAT %
0.7
6.1
4.0
4.2
5.1
Diluted EPS
5
7
7
8
12
% Chg
(47.7)
43.3
3.4
16.8
46.9
November 10, 2015
8
Sadbhav Engineering | 2QFY2016 Result Update
Balance sheet (Standalone)
Y/E March (` cr)
FY13
FY14
FY15
FY16E
FY17E
Sources of Funds
Equity Capital
15
15
17
17
17
Reserves Total
817
942
1,335
1,464
1,659
Networth
833
957
1,352
1,481
1,677
Total Debt
673
863
938
978
1,033
Other Long-term Liabilities
80
52
34
49
51
Deferred Tax Liability
32
36
24
24
24
Total Liabilities
1,618
1,908
2,348
2,532
2,785
Application of Funds
Gross Block
515
726
851
929
1,018
Accumulated Depreciation
185
228
315
404
502
Net Block
330
498
536
524
516
Capital WIP
0
0
0
0
0
Investments
538
521
531
646
741
Current Assets
Inventories
102
164
213
242
279
Sundry Debtors
736
732
907
1,102
1,348
Cash and Bank Balance
22
76
35
57
88
Loans, Advances & Deposits
535
489
651
745
867
Other Current Asset
33
46
64
68
70
Current Liabilities
873
1,120
1,177
1,392
1,641
Net Current Assets
555
387
693
821
1,011
Other Assets
194
502
588
541
517
Total Assets
1,618
1,908
2,348
2,532
2,785
November 10, 2015
9
Sadbhav Engineering | 2QFY2016 Result Update
Cash flow statement (Standalone)
Y/E March (` cr)
FY13
FY14
FY15E
FY16E
FY17E
Profit before tax
74
106
114
145
213
Depreciation
32
47
82
89
98
Change in Working Capital
(107)
312
(296)
44
(154)
Interest & Financial Charges
84
118
138
88
90
Direct taxes paid
(49)
(49)
(59)
(50)
(67)
Other Non-Cash Charges
32
(11)
(15)
(3)
(1)
Cash Flow from Operations
66
524
(37)
314
178
(Inc)/ Dec in Fixed Assets
(70)
(218)
(149)
(78)
(90)
(Inc)/ Dec in Inv. & Oth. Adj.
(263)
(349)
(103)
(150)
(9)
Cash Flow from Investing
(332)
(568)
(252)
(228)
(98)
Issue/ (Buy Back) of Equity
3
27
315
0
0
Inc./ (Dec.) in Loans
310
258
66
40
55
Dividend Paid (Incl. Tax)
(10)
(11)
(12)
(16)
(18)
Interest Expenses
(84)
(118)
(132)
(88)
(90)
Cash Flow from Financing
218
157
237
(64)
(53)
Inc./(Dec.) in Cash
(48)
113
(52)
22
27
Opening Cash balances
55
6
58
6
28
Closing Cash balances
6
120
6
28
56
November 10, 2015
10
Sadbhav Engineering | 2QFY2016 Result Update
Key Ratios
Y/E March
FY13
FY14
FY15E FY16E FY17E
Valuation Ratio (x)
P/E (on FDEPS)
62.1
43.4
41.9
35.9
24.4
P/CEPS
102.8
24.1
26.7
22.3
16.7
Dividend yield (%)
0.2
0.2
0.2
0.3
0.3
EV/Sales
2.9
2.3
2.1
1.8
1.5
EV/EBITDA
33.7
21.6
20.4
16.5
13.5
EV / Total Assets
3.2
2.8
2.6
2.4
2.2
Per Share Data (`)
EPS (fully diluted)
0.9
9.5
7.3
8.5
12.4
Cash EPS
3.0
12.6
11.4
13.7
18.2
DPS
0.6
0.7
0.7
0.8
0.9
Book Value
55
63
79
86
98
Returns (%)
RoCE (Pre-tax)
9.0
12.0
10.3
12.1
0.0
Angel RoIC (Pre-tax)
10.5
13.4
11.9
12.8
0.0
RoE
9.3
11.9
9.9
10.3
13.5
Turnover ratios (x)
Asset Turnover (Gross Block) (X)
5.9
5.7
5.7
6.6
8.1
Inventory / Sales (days)
19
21
23
24
23
Receivables (days)
150
114
101
105
106
Payables (days)
176
154
141
135
131
November 10, 2015
11
Sadbhav Engineering | 2QFY2016 Result Update
Research Team Tel: 022 - 39357800
DISCLAIMER
Angel Broking Private Limited (hereinafter referred to as “Angel”) is a registered Member of National Stock Exchange of India Limited,
Bombay Stock Exchange Limited and Metropolitan Stock Exchange of India Limited. It is also registered as a Depository Participant with
CDSL and Portfolio Manager with SEBI. It also has registration with AMFI as a Mutual Fund Distributor. Angel Broking Private Limited is
a registered entity with SEBI for Research Analyst in terms of SEBI (Research Analyst) Regulations, 2014 vide registration number
INH000000164. Angel or its associates has not been debarred/ suspended by SEBI or any other regulatory authority for accessing
/dealing in securities Market. Angel or its associates including its relatives/analyst do not hold any financial interest/beneficial
ownership of more than 1% in the company covered by Analyst. Angel or its associates/analyst has not received any compensation /
managed or co-managed public offering of securities of the company covered by Analyst during the past twelve months. Angel/analyst
has not served as an officer, director or employee of company covered by Analyst and has not been engaged in market making activity
of the company covered by Analyst.
This document is solely for the personal information of the recipient, and must not be singularly used as the basis of any investment
decision. Nothing in this document should be construed as investment or financial advice. Each recipient of this document should
make such investigations as they deem necessary to arrive at an independent evaluation of an investment in the securities of the
companies referred to in this document (including the merits and risks involved), and should consult their own advisors to determine
the merits and risks of such an investment.
Reports based on technical and derivative analysis center on studying charts of a stock's price movement, outstanding positions and
trading volume, as opposed to focusing on a company's fundamentals and, as such, may not match with a report on a company's
fundamentals.
The information in this document has been printed on the basis of publicly available information, internal data and other reliable
sources believed to be true, but we do not represent that it is accurate or complete and it should not be relied on as such, as this
document is for general guidance only. Angel Broking Pvt. Limited or any of its affiliates/ group companies shall not be in any way
responsible for any loss or damage that may arise to any person from any inadvertent error in the information contained in this report.
Angel Broking Pvt. Limited has not independently verified all the information contained within this document. Accordingly, we cannot
testify, nor make any representation or warranty, express or implied, to the accuracy, contents or data contained within this document.
While Angel Broking Pvt. Limited endeavors to update on a reasonable basis the information discussed in this material, there may be
regulatory, compliance, or other reasons that prevent us from doing so.
This document is being supplied to you solely for your information, and its contents, information or data may not be reproduced,
redistributed or passed on, directly or indirectly.
Neither Angel Broking Pvt. Limited, nor its directors, employees or affiliates shall be liable for any loss or damage that may arise from
or in connection with the use of this information.
Note: Please refer to the important ‘Stock Holding Disclosure' report on the Angel website (Research Section). Also, please refer to the
latest update on respective stocks for the disclosure status in respect of those stocks. Angel Broking Pvt. Limited and its affiliates may
have investment positions in the stocks recommended in this report.
Disclosure of Interest Statement
Sadbhav Engg
1. Analyst ownership of the stock
No
2. Angel and its Group companies ownership of the stock
No
3. Angel and its Group companies' Directors ownership of the stock
No
4. Broking relationship with company covered
No
Note: We have not considered any Exposure below ` 1 lakh for Angel, its Group companies and Directors.
Ratings (Based on expected returns
Buy (> 15%)
Accumulate (5% to 15%)
Neutral (-5 to 5%)
over 12 months investment period):
Reduce (-5% to -15%)
Sell (< -15)
November 10, 2015
12