Initiating Coverage | HFC
March 3, 2017
REPCO Home Finance
BUY
CMP
`642
Reaping the benefits of serving the underserved
Target Price
`825
REPCO Home Finance is a midsized Housing Finance Company (HFC), with
Investment Period
12 Months
focus on the underserved self-employed segment. While the current operations of
the company are predominately concentrated in Southern market
(90%), the
Stock Info
management intends to gradually venture into other geographies over the next 5 years.
Sector
Housing Finance
Focus on underpenetrated non salaried segment and LAP - the key growth
Market Cap (` cr)
4,016
driver: REPCO has developed an expertise in handling the non salaried
Beta
1.0
segment. Volatile cash flows make this segment less focused by banks, and
hence, there is limited competition, taking this as an opportunity, REPCO has
52 Week High / Low
891/500
expanded aggressively on it and the company’s share of revenue from the non
Avg. Daily Volume
21,790
salaried segment has gone up to 60% currently from 45% in FY12. LAP segment has
Face Value (`)
10
been another growth driver reporting 40% CAGR in loan book over FY2012-16 and
BSE Sensex
28,832
its share in the total business has gone up to 20% in FY2016 from 14% in FY12.
Nifty
8,898
LTV in-line with industry, while lower average ticket size indicates volume driven
Reuters Code
RHFL.BO
growth: REPCO has LTV of 62% for its overall loan book, while that of Home
Bloomberg Code
REPCO@IN
Loans is ~75%; it has a conservative approach towards LAP, as its LTV is 50%.
The average ticket size of REPCO stands at `13 lakhs and this is relatively lower
than other HFCs, also the management intends to grow in volume, rather than
Shareholding Pattern (%)
growing its ticket size.
Promoters
37.1
Scope for reduction in cost of funds, should aid in maintaining margins in a
MF / Banks / Indian Fls
27.2
declining interest rate environment: Bank borrowing still accounts for ~63% of
FII / NRIs / OCBs
25.61
the source of funding, and hence, REPCO’s cost of funds is still higher than other
Indian Public / Others
10.0
HFCs. Incrementally higher borrowing from money market instruments should
offset any decline in yield on loans, and thereby protect the NIM.
Expect 23% loan growth, resulting in 26% earnings growth over FY2016-19E,
Abs.(%)
3m 1yr 3yr
backed by moderate credit cost: Post a moderation in growth was witnessed and
Sensex
10.9
23.4
39.6
hence, we expect REPCO to deliver 23% growth in loans, however, moderation
in cost structure and normalized credit cost should result in PAT CAGR of 26%
Repco
13.9
14.1
98.2
over FY2016-19E. REPCO has witnessed some increased stress on the asset
quality in the last few quarters. GNPAs went up from 1.3% in FY2016 to 2.65%
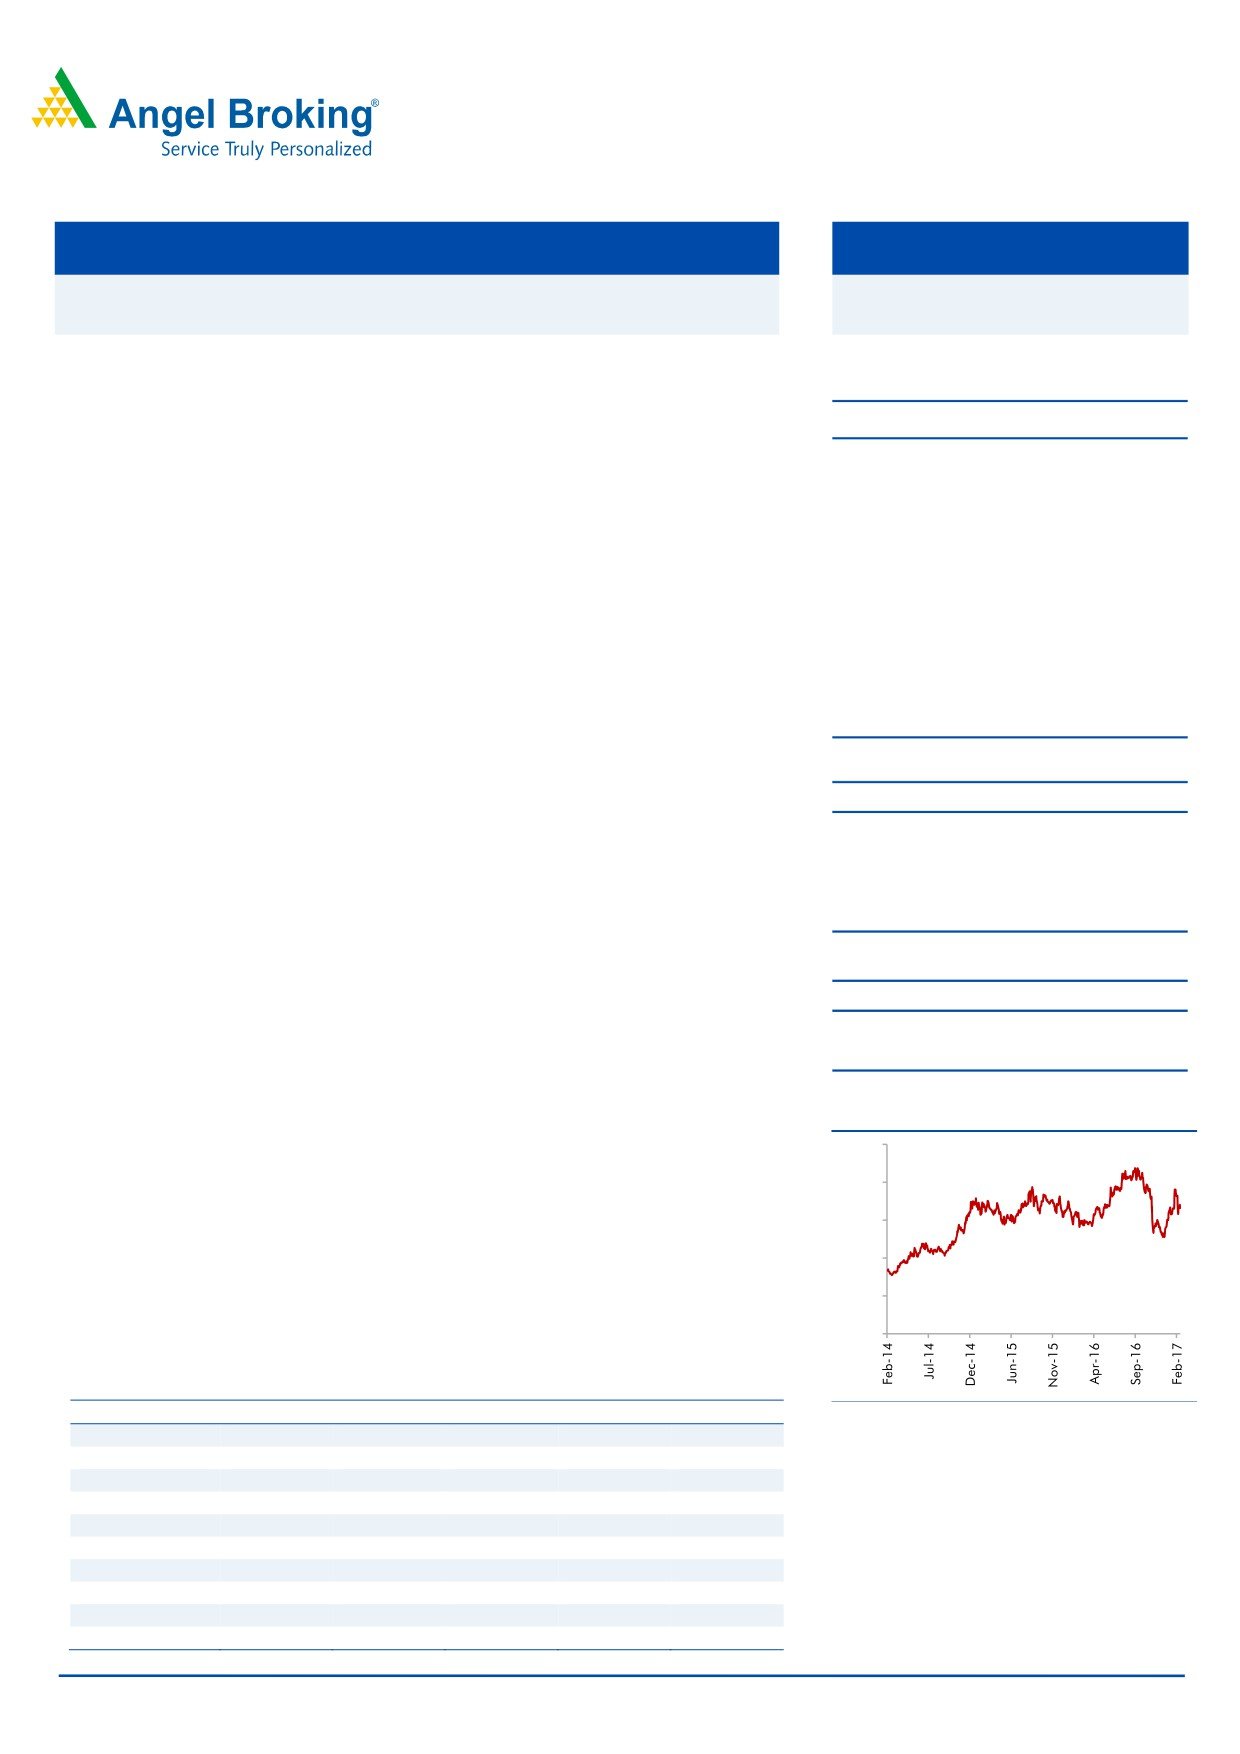
3-year price chart
in 3QFY2017, due to the stress in the non salaried and LAP segment owing to
1,000
volatile cash flows at the end of customers. However, the management remains
800
fairly confident of bouncing back to its GNPA level of 1.5% in the medium term.
600
Outlook and valuation: The target segment of REPCO is highly underserved and
this offers a growth potential for many years going ahead. Unlevered balance
400
sheet and stable NIM coupled with controlled credit cost should result in 26%
200
earnings CAGR over FY2016-19E. At the CMP the stock is trading at 2.7x it
FY2019 ABV. We have valued the stock at
3.5x its FY2019E ABV and
0
Recommend BUY with a Target Price of `825 over the next 12 months.
Key financials (Standalone)
Y/E March (` cr)
FY2015
FY2016
FY2017E
FY2018E
FY2019E
Source: Company, Angel Research
NII
237
304
388
457
551
% chg
13.3
28.0
27.6
18.0
20.5
Net profit
123
150
188
237
301
% chg
11.8
22.4
24.7
26.5
26.8
NIM (%)
4.4
4.4
4.5
4.4
4.2
EPS (`)
19.7
24.1
30.0
38.0
48.1
P/E (x)
32.6
26.7
21.4
16.9
13.4
P/ABV (x)
5.1
4.4
4.1
3.4
2.7
Siddharth Purohit
RoA (%)
2.5
2.4
2.4
2.5
2.6
022 - 3935 7800 Ext: 6828
RoE (%)
15.9
17.0
18.0
19.2
20.3
Source: Company, Angel Research; Note: CMP as of March 3, 2017
Please refer to important disclosures at the end of this report
1
REPCO Home | Initiating Coverage
Focus on high growing underpenetrated non salaried
segment
The non salaried segment is perceived to be a risky segment as far as lending is
concerned since their cash flows can be volatile, and hence, banks and some of
the large HFCs do not pursue this set of customers very aggressively. However,
over the years REPCO has developed a strong expertise in handling this segment.
Accordingly, the company’s share of revenue from the non salaried segment has
gone up to 60% from 45% in FY2012. Within the non salaried segment, the
company has a large focus on small traders. While the traditional home loans
continue to be the main area of business, in order to diversify and generate better
return the company has also expanded its business in the Loan Against Property
segment. Share of LAP in the total segment has gone up to 20% by FY2016 from a
level of 14% in FY2012.
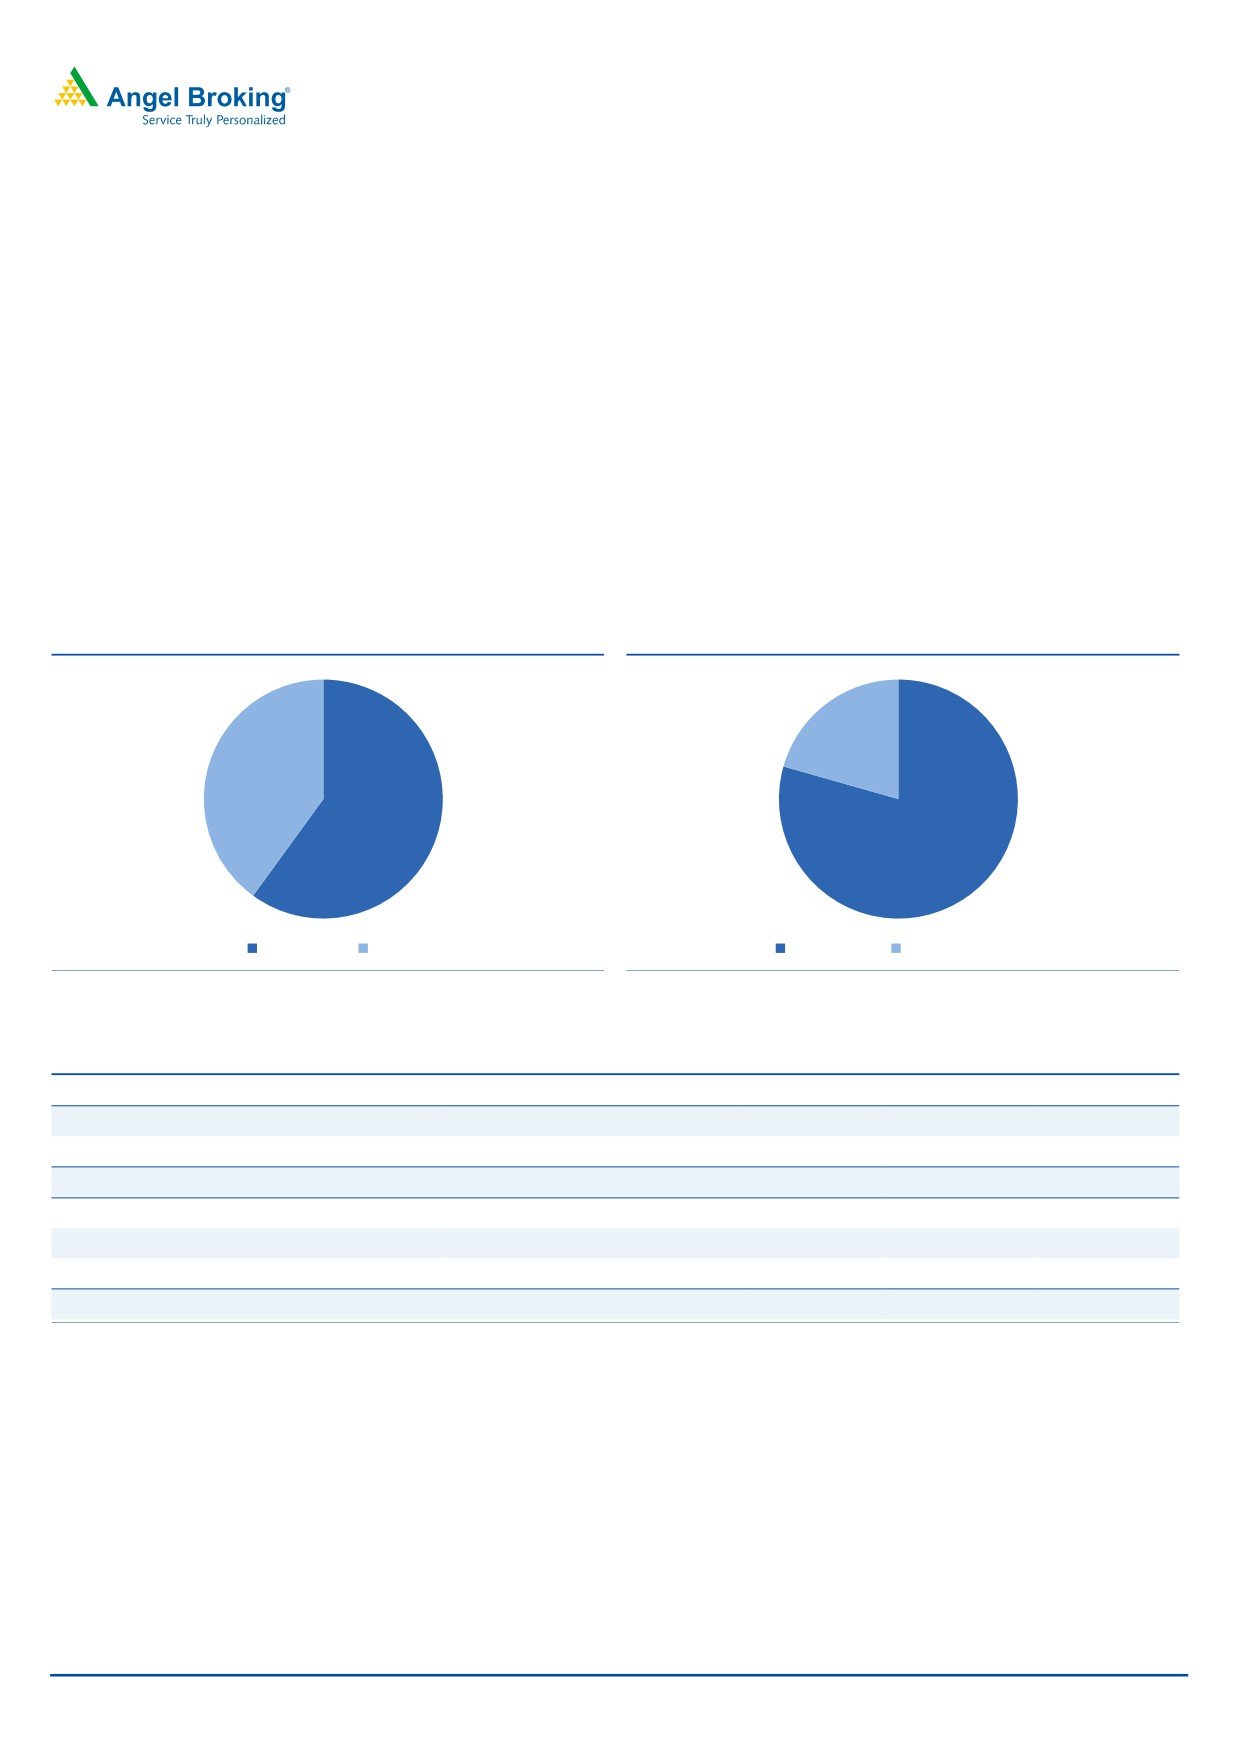
Exhibit 1: Loan Bifurcation Customerwise
Exhibit 2: Loan Bifurcation Productwise
20.6%
40.0%
60.0%
79.4%
Non Salaried
Salaried
Home Loans
Loans Against Property
Source: Company, Angel Research
Source: Company, Angel Research
Exhibit 3: Loan Composition Trend
Loan Composition (% )
FY12
FY13
FY14
FY15
FY16
9mFY17
Non -Salaried
53.5
53.1
55.0
56.8
58.8
60.0
Salaried
46.5
46.9
45.0
43.2
41.2
40.0
Total
100.0
100.0
100.0
100.0
100.0
100.0
Loan Composition (%)
Home Loans
86.0
85.1
81.3
80.8
80.2
79.4
LAP
14.0
14.9
18.7
19.2
19.8
20.6
Total
100.0
100.0
100.0
100.0
100.0
100.0
Source: Company, Angel Research
March 3, 2017
2
REPCO Home | Initiating Coverage
Loan growth to remain decent, albeit with a slower pace as
seen in last two quarters
Over FY2012-16 REPCO has reported a strong 29% CAGR in loan book. While
the Home Loans business has grown at 26%, the LAP business has reported an
impressive 40% CAGR over the same period. Since REPCO has a strong focus on
the non salaried segment, it faces limited competition from other HFCs and Banks.
The competition within the Individual home loans segment has intensified over the
last few months, as banks are flooded with surplus deposits, interest rates have
been slashed aggressively, and hence, the lending to individual segment has
become crowded. This places REPCO in a unique position as it has earned an
expertise in handling the non salaried segment, which is not pursued aggressively
by the large banks. While other HFCs also do have the non salaried segment, still
the focus for them continues to be the salaried class.
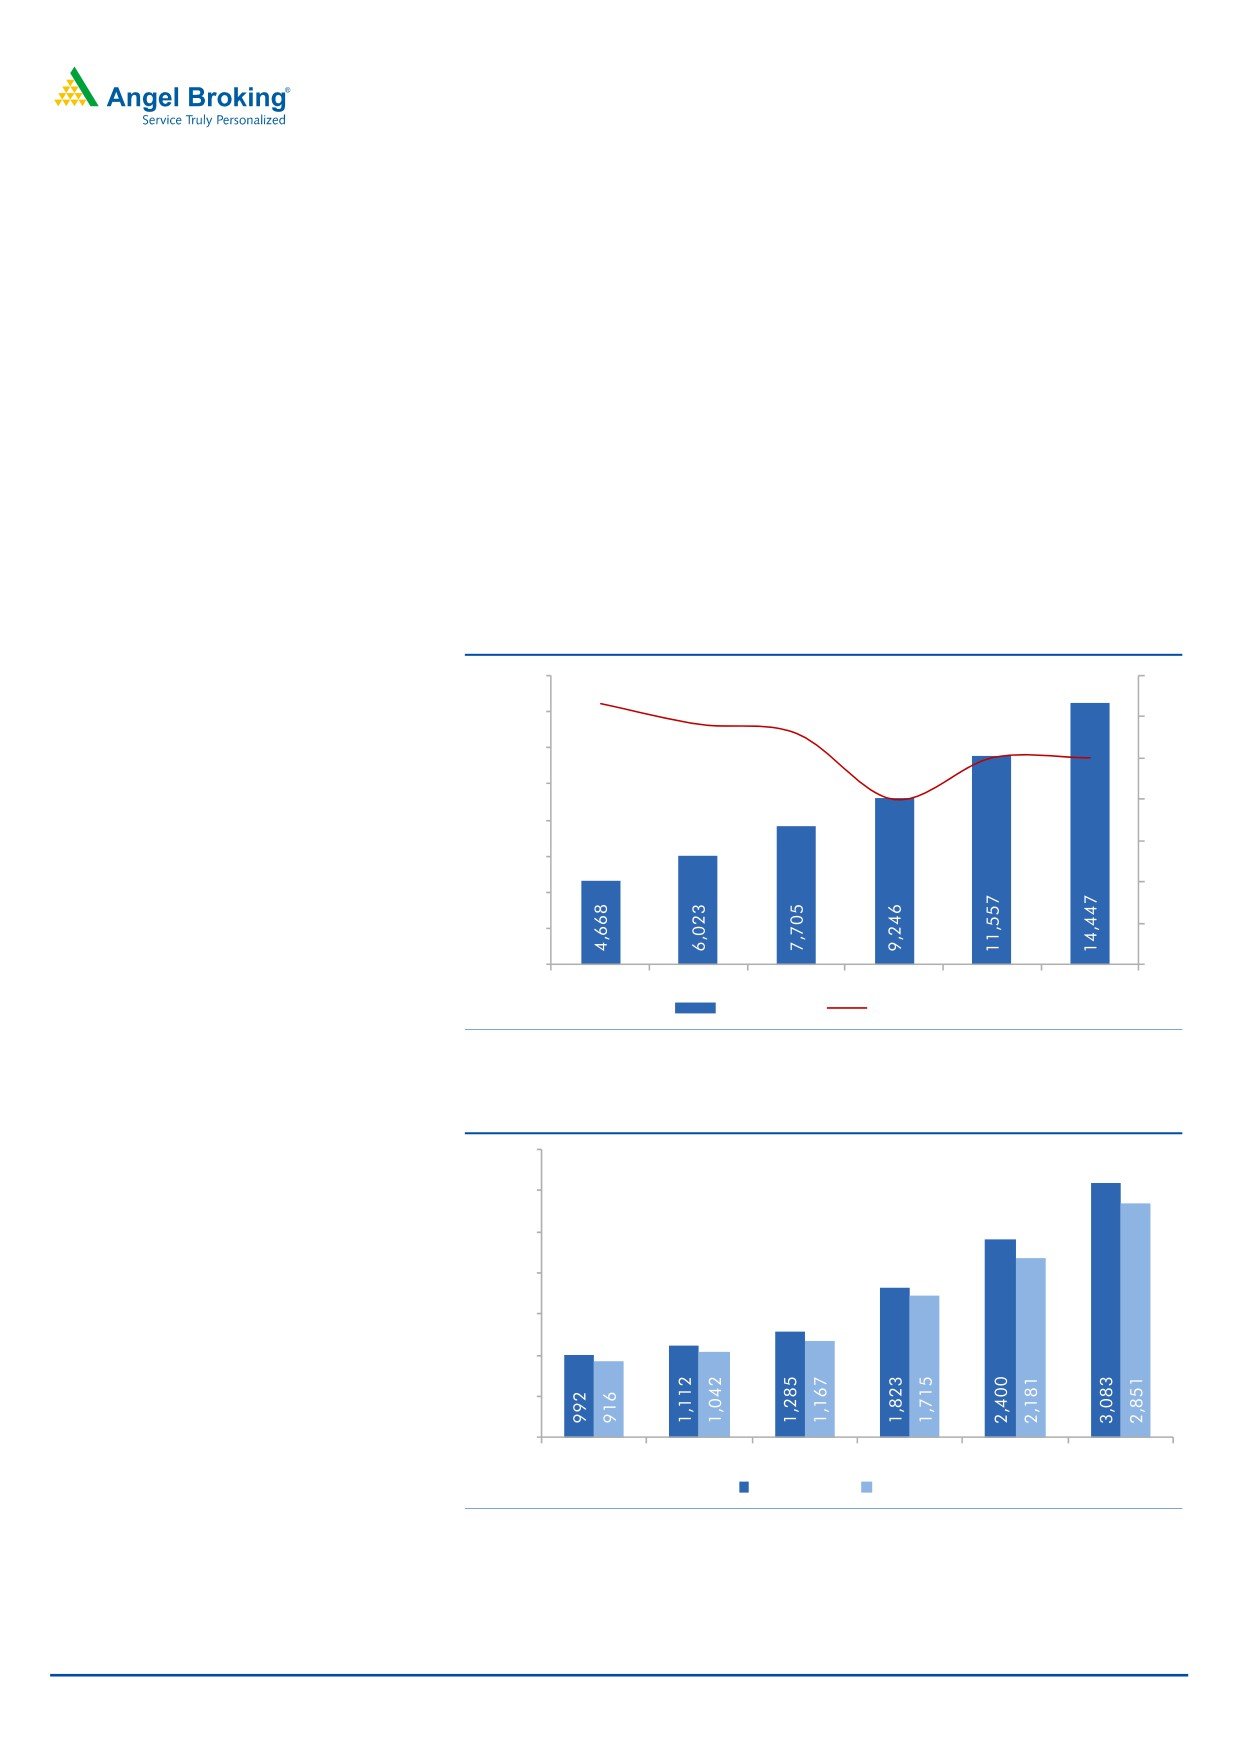
Exhibit 4: Loan book growth has been strong
16,000
35
14,000
30
31.5
12,000
29.0
27.9
25
10,000
25.0
25.0
20
20.0
8,000
15
6,000
10
4,000
2,000
5
-
0
FY14
FY15
FY16
FY17E
FY18E
FY19E
Total Loans
% Growth YoY
Source: Company, Angel Research
Exhibit 5: Sanctions and disbursements (` Cr )
3,500
3,000
2,500
2,000
1,500
1,000
500
-
FY11
FY12
FY13
FY14
FY15
FY16
Sanctions
Disbursments
Source: Company, Angel Research
March 3, 2017
3
REPCO Home | Initiating Coverage
Exhibit 6: Segmental Loan Book Growth
FY12-16
9M
(` Cr)
FY12
FY13
FY14
FY15
FY16
9mFY16
9mFY17
CAGR (%)
% YOY
Outstanding Loan Book
2,804
3,545
4,662
6,013
7,691
29
7,154
8,656
21%
% YoY
35
26
32
29
28
Salaried
1,304
1,663
2,098
2,598
3,169
25
3,155
3,462
10
% YoY
28
26
24
22
Non Salaried
1,500
1,882
2,564
3,415
4,522
32
3,999
5,194
30
% YoY
25
36
33
32
Home Loans
2,412
3,017
3,790
4,858
6,168
26
5,774
6,873
19
% YoY
25
26
28
27
LAP
393
528
872
1,154
1,523
40
1,381
1,783
29
% YoY
35
65
32
32
Sanctions
1,112
1,285
1,823
2,400
3,083
29
2,149
2,178
1
% YoY
16
42
32
28
Disbursements
1,042
1,167
1,715
2,181
2,851
29
1,954
1,978
1
% YoY
12
47
27
31
Source: Company, Angel Research
Exhibit 7: Comparative Loan Book (` Cr)
Company
FY11
FY12
FY13
FY14
FY15
FY16
CAGR 5 (%)
LIC Housing
51,400
63,080
77,812
91,341
1,08,361
1,25,173
19.5
DHFL
19,740
28,805
42,163
58,810
78,632
1,02,834
39.1
India Bulls Housing
19,800
27,500
34,400
41,200
52,200
68,700
28.3
PNB Housing
2,899
3,800
5,400
8,600
14,400
25,600
54.6
Gruh Finance
3,176
4,077
5,447
7,020
8,926
11,115
28.5
Can Fin Homes
2,205
2,673
4,030
5,874
8,302
10,753
37.3
Repco Home
2,079
2,804
3,545
4,662
6,013
7,691
29.9
GIC Housing
3,416
3,872
4,539
5,313
6,598
7,912
18.3
Source: Company, Angel Research
March 3, 2017
4
REPCO Home | Initiating Coverage
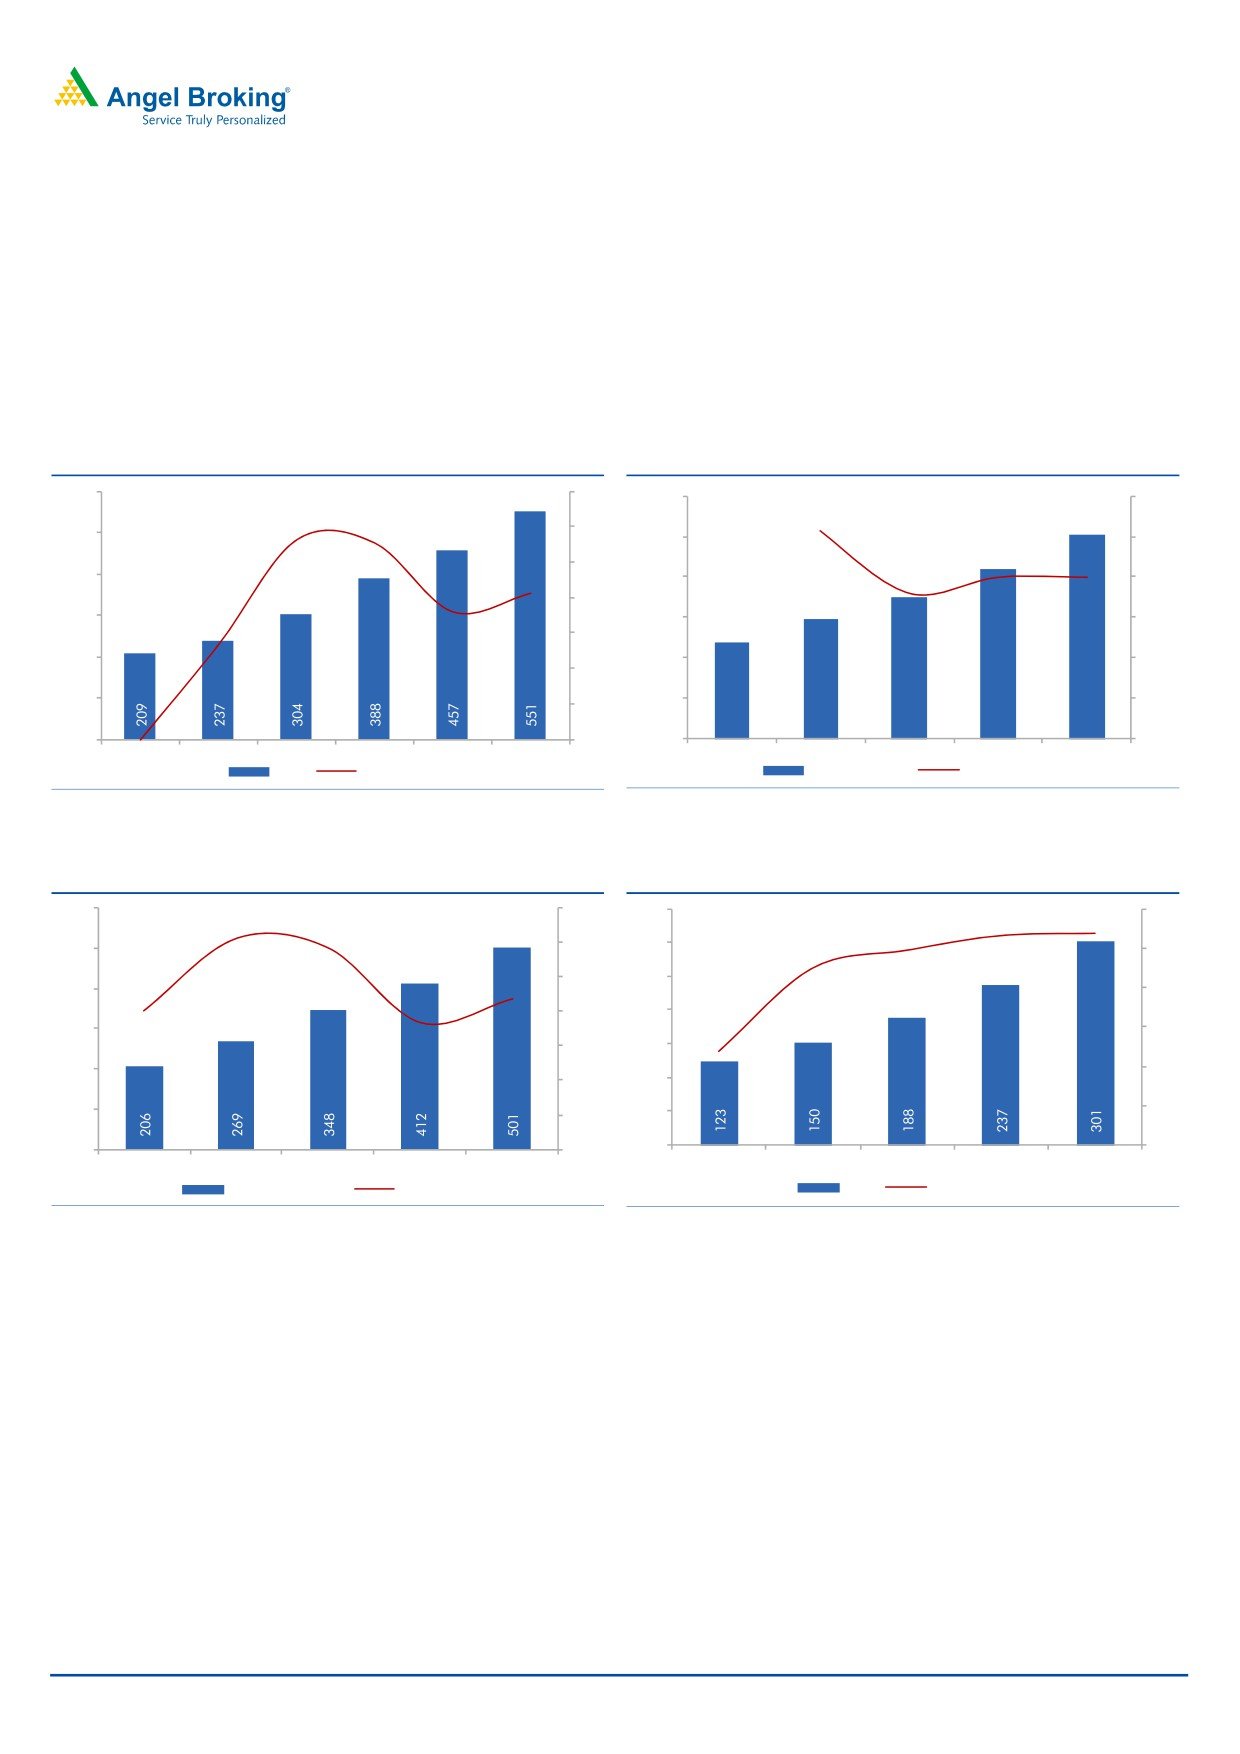
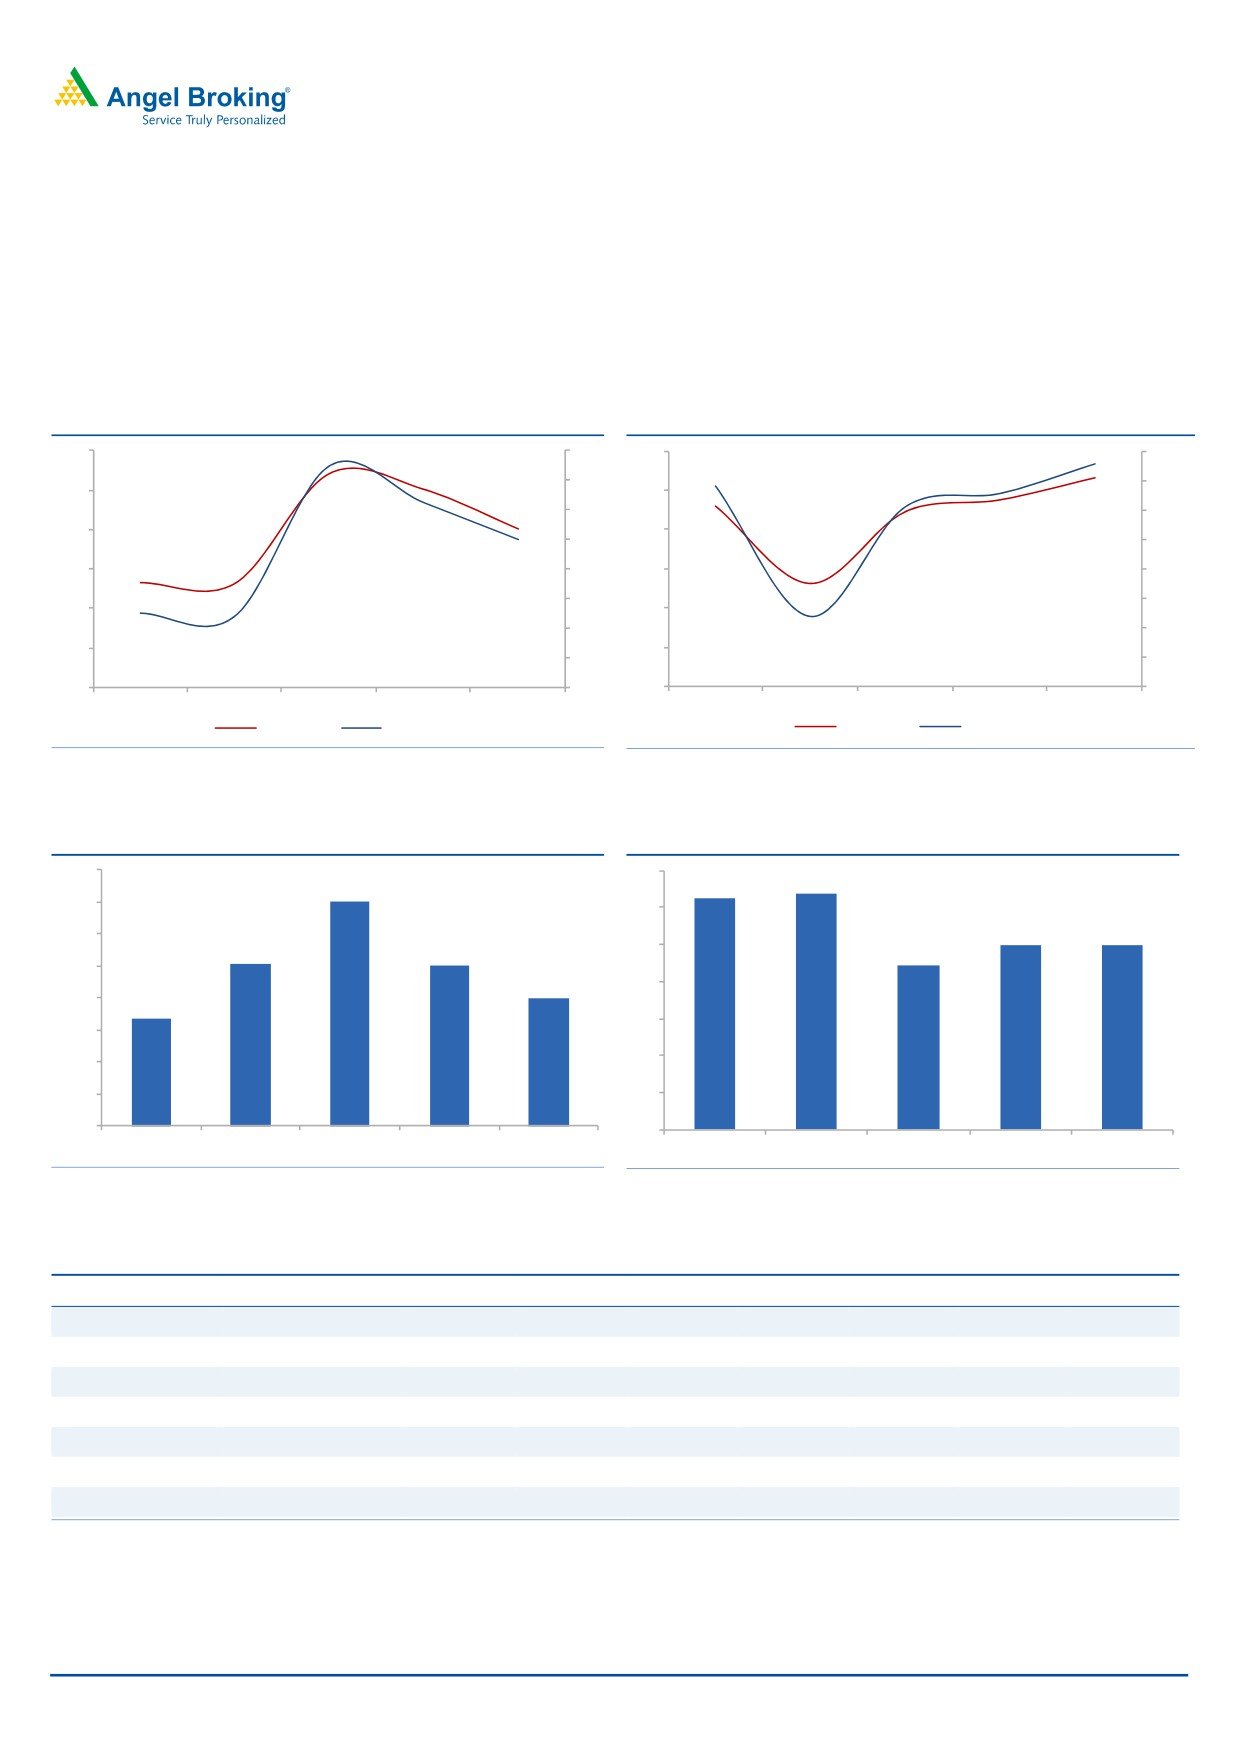
Strong loan growth with stable margins and controlled
credit cost has ensured healthy earnings growth
While lower rates of interest will reduce the yield, simultaneously there has been a
drop in the cost of funds also, and this will ensure a healthy NII growth. NII
reported a CAGR 20.5% over FY2014-16, which is expected to grow by 22% over
FY2016-18E. With moderating operating cost and credit cost PAT should grow by
26% over the same period.
Exhibit 8: NII Growth
Exhibit 9: Other Income Trend
600
35
60.0
30.0
25.7
30
500
50.0
25.0
28.0
27.6
20.0
25
20.0
400
18.0
40.0
20.0
20.5
20
300
30.0
15.0
18.0
15
13.3
200
20.0
10.0
10
100
10.0
5.0
5
23.6
29.7
35.1
42.1
50.5
0
0.0
0
0.0
0.0
FY14
FY15
FY16
FY17E
FY18E
FY19E
FY15
FY16
FY17E
FY18E
FY19E
NII
% Growth YoY
Other Income
% Growth YoY
Source: Company, Angel Research
Source: Company, Angel Research
Exhibit 10: Operating Profit
Exhibit 11: PAT Growth Trend
600
35.0
350
30
30.6
29.2
26.8
30.0
300
500
26.5
25
24.7
25.0
250
22.4
400
20.0
20
21.8
18.3
20.0
200
300
15
15.0
150
11.8
200
10
10.0
100
100
5
5.0
50
0
0.0
0
0
FY15
FY16
FY17E
FY18E
FY19E
FY15
FY16
FY17E
FY18E
FY19E
Operating Profit
% Growth YoY
PAT
% Growth YoY
Source: Company, Angel Research
Source: Company, Angel Research
March 3, 2017
5
REPCO Home | Initiating Coverage
Expect credit cost to moderate after a spike in FY2017: REPCO has witnessed
some increased stress on the asset quality in the last few quarters. GNPAs went up
from 1.3% in FY2016 to 2.65% in 3QFY2017, due to stress in the non salaried
and LAP segment owing to volatile cash flows at the end of customers. However,
the management remains fairly confident of bouncing back to its GNPA levels of
1.5% in the medium term.
Exhibit 12: GNPAs & NNPAs Ratio yearly trend
Exhibit 13: GNPAs & NNPAs Ratio quarterly trend
3.0
1.6
3.0
1.6
2.7
2.65
2.5
1.4
2.37
1.4
2.5
1.5
2.5
2.29
2.22
1.51
2.0
1.2
1.2
1.36
1.31
2.0
1.25
2.0
1.22
1.0
1.0
1.32
1.31
1.0
1.31
1.5
0.8
1.5
0.8
0.6
0.6
1.0
1.0
0.4
0.4
0.5
0.48
0.48
0.5
0.5
0.2
0.2
0.0
0.0
0.0
0.0
FY15
FY16
FY17E
FY18E
FY19E
Q3FY16
Q4FY16
Q1FY17
Q2FY17
Q3FY17
GNPAs %
NNPAs %
GNPAs %
NNPAs %
Source: Company, Angel Research;
Source: Company, Angel Research
Exhibit 14: Credit Cost (%)
Exhibit 15: PCR( %)
0.80
70
62
64
0.70
0.70
60
50
50
0.60
0.50
0.50
50
44
0.50
0.40
40
0.40
0.34
30
0.30
20
0.20
0.10
10
0.00
0
FY15
FY16
FY17E
FY18E
FY19E
FY15
FY16
FY17E
FY18E
FY19E
Source: Company, Angel Research
Source: Company, Angel Research
Exhibit 16: Comparative GNPAs % of Industry
Company
FY12
FY13
FY14
FY15
FY16
Q1FY17
Q2FY17
Q3FY17
Repco Home
1.4
1.5
1.5
1.3
1.3
2.2
2.4
2.7
LIC Housing
0.4
0.6
0.7
0.5
0.5
0.6
0.6
0.6
DHFL
0.8
0.8
0.8
1.0
0.9
1.0
1.0
1.0
India Bulls Housing
0.8
0.8
0.8
0.9
0.8
0.8
0.8
0.9
PNB Housing
1.0
0.6
0.3
0.2
0.2
0.2
0.3
0.4
Gruh Finance
0.5
0.3
0.3
0.3
0.3
0.6
0.6
0.5
Can Fin Homes
0.7
0.4
0.2
0.2
0.2
0.2
0.3
0.2
Source: Company, Angel Research
March 3, 2017
6
REPCO Home | Initiating Coverage
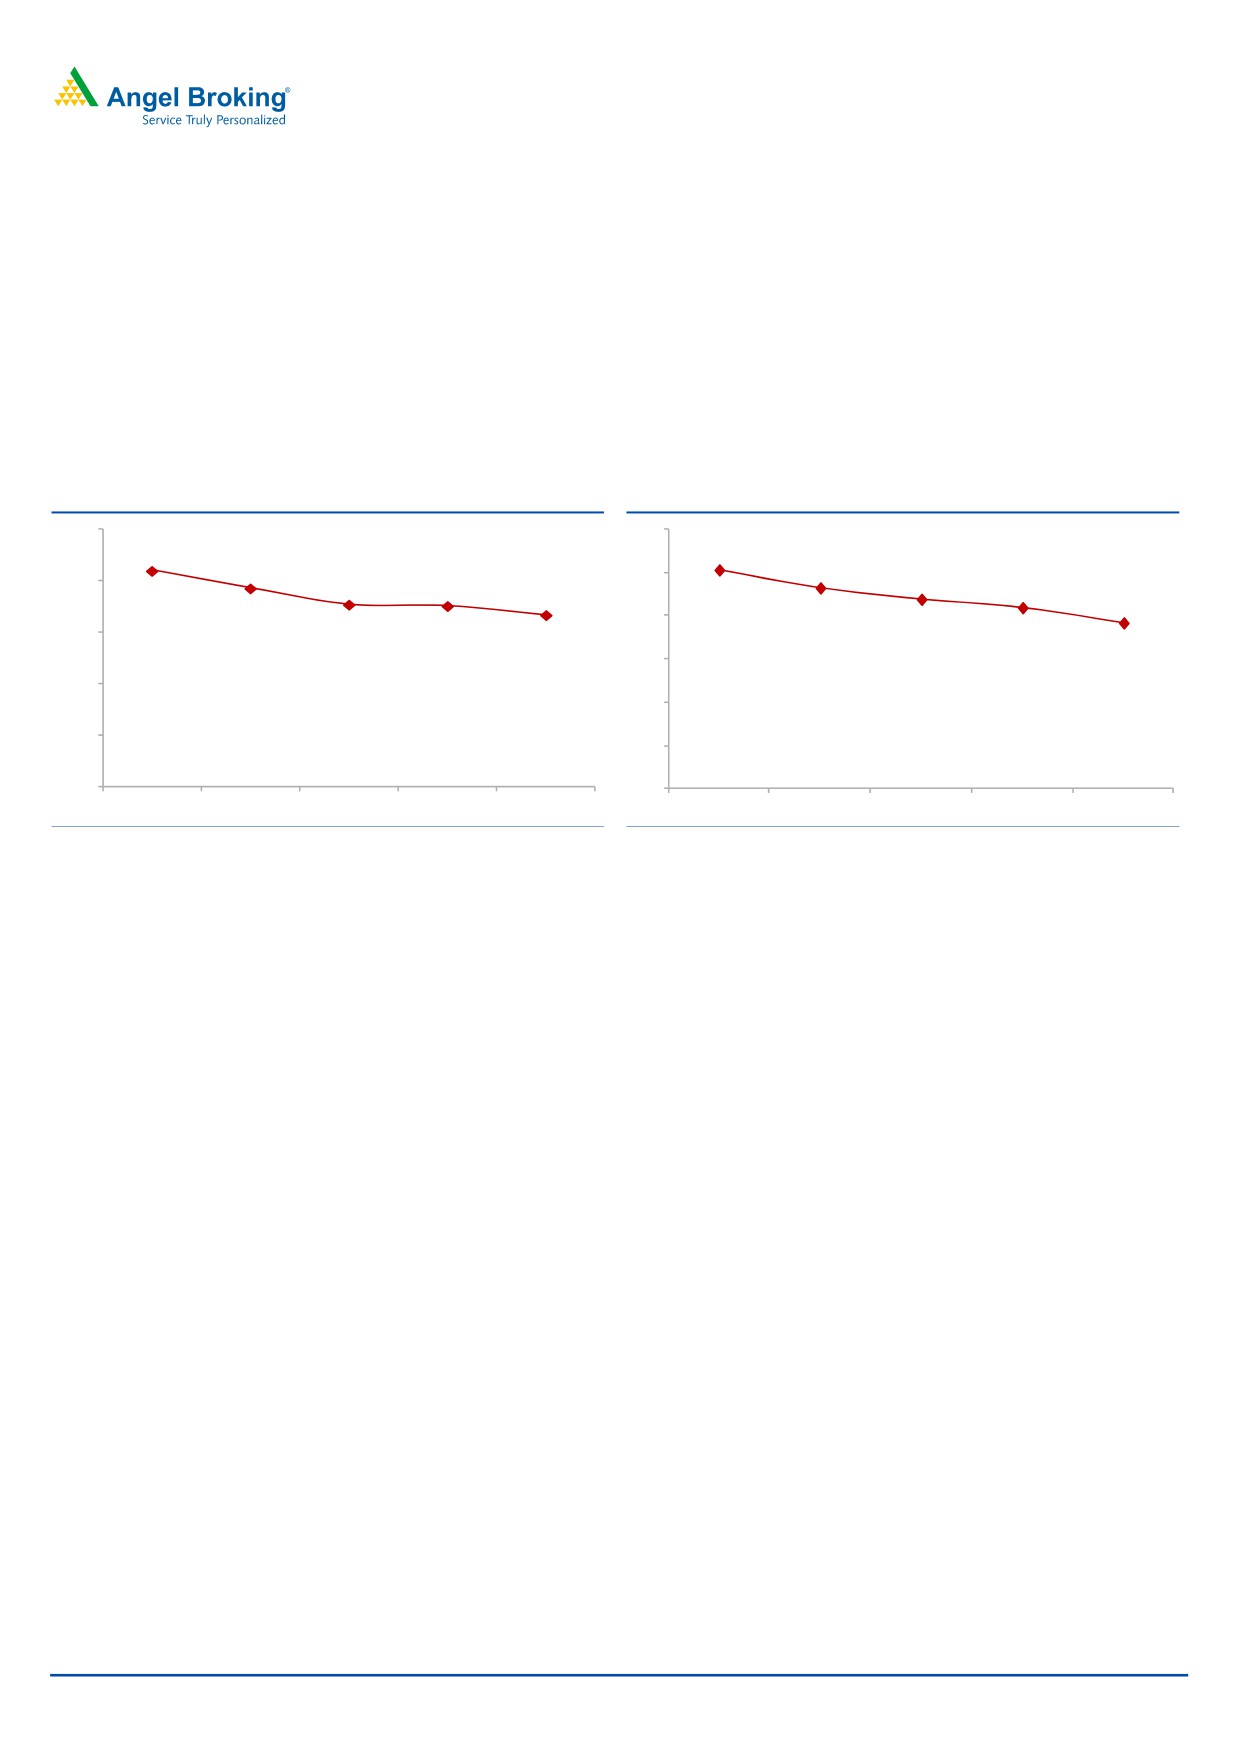
Cost structure has come down in the last few years
REPCO’s cost to income ratio has come down from 21% in FY2015 to ~16.4% by
9MFY2017, and we expect this to further trend down to ~15% by FY2019. The
company has been able to expand its business without being very aggressive on
branch expansion, which implies higher disbursements per branch. The average
loan per branch has gone up from `51.2cr in FY2014 to `66cr by FY2016.
Nevertheless, the company has expanded its branch network from 122 in FY2014
to 153 currently.
Exhibit 17: Cost/ Income (%)
Exhibit 18: Cost/ Asset (%)
25.0
1.2
21.0
1.0
19.3
0.9
1.0
0.9
20.0
17.7
17.6
0.8
16.7
0.8
0.8
15.0
0.6
10.0
0.4
5.0
0.2
0.0
0.0
FY15
FY16
FY17E
FY18E
FY19E
FY15
FY16
FY17E
FY18E
FY19E
Source: Company, Angel Research;
Source: Company, Angel Research
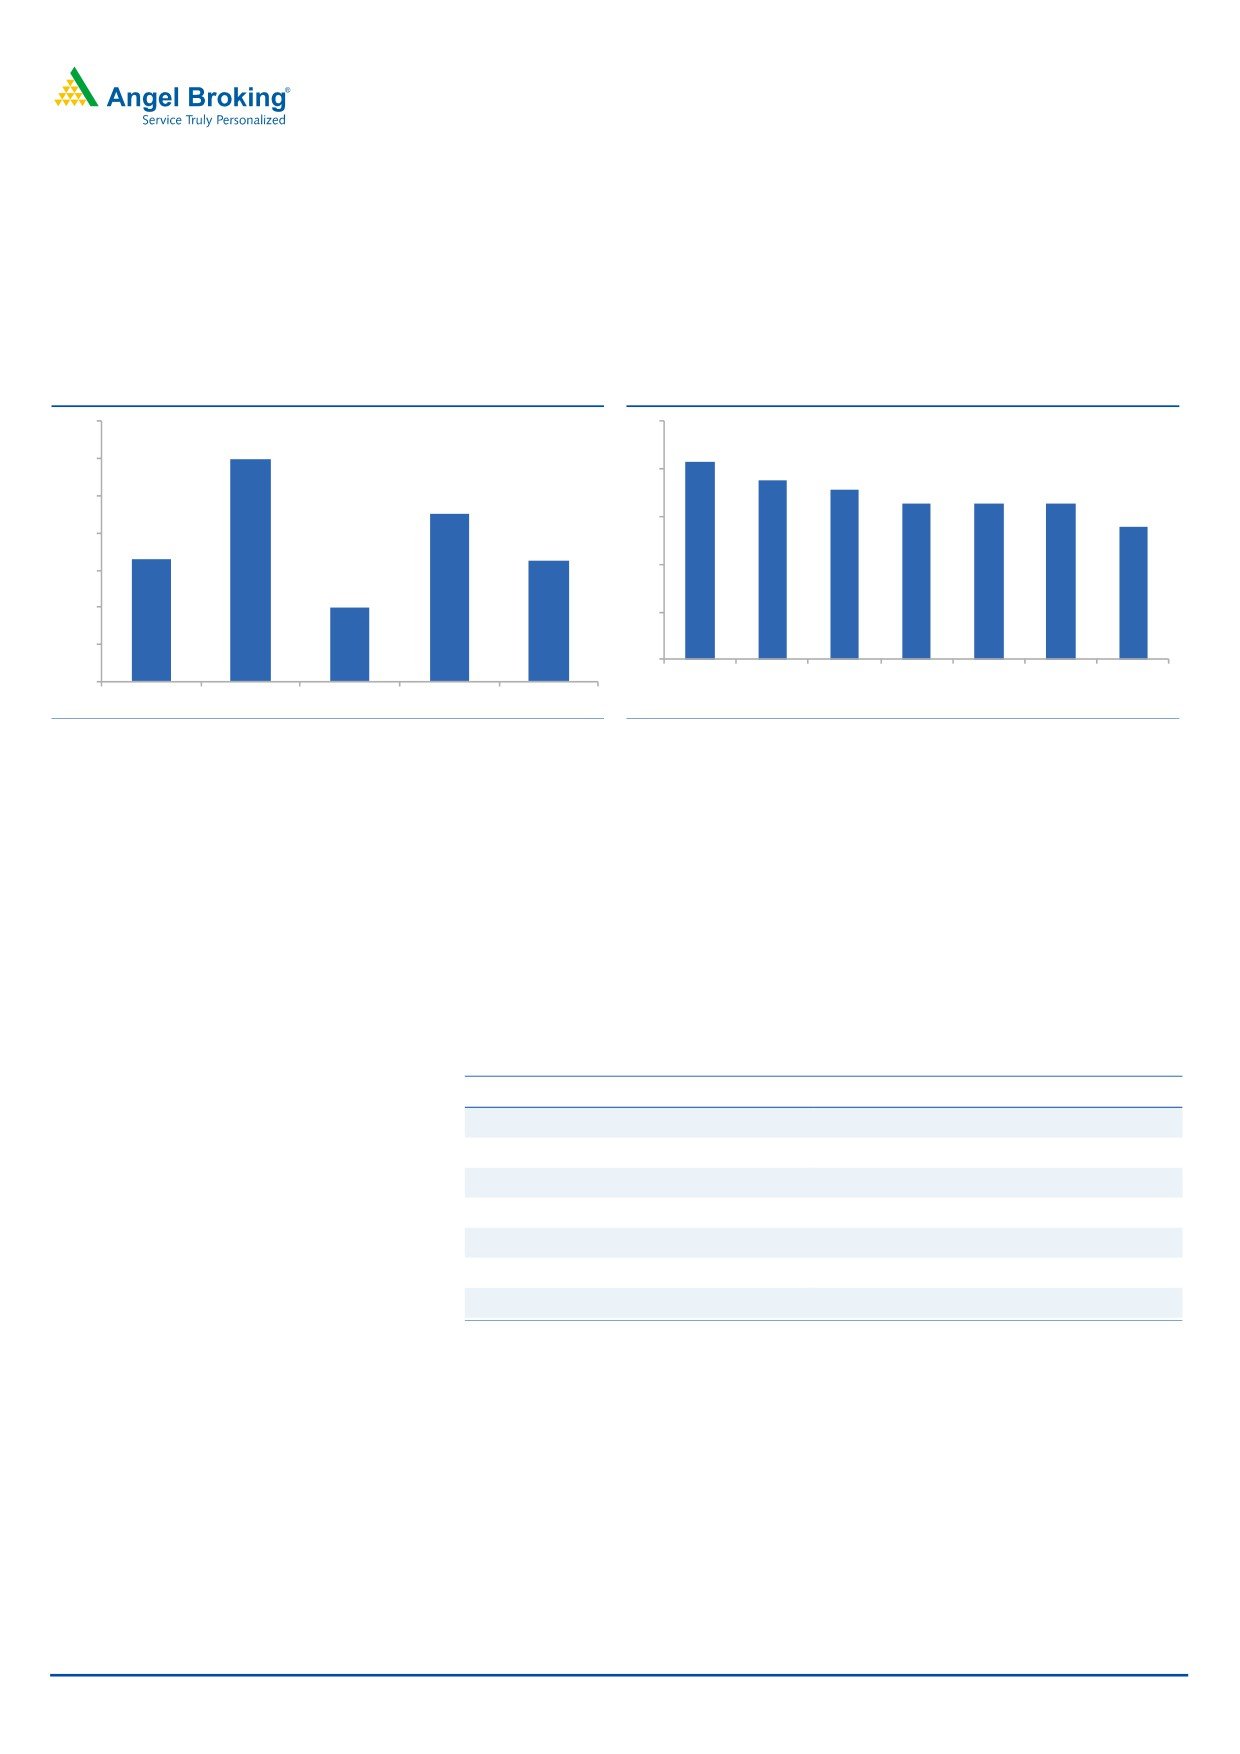
Increasing share of business from higher yielding segments has
ensured NIM sustaining at higher level
REPCO has always focused on the non salaried segment for business growth,
which is evident from its share of business which has gone up from 53.5% in
FY2012 to ~60% currently. The non salaried segment, while is perceived to be a
riskier segment as far as asset quality is concerned, REPCO has focused on the
small ticket size and while it has been able to generate better yield from that
segment, asset quality has also remained fairly under control. Further, the share of
high yielding LAP business has also gone up from 14% in FY2014 to ~20%
currently. All these factors have ensured strong NIM for the company in the last
many years. While the competition is intensifying within the mortgage business, the
non salaried segment is still not addressed aggressively by the large HFCs and this
leaves a vacuum for the company to grow for multiple years without compromising
on the margins.
March 3, 2017
7
REPCO Home | Initiating Coverage
Exhibit 19: NIM has remained healthy (%)
Exhibit 20: Comparative NIM(%) 3QFY17
6
4.6
4.5
5.0
4.5
5
4.2
4.2
4.1
4.0
4.4
4.4
4.4
4.4
4
3.5
3.1
2.8
3
4.3
4.2
2
4.2
1
4.1
0
4.0
India
Repco PNB Hsg Gruh Fin HDFC Can Fin DHFL LIC Hsg
FY15
FY16
FY17E
FY18E
FY19E
Bulls Hsg
Hom
Source: Company, Angel Research;
Source: Company, Angel Research
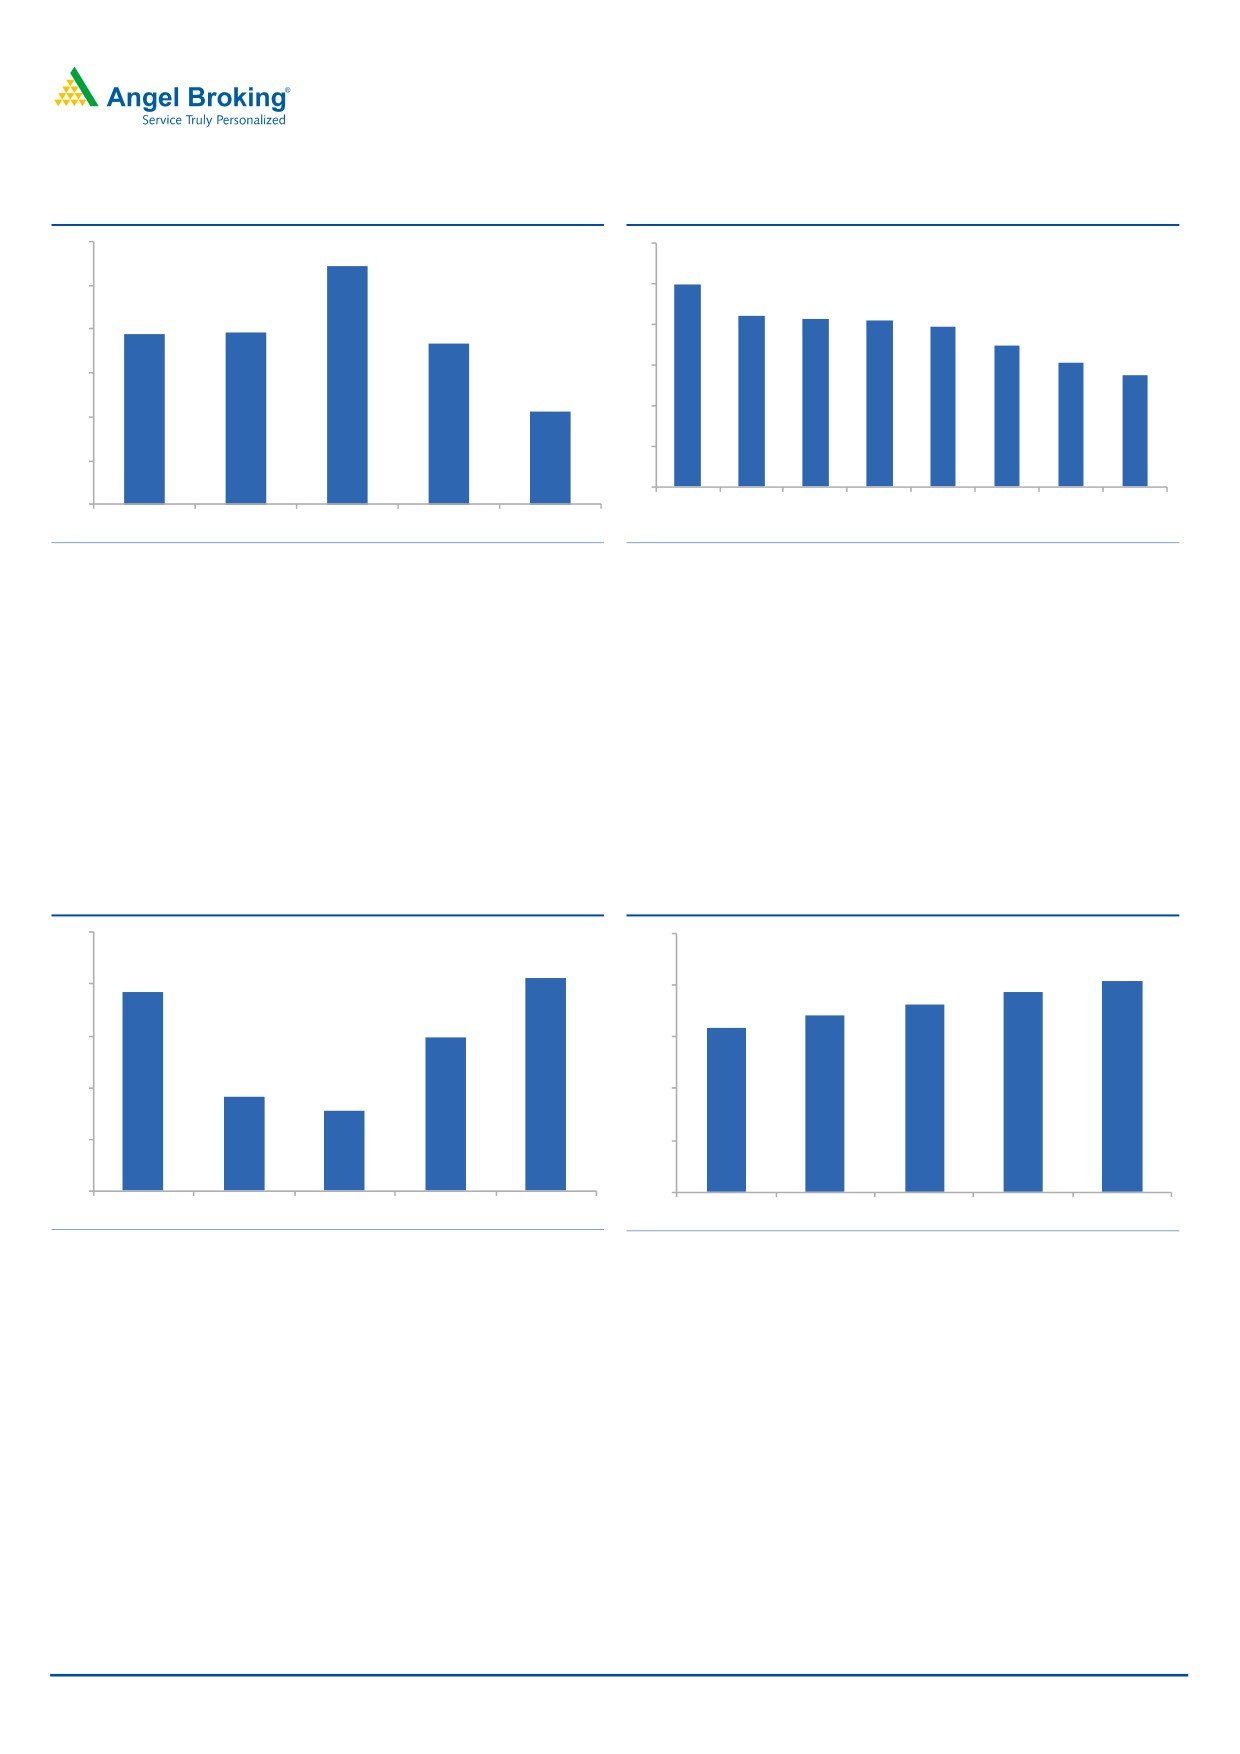
High credit cost dented the return ratios so far, expect RoE to
bounce back in FY2018
Despite higher credit cost, REPCO has enjoyed strong RoA and ROE of 2.4% and
17% respectively in FY2016. The cost structure of the company is moving in the
right direction and we feel that this coupled with lower credit cost should help in
better ROE going ahead. REPCO has a history of strong internal capital
generation, which coupled with lower leverage vis-à-vis other HFCs will allow it to
grow optimally without dilution in the near term, which should be RoE accretive.
Exhibit 21: ROA (%)
Exhibit 22: ROE (%)
2.6
25.0
2.6
20.3
2.5
19.2
2.6
20.0
18.0
17.0
15.9
2.5
2.5
15.0
2.4
2.5
10.0
2.4
2.4
5.0
2.4
0.0
FY15
FY16
FY17E
FY18E
FY19E
FY15
FY16
FY17E
FY18E
FY19E
Source: Company, Angel Research;
Source: Company, Angel Research
March 3, 2017
8
REPCO Home | Initiating Coverage
Underleveraged balance sheet leaves enough scope for growth: REPCO has a
CAR of ~20% largely from Tier I itself. REPCO has always maintained high capital
adequacy backed by its strong internal capital generation. The current leverage of
the company at 8x also is lower than other HFCs and this leaves enough scope for
growth without dilution in the near term.
Exhibit 23: CAR (%) Adequate for future growth
Exhibit 24: Comparative CAR (%)
21.0
25
20.8
20.8
20.8
18.8
20
17.8
16.4
16.4
16.3
20.6
20.5
14.0
15
20.4
20.3
20.3
10
20.2
20.0
20.0
5
19.8
0
19.6
Repco
Can Fin Gruh Fin HDFC PNB Hsg DHFL
LIC Hsg
FY15
FY16
FY17E
FY18E
FY19E
Hom
Source: Company, Angel Research;
Source: Company, Angel Research
REPCO’s LTV in-line with industry, while Average ticket size is
lower than industry standard
Though REPCO has been increasing its share of business from the non salaried
segment as well as from the LAP segment, it has very well managed the LTV, which
stands at 60-62%. For the Home Loans, the LTV is 70-72%, while for the LAP it is
50-52%. Further, the average ticket size of the company is `13 lakhs, which has
been reduced intentionally looking at the stress in some segments.
Exhibit 25: Average ticket Size FY2016
Company
` Lakhs
REPCO Homes
13.0
LIC Housing
21.0
DHFL
18.0
India Bulls Housing
25.0
PNB Housing
32.0
Gruh Finance
6.4
Can Fin Homes
17.4
Source: Company, Angel Research
March 3, 2017
9
REPCO Home | Initiating Coverage
Favorable change in source of funding to support higher NIMs
going ahead
While REPCO’s source of funding from NHB has declined, its share of borrowings
from Banks went up to 72.4% in FY2016 from 43% in FY2012. The same has
been reduced to 63% by 3QFY2017. However, on a comparative basis REPCO’s
dependence on bank borrowings has been much higher than other HFCs and
ability to borrow more from the low cost capital market should help in overall
reduction in cost of funds.
Exhibit 26: REPCO’s sources of funding trend
Exhibit 27: Comparative Source of funding
FY12
FY13
FY14
FY15
FY16
3QFY17
FY16
Banks
NCD NHB CP Others
Can Fin Homes
27
23
37
11
2
Banks
43.0
51.0
65.0
67.6
72.4
63.0
LIC Housing
13
77
2.7
1
6.3
NHB
47.0
37.0
25.0
21.4
13.9
17.0
DHFL
53
33
2
-
12
India Bulls Housing
49
38
-
-
13
REPCO Bank
10.0
12.0
10.0
7.9
7.6
7.0
PNB Housing
6
38
8
20
28
NCDs
0.0
0.0
0.0
2.0
6.1
11.0
Gruh Finance
38
-
39
-
23
CPs
0.0
0.0
0.0
1.2
0.0
3.0
Repco Home
72
6
14
-
8
Source: Company, Angel Research
Source: Company, Angel Research
Business so far continues to be focused on Southern states; likely
to tap newer geographies going forward
The company’s business continues to be concentrated in the southern markets,
which accounts for ~90% of the total loan book currently. However, over the next
five years, the management intends to expand in other geographies and also
expects to increase the share of non southern states to increase to ~30% from
current 10% levels.
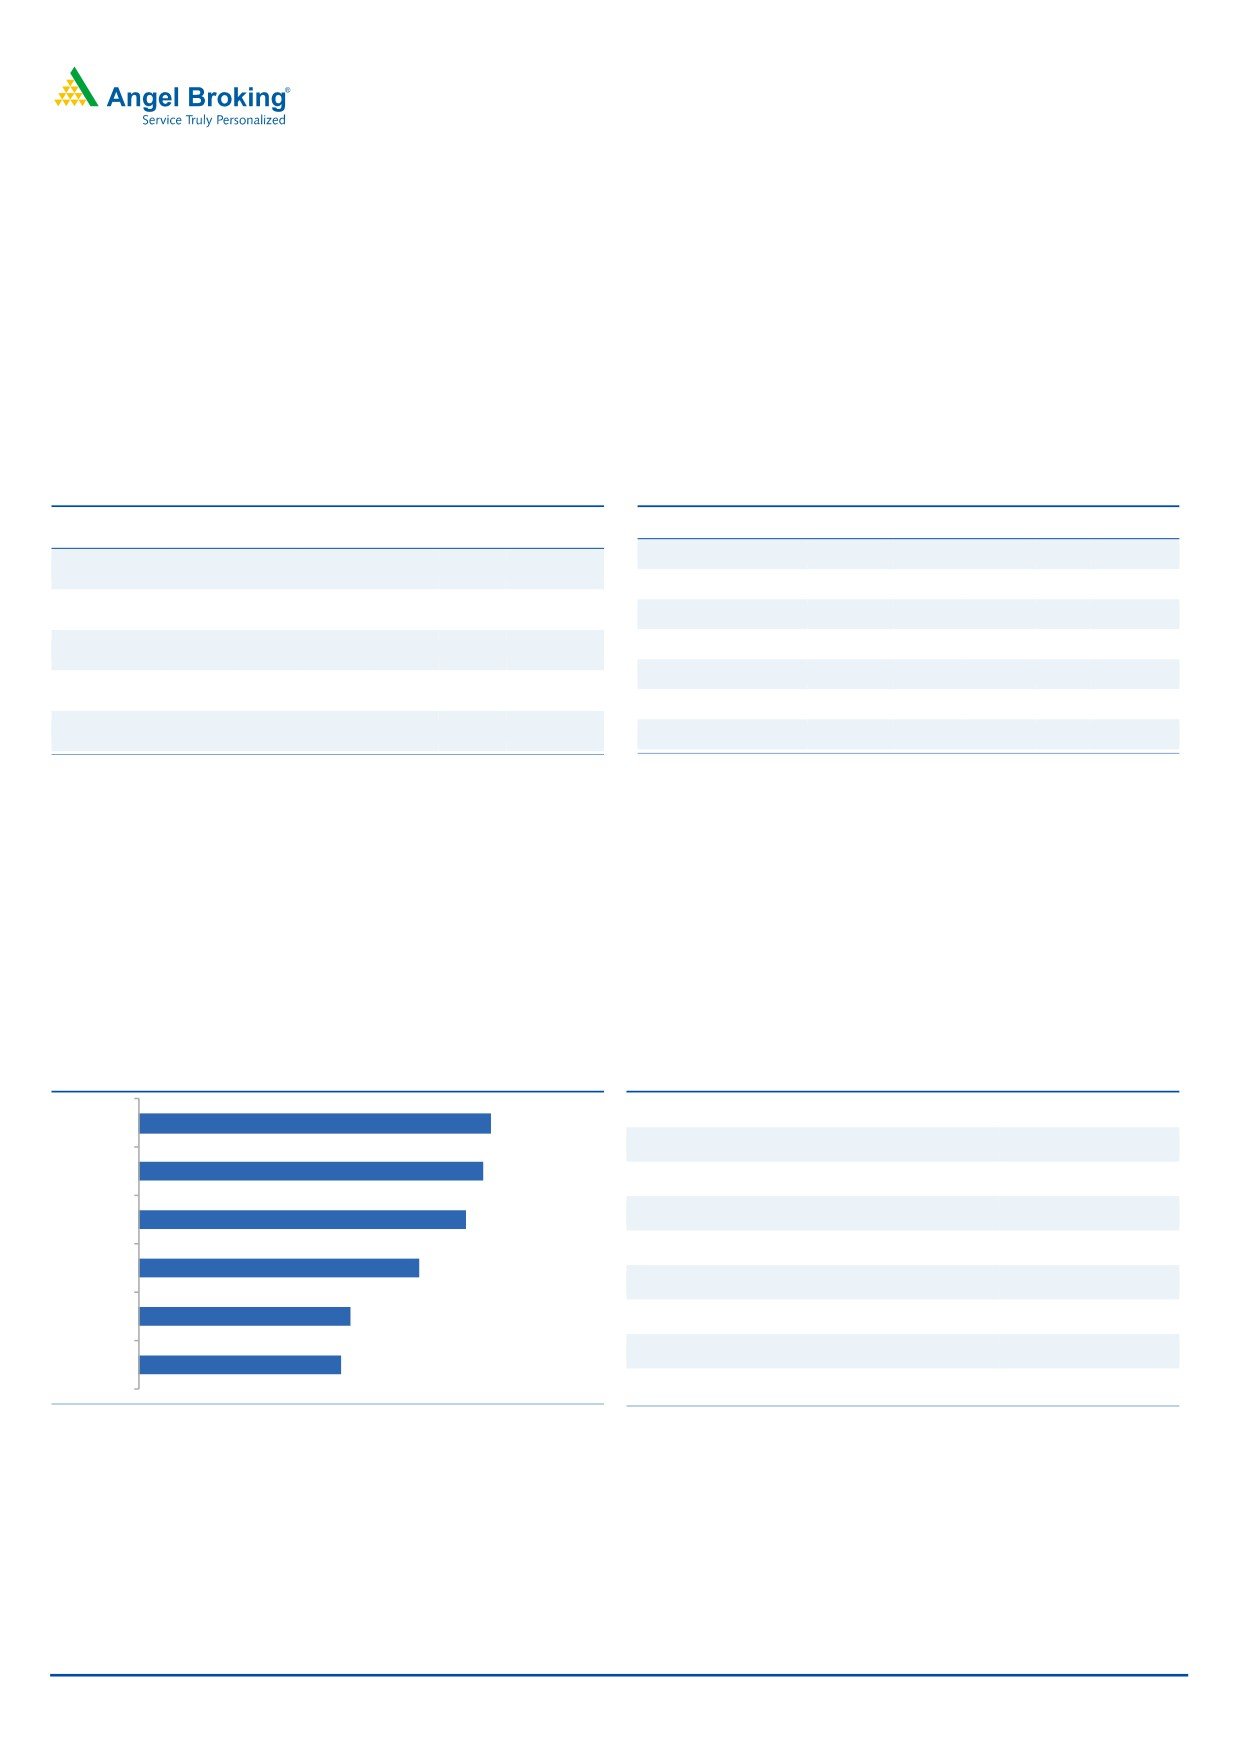
Exhibit 28: Branch Network
Exhibit 29: Business Concentration
Tamil Nadu
62%
9mFY17
153
Karnataka
12%
FY16
150
AP
7%
Maharastra
6%
FY15
142
Telangana
4%
FY14
122
Kerla
4%
FY13
92
Gujarat
2%
Others
2%
FY12
88
Total
100%
Source: Company, Angel Research
Source: Company, Angel Research
March 3, 2017
10
REPCO Home | Initiating Coverage
Outlook and valuation
The target segment of REPCO is highly underserved and this offers a growth
potential for many years going ahead. Unlevered balance sheet and stable NIM
coupled with controlled credit cost should result in 26% earnings CAGR over
FY2016-19E. At the CMP the stock is trading at 2.7x it FY2019 ABV. We have
valued the stock at 3.5x its FY2019E ABV and Recommend BUY with a Target Price
of `825 over the next 12 months.
Exhibit 30: Comparative Valuation & Return ration
P/BV
RoE%
RoA%
FY17E
FY18E
FY19E
FY17E
FY18E
FY19E
FY17E
FY18E
FY19E
Repco Home Fin
3.6
3.0
2.5
18.0
19.2
20.3
2.4
2.5
2.6
Can Fin Homes
4.9
4.0
3.2
23.6
24.1
25.6
1.9
1.9
2.0
LIC Hsg Fin
2.6
2.2
1.8
20.7
20.2
19.7
1.5
1.6
1.6
DHFL
1.7
1.5
1.3
16.4
17.0
17.6
1.2
1.3
1.3
Indiabulls Hsg Fin
3.0
2.7
2.4
25.2
27.2
28.8
3.6
3.6
3.3
Gruh Finance
13.3
10.8
9.1
29.9
29.8
31.3
2.3
2.3
2.3
Source: Company, Angel Research, Note: CMP as of March 03, 2017, * other companies Consensus taken from Bloomberg,
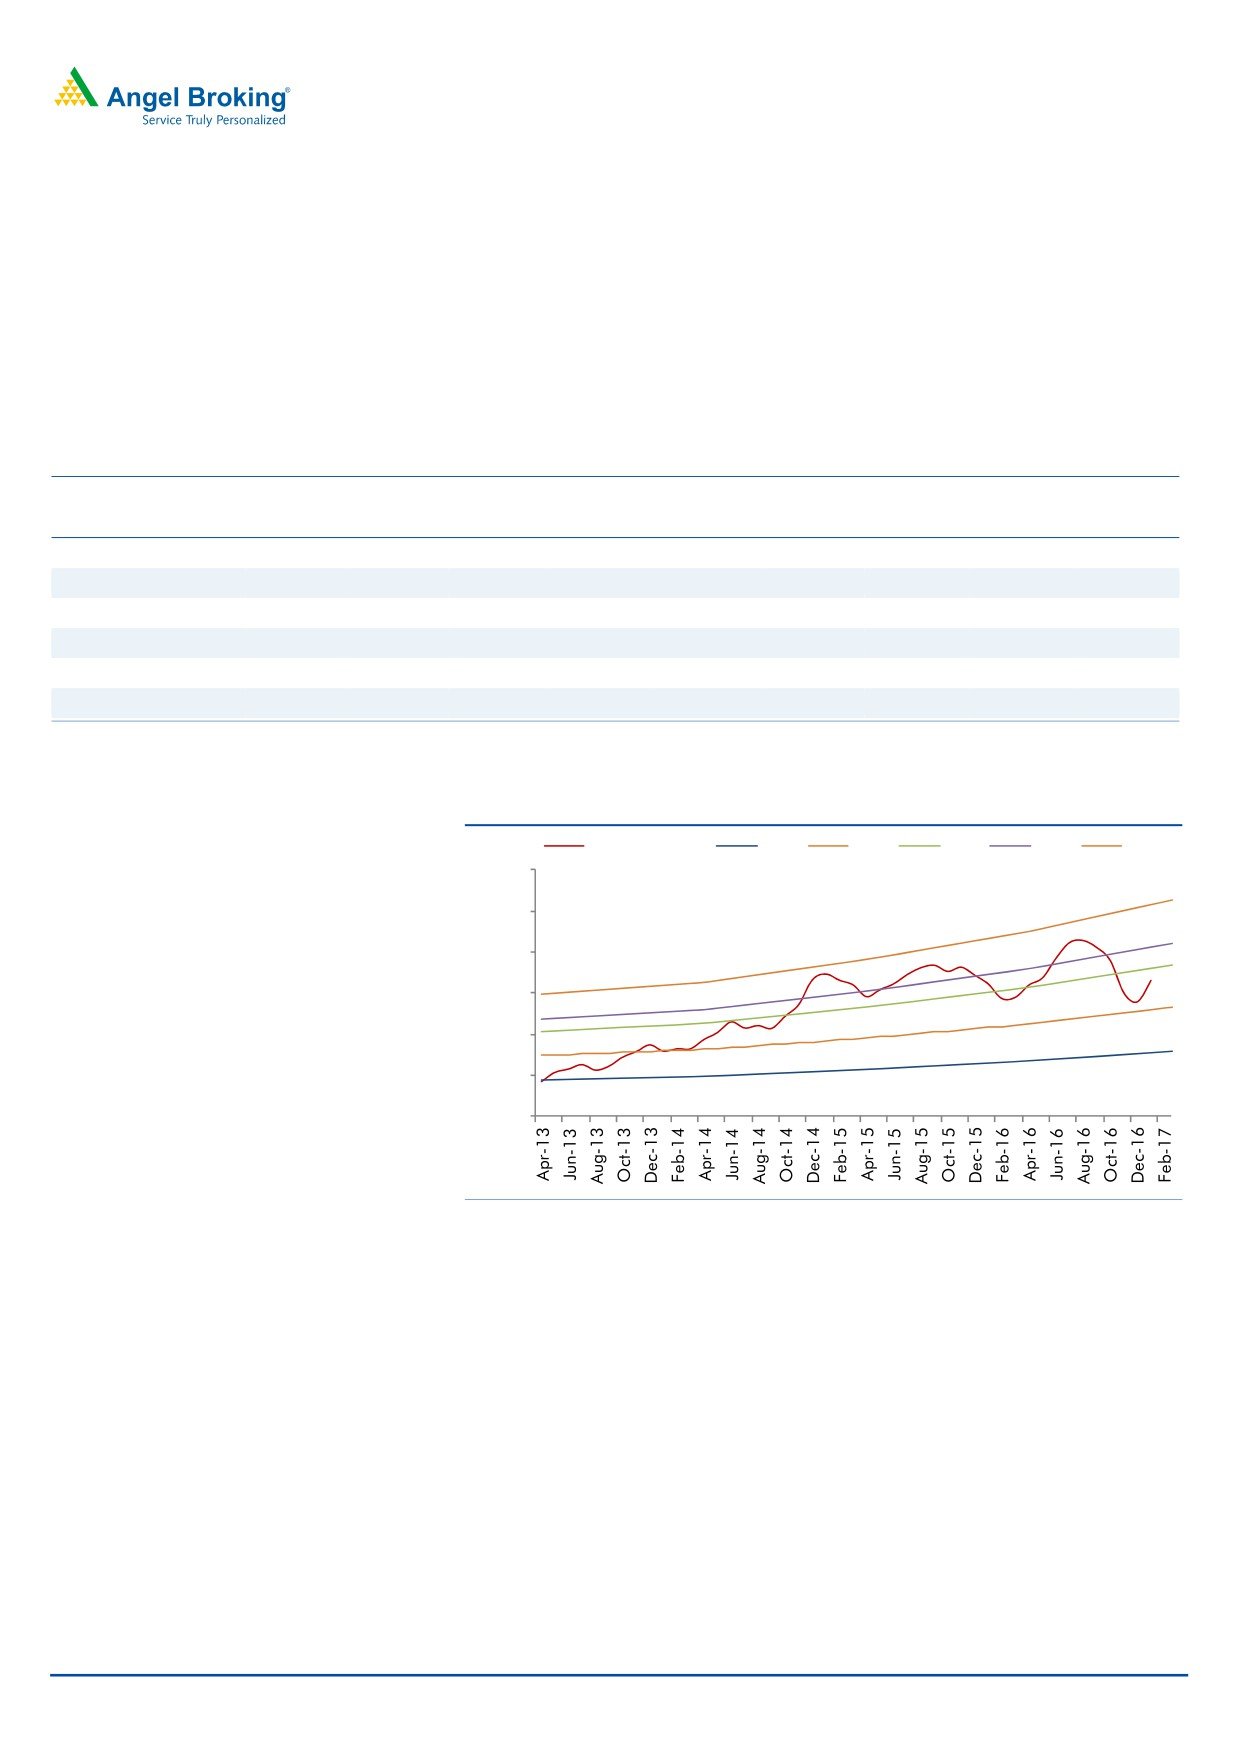
Exhibit 31: One Year Forward P/BV
Close -Unit Curr
1.5 X
2.5 X
3.5 X
4.0 X
5.0 X
1,200
1,000
800
600
400
200
0
Source: Company, Angel Research
March 3, 2017
11
REPCO Home | Initiating Coverage
Company Background
REPCO Home Finance a midsized Housing Finance Company with a focus on the
non salaried segment. Headquartered in Chennai, the company operates through
121 branches and 32 satellite centers across 11 states and the Union Territory of
Pondicherry. Tamil Nadu is the largest market for the company and accounts for
~62% of its loan book, while the five southern states combined account for ~89%
of the loan book. However, gradually the company intends to expand into other
geographies gradually. The non salaried segment was not aggressively tapped by
other HFCs and Banks and REPCO took the opportunity and has been a successful
player in the segment.
Key Risks & Concerns
REPCO has a high concentration in the southern states, which combined account
for ~89% of the business. Any geopolitical issues and natural calamity can impact
the growth and profitability of the company.
Over the last few years REPCO has grown its LAP portfolio quite aggressively and
any sharp drop in property prices can result in pressure in asset quality. However,
the management doesn’t intend to increase LAP portfolio beyond 20% of its total
loan book and hence we don’t expect incrementally much stress to arise
Exhibit 32: Comparative DuPont Analysis for FY16
Can Fin
LIC
India
PNB
Gruh
DHFL
Repco
Home Housing
Bulls
HSG
Fin
Interest Income
10.9
10.1
11.4
11.6
10.4
11.9
12.3
Interest expenses
7.8
7.7
9.0
7.4
7.6
7.8
7.9
Net Interest margin
3.1
2.4
2.4
4.2
2.8
4.1
4.4
Fees & Other Income
0.4
0.2
0.6
2.0
0.6
0.5
0.4
Total Income
3.6
2.6
3.0
6.1
3.4
4.5
4.8
Employee Exp
0.3
0.1
0.4
0.6
0.3
0.4
0.6
Other exp
0.4
0.3
0.5
0.3
0.7
0.4
0.3
Opex
0.7
0.4
0.9
0.9
1.0
0.8
0.9
PPP
2.9
2.2
2.1
5.3
2.4
3.7
3.9
Provision
0.2
0.1
0.3
0.6
0.3
0.2
0.6
PBT
2.7
2.1
1.8
4.7
2.1
3.5
3.3
Tax
1.0
0.7
0.6
1.2
0.7
1.1
1.2
RoA
1.6
1.4
1.2
3.5
1.3
2.4
2.2
Leverage
11.6
14.3
12.7
7.7
13.1
13.3
7.8
RoE (%)
19.0
19.6
15.1
27.0
17.6
31.5
17.0
Source: Company, Angel Research
March 3, 2017
12
REPCO Home | Initiating Coverage
Income statement (Standalone)
Y/E March (` cr)
FY15
FY16
FY17E
FY18E
FY19E
Net Interest Income
237
304
388
457
551
- YoY Growth (%)
13.3
28.0
27.6
18.0
20.5
Other Income
24
30
35
42
51
- YoY Growth (%)
-
25.7
18.0
20.0
20.0
Operating Income
261
334
423
499
602
- YoY Growth (%)
23.9
27.8
26.7
18.1
20.5
Operating Expenses
55
64
75
88
100
- YoY Growth (%)
41.1
17.5
16.4
17.2
14.5
Pre - Provision Profit
206
269
348
412
501
- YoY Growth (%)
20.0
30.6
29.2
18.3
21.8
Prov. & Cont.
20
39
59
52
52
- YoY Growth (%)
(11.5 )
92.0
52.9
(12.3 )
-
Profit Before Tax
186
230
289
360
449
- YoY Growth (%)
24.9
23.9
25.2
24.6
24.9
Prov. for Taxation
63
80
101
122
148
- as a % of PBT
33.9
34.7
35.0
34.0
33.0
PAT
123
150
188
237
301
- YoY Growth (%)
11.8
22.4
24.7
26.5
26.8
Balance sheet (Standalone)
Y/E March (` cr)
FY15
FY16
FY17E
FY18E
FY19E
Share Capital
62
63
63
63
63
Reserve & Surplus
750
892
1,063
1,280
1,555
Net Worth
812
955
1,126
1,342
1,617
Borrowings
4,365
5,522
6,627
8,151
10,066
Growth (%)
31.9
26.5
20.0
23.0
23.5
Other Liab. & Prov.
899
1,286
1,556
2,134
2,855
Total Liabilities
6,076
7,763
9,309
11,628
14,539
Cash & Bank Balance
18
20
20
20
20
Investments
12
12
15
15
15
Advances
6,023
7,705
9,246
11,557
14,447
- Growth (%)
29.0
27.9
20.0
25.0
25.0
Fixed Assets
9
9
10
15
35
Other Assets
14
17
18
20
22
Total Assets
6,076
7,763
9,309
11,628
14,539
March 3, 2017
13
REPCO Home | Initiating Coverage
Ratio analysis (Standalone)
Y/E March
FY15
FY16
FY17E
FY18E
FY19E
Profitability ratios (%)
NIMs
4.4
4.4
4.5
4.4
4.2
Cost to Income Ratio
21.0
19.3
17.7
17.6
16.7
Cost to Asset Ratio
1.0
0.9
0.9
0.8
0.8
RoA
2.5
2.4
2.4
2.5
2.6
RoE
15.9
17.0
18.0
19.2
20.3
Capital Adequacy (%)
CAR %
20.3
20.8
20.0
20.5
20.3
Tier I
20.3
20.8
20.0
20.5
20.3
Asset Quality (%)
Gross NPAs (` Cr )
79
101
250
289
289
Net NPAs ( ` Cr)
30
37
139
144
144
Gross NPAs (%)
1.3
1.3
2.7
2.5
2.0
Net NPAs (%)
0.5
0.5
1.5
1.3
1.0
Credit Cost (%)
0.3
0.5
0.7
0.5
0.4
Provision coverage
62
64
44
50
50
Per Share Data (`)
EPS
19.7
24.1
30.0
38.0
48.1
BVPS
130
153
180
215
259
ABVPS
125
147
158
192
235
DPS
1.5
1.8
2.2
2.8
3.6
Valuation Ratios
PER (x)
32.6
26.7
21.4
16.9
13.4
P/ BVPS(x)
4.9
4.2
3.6
3.0
2.5
P/ABVPS (x)
5.1
4.4
4.1
3.4
2.7
Dividend Yield
0.2
0.3
0.3
0.4
0.5
DuPont Analysis
Interest Income
12.4
12.3
12.0
11.4
10.9
Interest Expenses
8.0
7.9
7.5
7.1
6.7
NII
4.4
4.4
4.5
4.4
4.2
Non Interest Income
0.4
0.4
0.4
0.4
0.4
Total Revenues
4.8
4.8
5.0
4.8
4.6
Operating Cost
1.0
0.9
0.9
0.8
0.8
PPP
3.8
3.9
4.1
3.9
3.8
Total Provisions
0.4
0.6
0.7
0.5
0.4
PBT
3.4
3.3
3.4
3.4
3.4
Tax
1.2
1.2
1.2
1.2
1.1
ROA
2.3
2.2
2.2
2.3
2.3
Leverage
7.0
7.8
8.2
8.5
8.8
RoE (%)
15.9
17.0
18.0
19.2
20.3
March 3, 2017
14
REPCO Home | Initiating Coverage
Research Team Tel: 022 - 39357800
DISCLAIMER
Angel Broking Private Limited (hereinafter referred to as “Angel”) is a registered Member of National Stock Exchange of India Limited,
Bombay Stock Exchange Limited and Metropolitan Stock Exchange Limited. It is also registered as a Depository Participant with CDSL
and Portfolio Manager with SEBI. It also has registration with AMFI as a Mutual Fund Distributor. Angel Broking Private Limited is a
registered entity with SEBI for Research Analyst in terms of SEBI (Research Analyst) Regulations, 2014 vide registration number
INH000000164. Angel or its associates has not been debarred/ suspended by SEBI or any other regulatory authority for accessing
/dealing in securities Market. Angel or its associates/analyst has not received any compensation / managed or co-managed public
offering of securities of the company covered by Analyst during the past twelve months.
This document is solely for the personal information of the recipient, and must not be singularly used as the basis of any investment
decision. Nothing in this document should be construed as investment or financial advice. Each recipient of this document should
make such investigations as they deem necessary to arrive at an independent evaluation of an investment in the securities of the
companies referred to in this document (including the merits and risks involved), and should consult their own advisors to determine
the merits and risks of such an investment.
Reports based on technical and derivative analysis center on studying charts of a stock's price movement, outstanding positions and
trading volume, as opposed to focusing on a company's fundamentals and, as such, may not match with a report on a company's
fundamentals. Investors are advised to refer the Fundamental and Technical Research Reports available on our website to evaluate the
contrary view, if any.
The information in this document has been printed on the basis of publicly available information, internal data and other reliable
sources believed to be true, but we do not represent that it is accurate or complete and it should not be relied on as such, as this
document is for general guidance only. Angel Broking Pvt. Limited or any of its affiliates/ group companies shall not be in any way
responsible for any loss or damage that may arise to any person from any inadvertent error in the information contained in this report.
Angel Broking Pvt. Limited has not independently verified all the information contained within this document. Accordingly, we cannot
testify, nor make any representation or warranty, express or implied, to the accuracy, contents or data contained within this document.
While Angel Broking Pvt. Limited endeavors to update on a reasonable basis the information discussed in this material, there may be
regulatory, compliance, or other reasons that prevent us from doing so.
This document is being supplied to you solely for your information, and its contents, information or data may not be reproduced,
redistributed or passed on, directly or indirectly.
Neither Angel Broking Pvt. Limited, nor its directors, employees or affiliates shall be liable for any loss or damage that may arise from
or in connection with the use of this information.
Disclosure of Interest Statement
REPCO Home
1. Financial interest of research analyst or Angel or his Associate or his relative
No
2. Ownership of 1% or more of the stock by research analyst or Angel or associates or relatives
No
3. Served as an officer, director or employee of the company covered under Research
No
4. Broking relationship with company covered under Research
No
Ratings (Based on expected returns
Buy (> 15%)
Accumulate (5% to 15%)
Neutral (-5 to 5%)
over 12 months investment period):
Reduce (-5% to -15%)
Sell (< -15)
March 3, 2017
15