2QFY2016 Result Update | Oil & Gas
October 23, 2015
Reliance Industries
ACCUMULATE
CMP
`1,050
Refining margins surprise
Target Price
`955
Investment Period
12 Months
Consolidated (` cr)
2QFY16
2QFY15
yoy (%) 1QFY16
qoq%
Net revenue
70,901
1,09,797
(35.4)
77,130
(8.1)
Stock Info
EBITDA
10,704
9,818
9.0
10,177
5.2
Sector
Oil & Gas
Margin (%)
15.1
8.9
616bp
13.2
190bp
Market Cap (` cr)
3,09,454
Reported PAT
6,625
5,924
11.8
6,137
8.0
Net Debt (` cr)
87,045
Source: Company, Angel Research
Beta
1.1
Reliance Industries (RIL)’ net sales for 2QFY2016 declined by 35% yoy to
52 Week High / Low
1,067/797
`70,901cr as against `109,797cr in the corresponding quarter last year, due to
Avg. Daily Volume
38,02,145
fall in crude oil prices. The EBITDA however increased by 9% yoy to `10,704cr,
Face Value (`)
10
way ahead of consensus estimates, led by strong gross refining margin (GRM)
BSE Sensex
27,307
and better-than-expected EBITDA of the petrochemical division. The GRM stood at
Nifty
8,262
$10.6/bbl for the quarter, the highest in seven years, as against $8.3/bbl in
Reuters Code
RELI.BO
2QFY2015, and was ahead of consensus estimates. The outperformance over the
Bloomberg Code
RIL IN
Singapore GRM, by $4.3/bbl, is also the highest in six years.
The Petrochemicals segment’s revenue declined by 20% yoy to `21,239cr, led by
Shareholding Pattern (%)
lower crude and feedstock prices. The segment’s EBIT however increased by 7.2%
Promoters
45.2
yoy to `2,531cr, led by strong polymer deltas and healthy polyester chain deltas,
FII / NRIs / OCBs
18.7
coupled with higher volumes. The E&P business continued to drag profitability and
MF / Banks / Indian Fls
13.1
the outlook for the business continues to remain weak. The Retail division
Indian Public / Others
23.0
continued to add stores, helping drive revenue growth. RIL is building up an
ecosystem for distribution of Jio devices; the company is gearing up for its roll out
which would be in a phased manner. Reliance Retail will soon be launching its
Abs. (%)
3m 1yr
3yr
own brand of 4G LTE smart phones under the brand ‘LYF’.
Sensex
(3.9)
3.3
46.2
Outlook and valuation: We believe RIL’s growth will be driven by its core Refining
RIL
(6.8)
2.2
19.0
and Petrochemicals business. We value the refining business at 7x EBITDA, while
we assign a 6.5x multiple to the Petrochemicals business. We value the Telecom
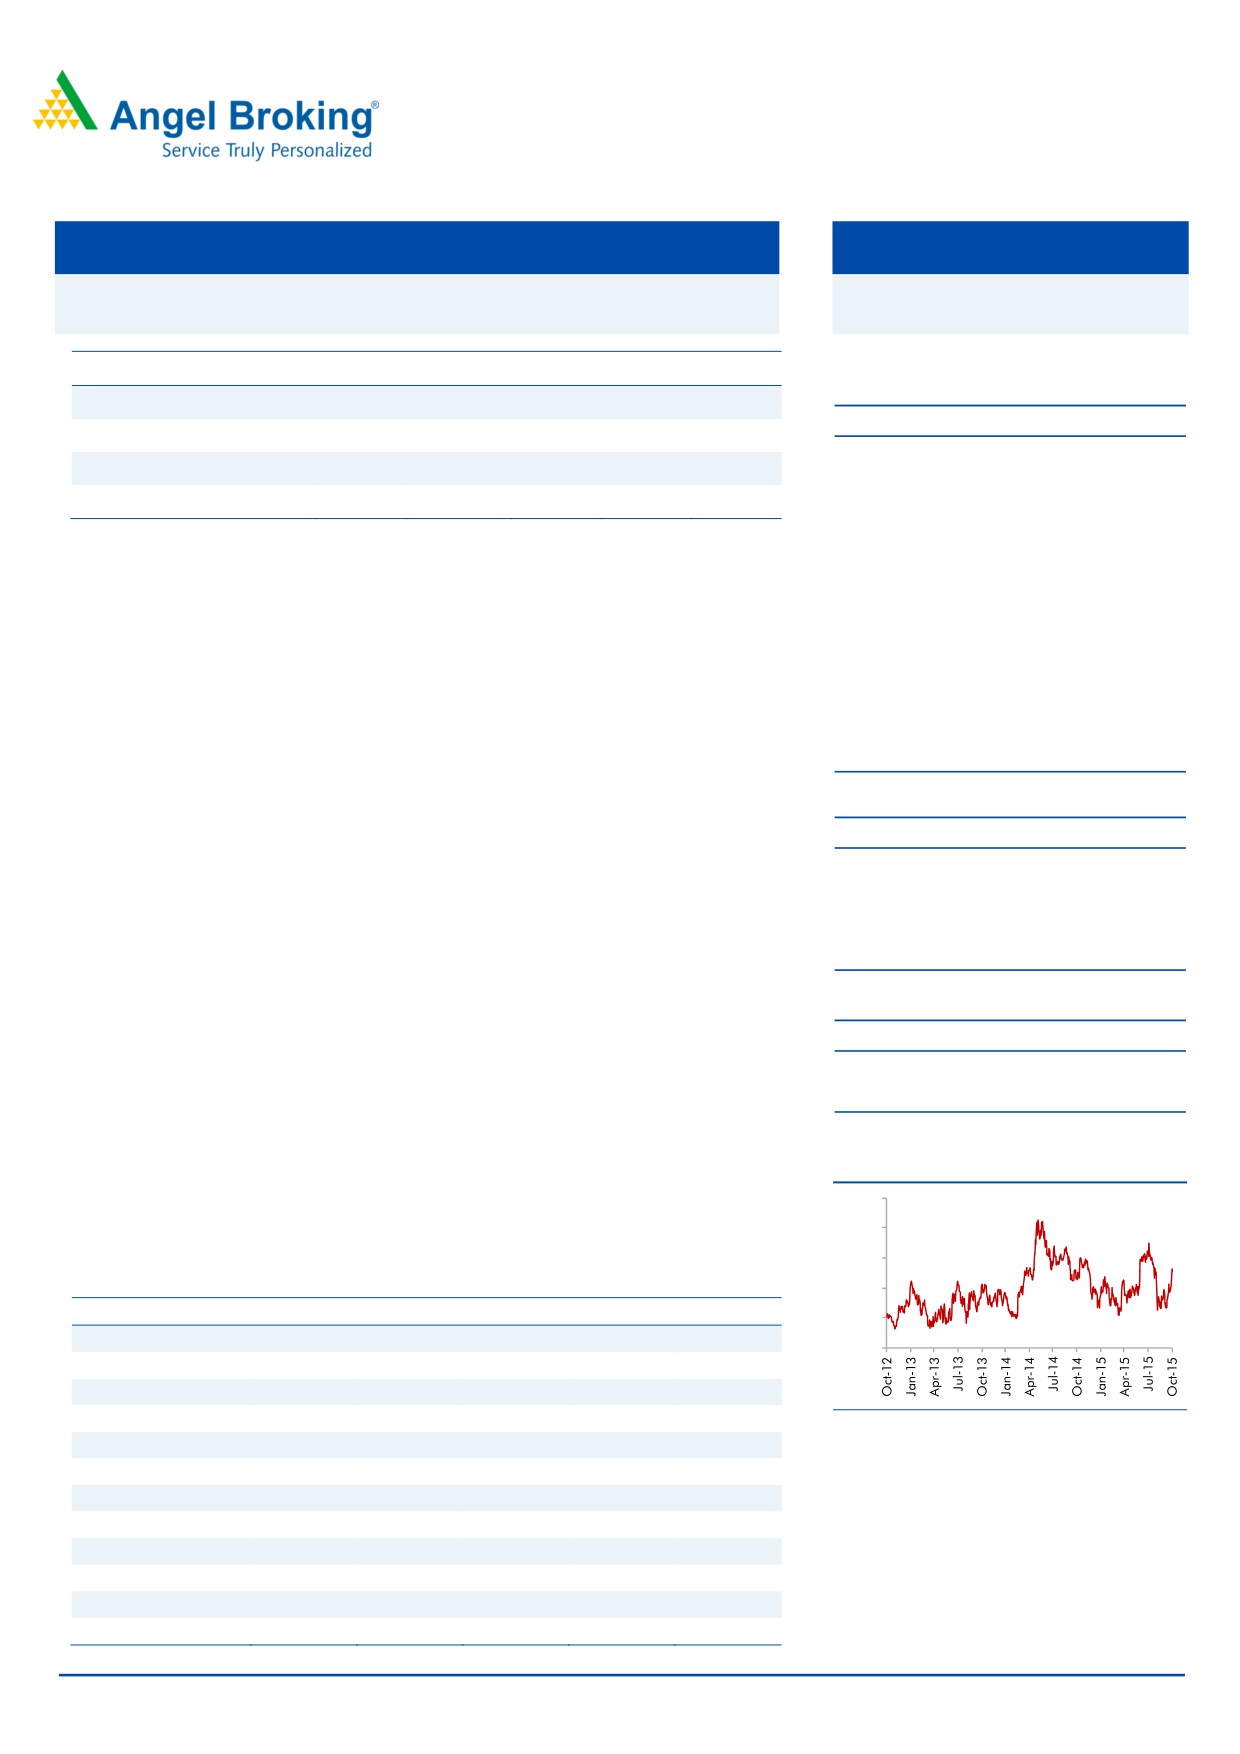
3-year price chart
business at 0.3x invested capital, and the Retail business at 1x sales. We retain
1,200
our Accumulate rating on the stock with a target price of `1,050, implying a 10%
1,100
upside from the current levels.
1,000
Key financials (Standalone)
900
Y/E March (` cr)
FY2013
FY2014
FY2015
FY2016E
FY2017E
800
Revenue
3,60,297
3,90,117
3,29,076
3,04,775
3,44,392
700
% chg
9.2
8.3
(15.6)
(7.4)
13.0
Adj. net profit
19,716
20,173
20,397
26,883
30,227
% chg
4.8
2.3
1.1
31.8
12.4
Source: Company, Angel Research
Adj. EPS (`)
67.2
68.6
69.3
91.3
102.6
OPM (%)
8.5
7.9
9.6
12.6
13.4
P/E (x)
13.3
12.8
12.4
10.5
9.3
P/BV (x)
1.6
1.4
1.3
1.2
1.1
RoE (%)
12.1
11.7
11.0
11.8
12.0
RoCE (%)
8.8
8.2
7.7
9.0
9.5
Rahul Dholam
EV/Sales (x)
0.8
0.9
1.1
1.2
1.0
Tel: 022- 3935 7800 Ext: 6847
EV/EBIDTA
9.9
10.8
11.6
9.7
7.8
Source: Company, Angel Research; Note: CMP as of October 21, 2015
Please refer to important disclosures at the end of this report
1
Reliance Industries | 2QFY2016 Result Update
Exhibit 1: 2QFY2016 performance (Consolidated)
(` cr)
2QFY16
2QFY15
yoy%
1QFY16
qoq%
FY2015
FY2014
yoy%
Net sales
70,901
1,09,797
(35.4)
77,130
(8.1)
3,75,435
4,34,460
(13.6)
Raw Material Cost
49,451
88,744
(44.3)
55,922
(11.6)
2,94,046
3,63,022
(19.0)
% of net sales
69.7
80.8
72.5
78.3
83.6
Employee Cost
1,786
1,575
13.4
1,976
(9.6)
6,262
5,572
12.4
% of net sales
2.5
1.4
2.6
1.7
1.3
Other expenditure
8,960
9,660
(7.2)
9,055
(1.0)
37,763
31,067
21.6
% of net sales
12.6
8.8
11.7
10.1
7.2
Total expenditure
60,197
99,979
(39.8)
66,953
(10.1)
3,38,071
3,99,661
(15.4)
% of net sales
84.9
91.1
86.8
90.0
92.0
EBITDA
10,704
9,818
9.0
10,177
5.2
37,364
34,799
7.4
Margin (%)
15.1
8.9
616bp
13.2
190bp
10.0
8.0
709bp
Interest
972
997
(2.5)
902
7.8
3,316
3,836
(13.6)
Depreciation
3,171
3,024
4.9
3,041
4.3
11,547
11,201
3.1
Other income
1,848
2,009
(8.0)
1,832
0.9
8,495
8,911
(4.7)
Profit before tax
8,409
7,806
7.7
8,066
4.3
30,996
28,673
8.1
% of net sales
11.9
7.1
10.5
8.3
6.6
Tax
1,784
1,882
1,929
7,474
6,215
20.3
% of PBT
21.2
24.1
23.9
24.1
21.7
Net Profit
6,625
5,924
11.8
6,137
8.0
23,522
22,458
4.7
Minority Int. / Share of ass.
95
48
85
44
35
Reported Net Profit
6,720
5,972
12.5
6,222
8.0
23,566
22,493
4.8
Adjusted Net Profit
6,521
5,972
9.2
6,222
4.8
23,566.0
22,493.0
4.8
Source: Company, Angel Research
Result highlights
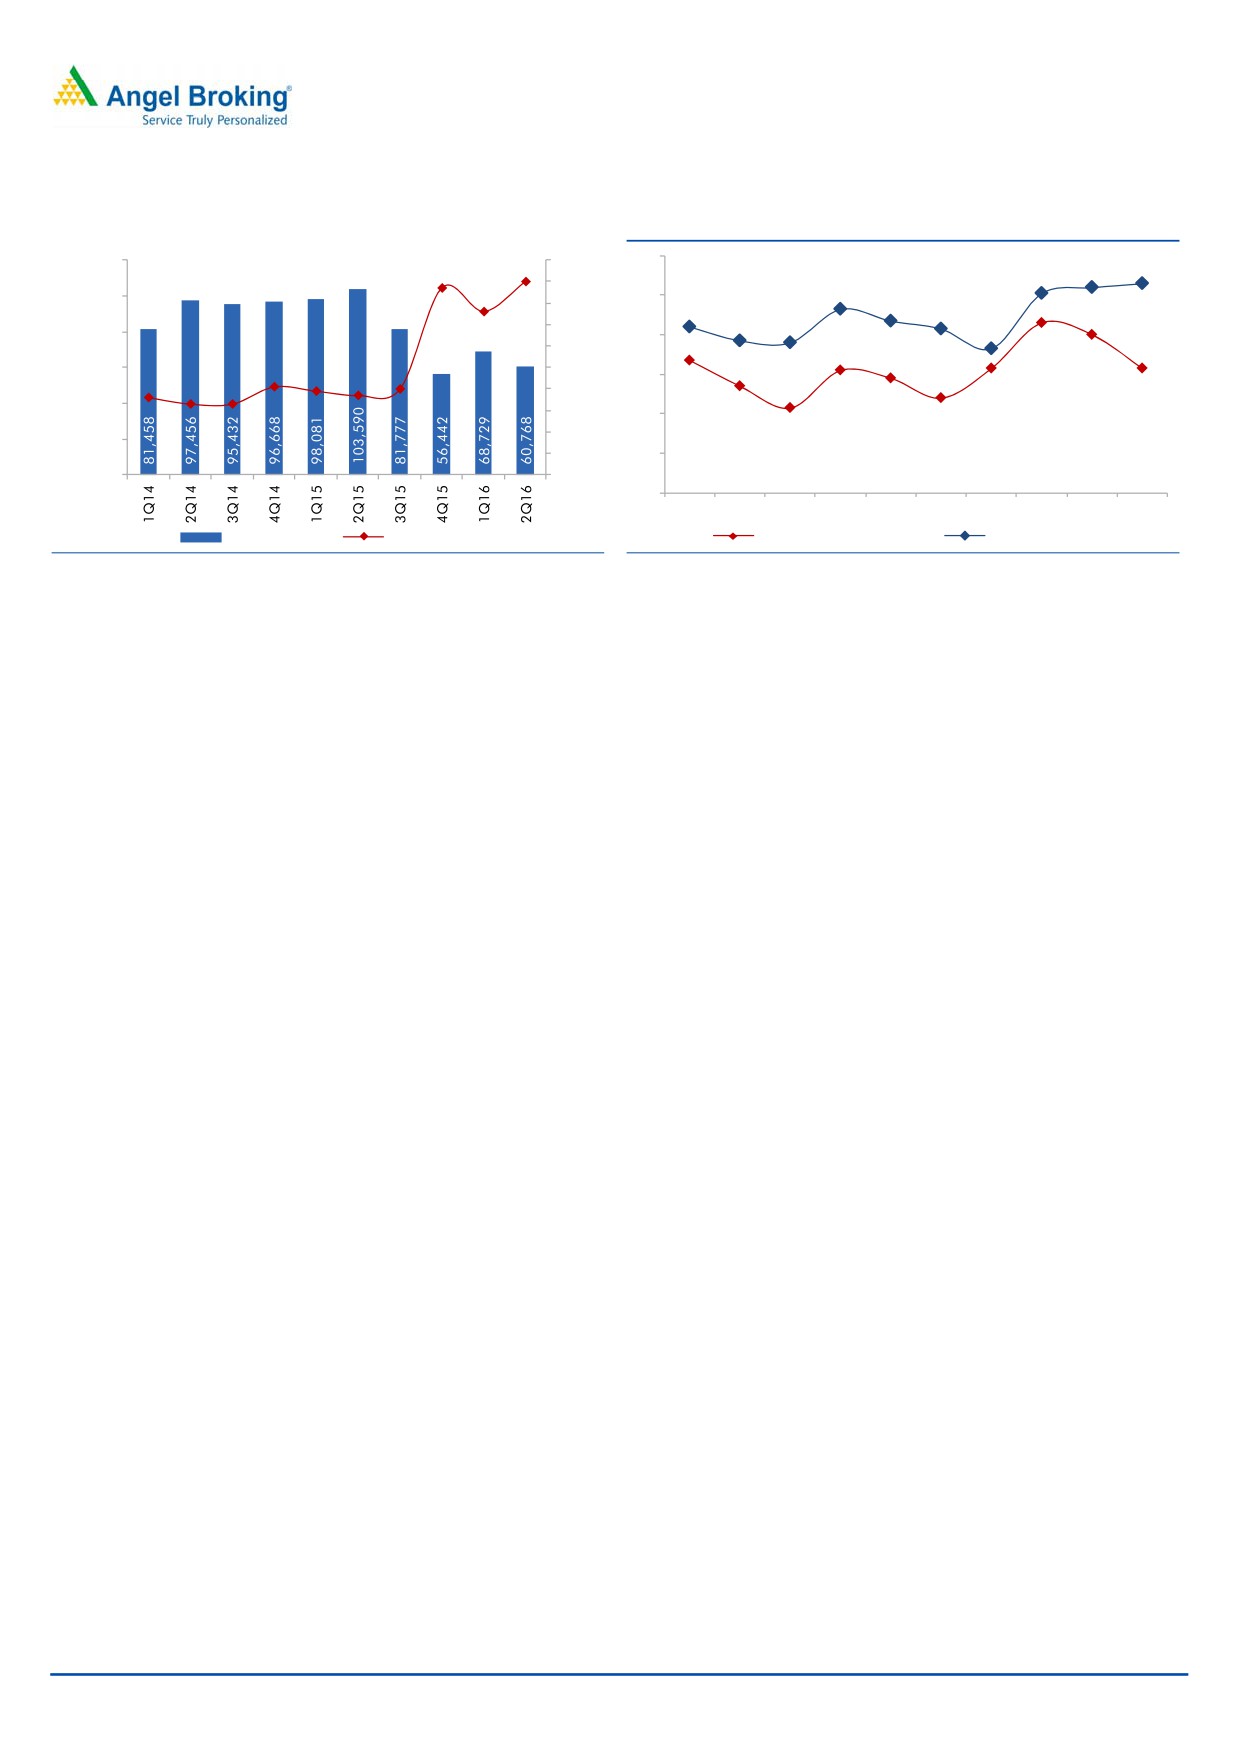
Refining margins well ahead of expecations
The Refining segment posted a strong set of numbers with a GRM of $10.6/bbl for
the quarter as against $8.3/bbl in 2QFY2015. The GRM is ahead of consensus
estimates and the highest in seven years. The outperformance over the Singapore
GRM, by $4.3/bbl, is also the highest in six years. The same was led by product
mix flexibility, robust risk management, coupled with opportunistic crude sourcing
and lower energy costs incurred during the quarter.
October 21, 2015
2
Reliance Industries | 2QFY2016 Result Update
Exhibit 2: Refining Segment Revenues and EBIT Margin
Exhibit 3: RIL’s GRM vs Singapore GRM
120,000
10.0%
12
9.0%
100,000
10
8.0%
7.0%
80,000
8
6.0%
60,000
5.0%
6
4.0%
40,000
3.0%
4
2.0%
20,000
1.0%
2
0
0.0%
0
1Q14 2Q14 3Q14 4Q14 1Q15 2Q15 3Q15 4Q15 1Q16 2Q16
Segment Revenue
EBIT Margin (%)
Singapore GRM ($ / bbl)
RIL GRM ($ / bbl)
Source: Company, Angel Research
Source: Company, Angel Research
October 21, 2015
3
Reliance Industries | 2QFY2016 Result Update
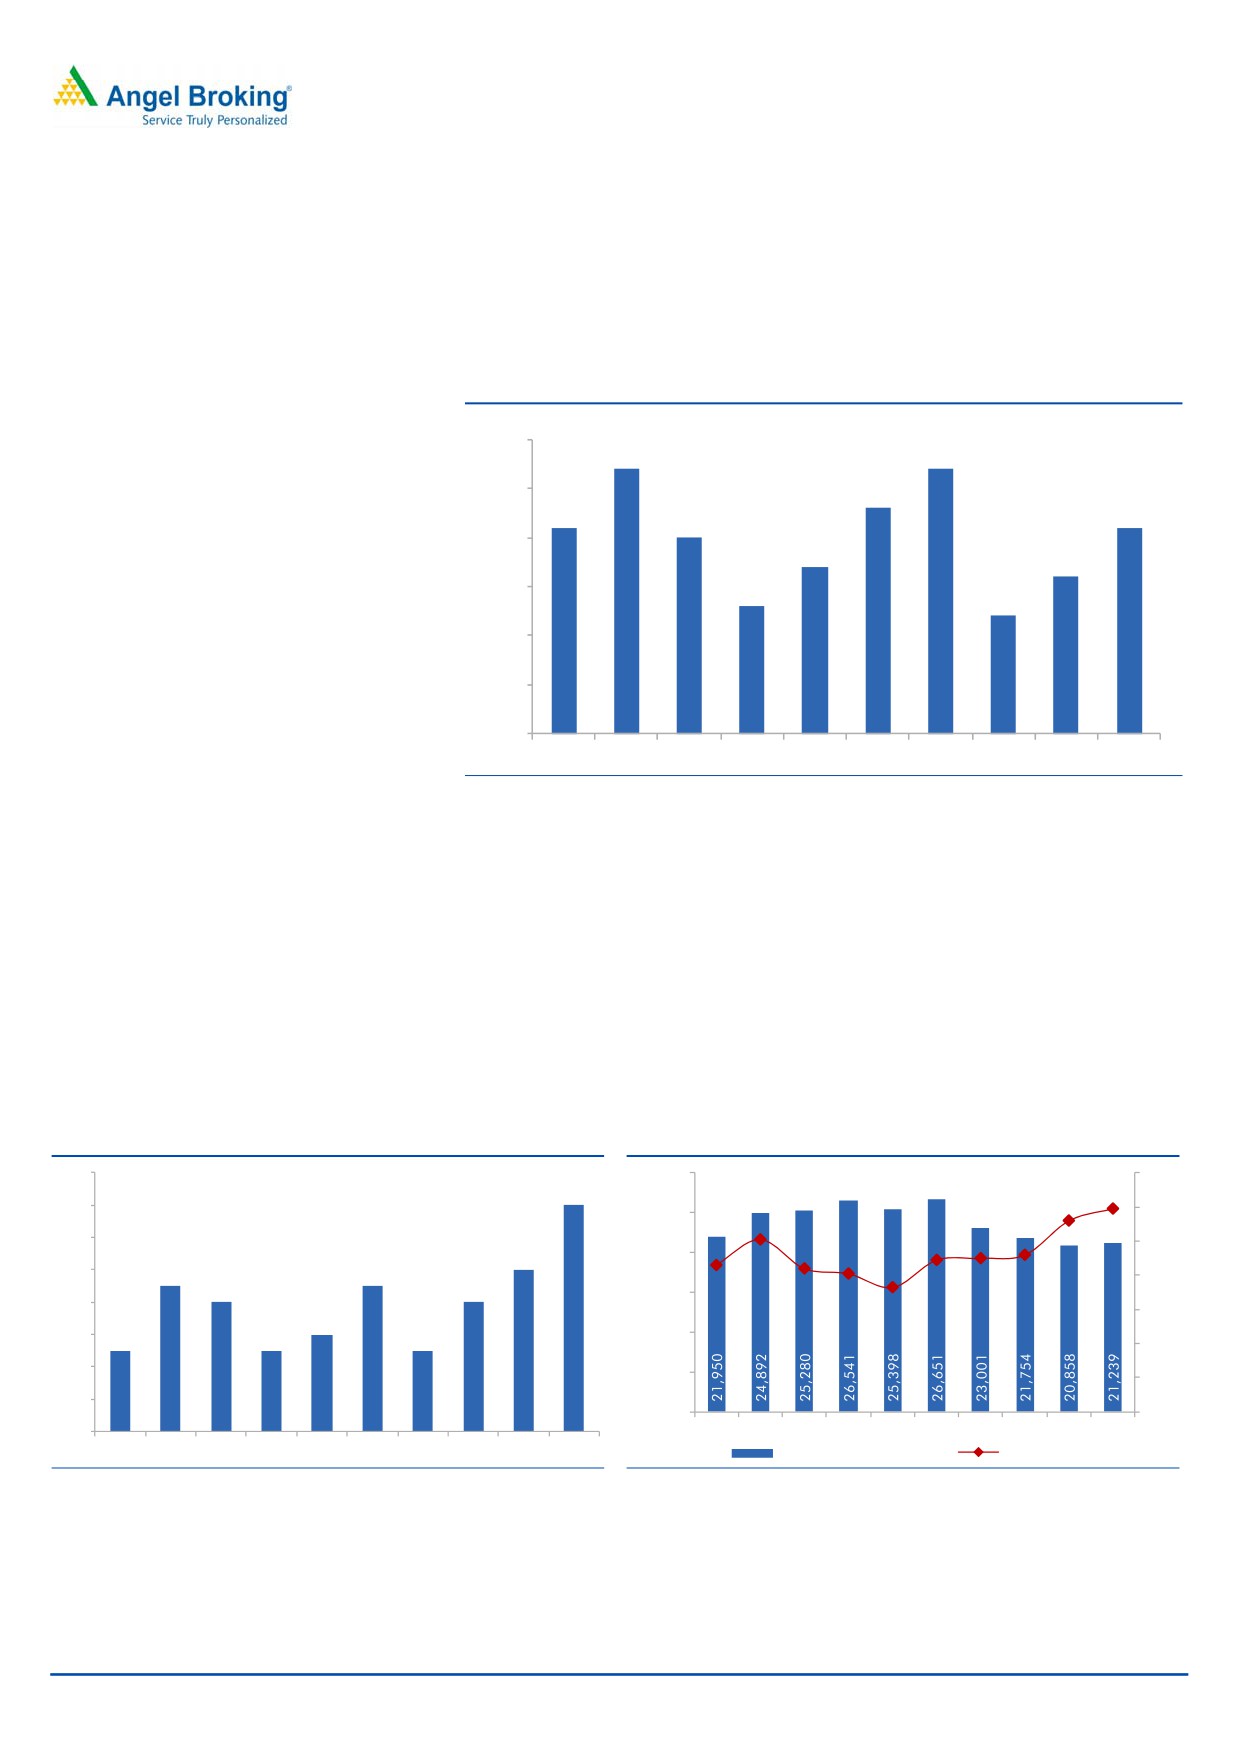
The Refining and Marketing segment’s revenue decreased by
41% yoy to
`60,768cr, led by a decline in crude prices. The EBIT however increased 42% yoy
to a record level of `5,461cr led by record GRM. Jamnagar refineries processed
17.1MMT of crude with an average utilization of 110%, as against 16.6MMT in the
sequential previous quarter.
Exhibit 4: Refining volumes
Crude Refined (MMT)
18.0
17.7
17.7
17.5
17.3
17.1
17.1
17
17.0
16.7
16.6
16.5
16.3
16.2
16.0
15.5
15.0
1Q14
2Q14
3Q14
4Q14
1Q15
2Q15
3Q15
4Q15
1Q16
2Q16
Source: Company, Angel Research
Petrochemicals business posts strong margin expansion
The Petrochemicals segment’s revenue declined by 20% yoy to `21,239cr, led by
lower crude and feedstock prices. The segment’s EBIT however increased 7.2% yoy
to `2,531cr, led by strong polymer deltas and healthy polyester chain deltas,
coupled with higher volumes. Despite lower product prices, the segment’s EBIT
margin improved by 300bp yoy to 11.9%. RIL is currently stabilizing operations at
its new 150KTA capacity SBR plant at Hazira; the plant is expected to make India
self-sufficient in meeting its entire SBR requirement domestically.
Exhibit 5: Strong increase in petchem production
Exhibit 6: Petchem EBIT margin rises 300bp
6.4
30,000
14%
Petchem Production (MMT)
6.2
12%
25,000
6
10%
20,000
5.8
8%
15,000
5.6
6%
5.4
10,000
4%
5.2
5,000
2%
5
0
0%
4.8
1Q14 2Q14 3Q14 4Q14 1Q15 2Q15 3Q15 4Q15 4Q15 2Q16
1Q14 2Q14 3Q14 4Q14 1Q15 2Q15 3Q15 4Q15 4Q15 2Q16
Petchem Segment Revenue
EBIT Margin (%)
Source: Company, Angel Research
Source: Company, Angel Research
October 21, 2015
4
Reliance Industries | 2QFY2016 Result Update
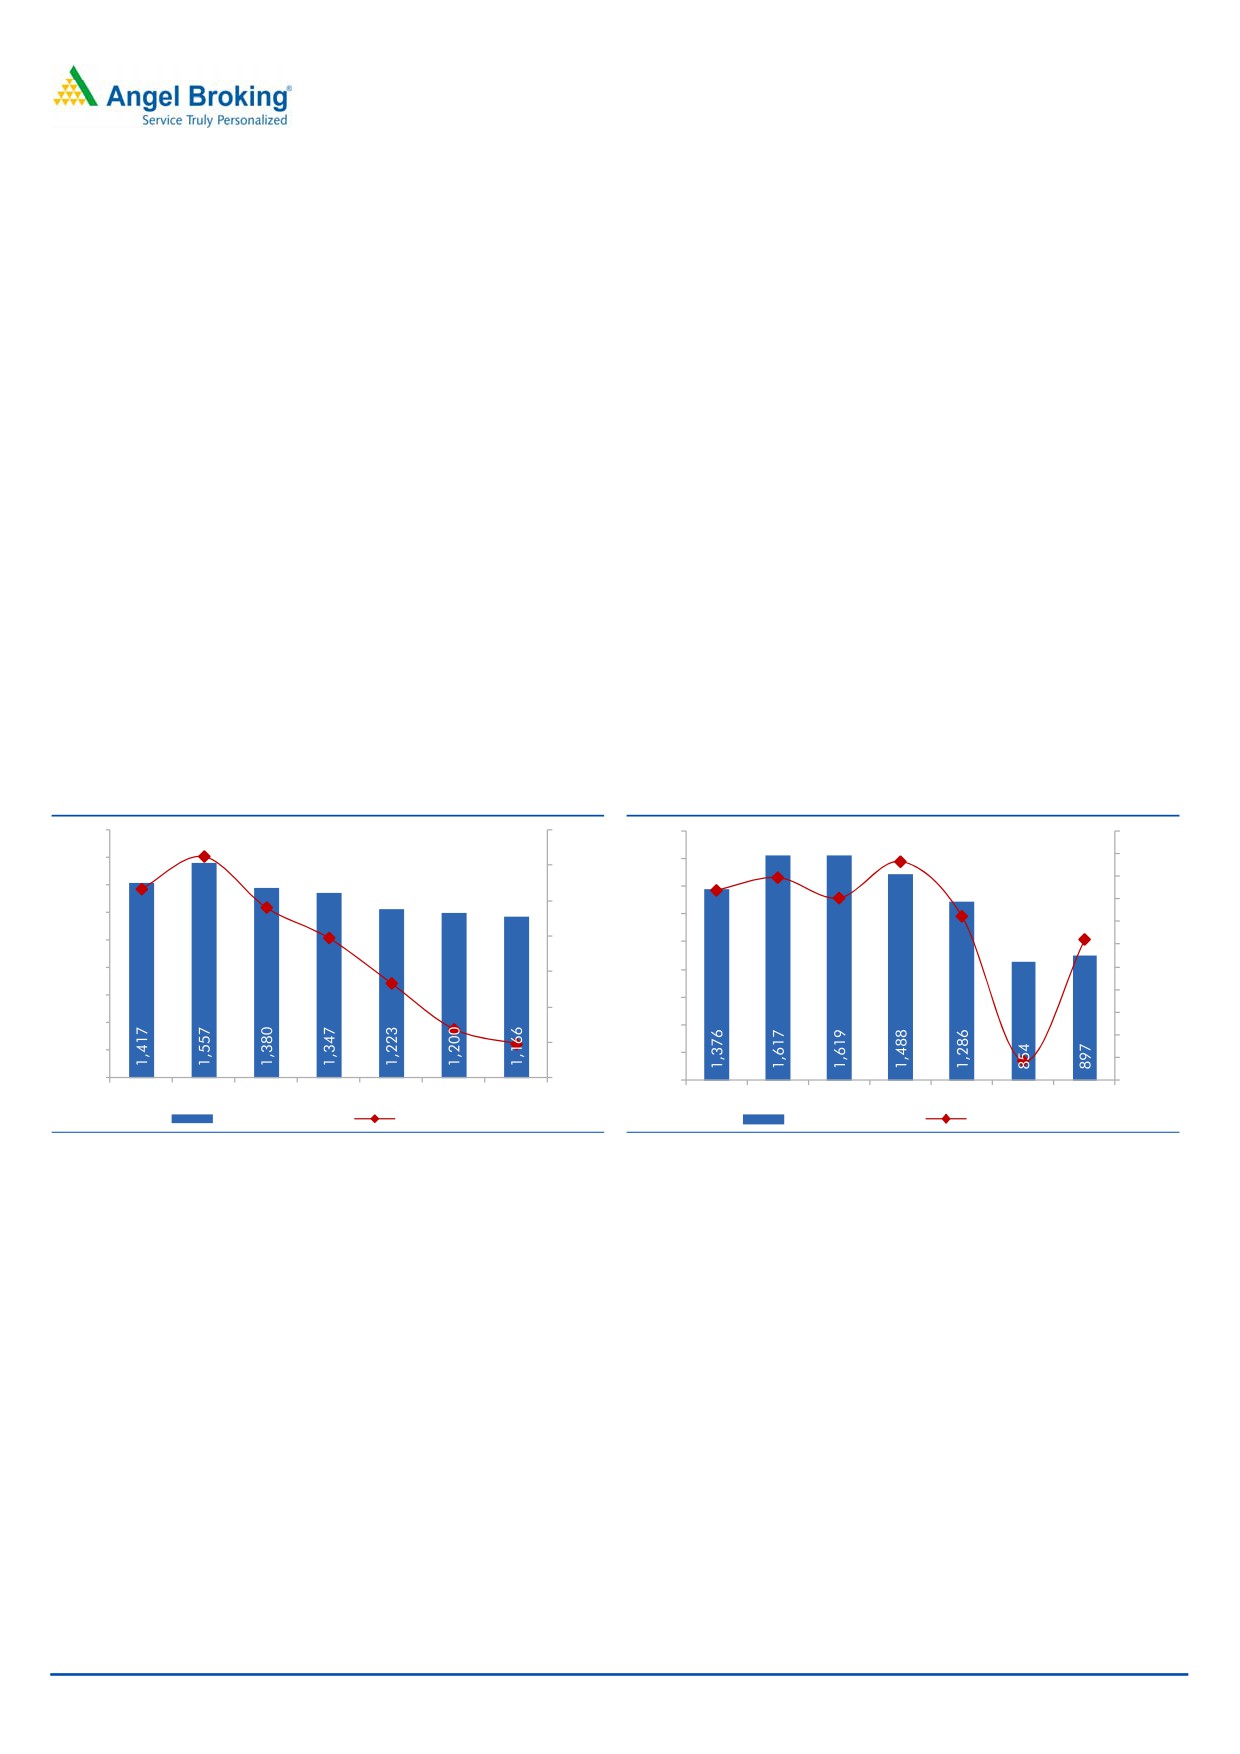
E&P segment outlook continues to remain bleak
On the domestic front, crude oil production at KG-D6 continues to decline; during
the quarter, it declined by 24% yoy to 0.39MMBBL, while natural gas production
declined by 9% yoy to 37BCF. Production at the Panna-Mukta fields increased with
crude oil production rising 7% to 1.88MMBBL, while natural gas production
increased by 5% to 17.2BCF. The Tapti fields produced 0.03MMBBL of condensate
and 0.6BCF of natural gas during the quarter, a yoy decline of 52% and 85%,
respectively. Fall in oil and gas production in the fields could mainly be attributed
to geological reasons.
The domestic Oil & Gas segment’s revenue declined 16% yoy to `1,166cr, led by
a decline in volumes. The segment’s EBIT margin declined significantly, ie to 4.8%
for the quarter as against 24.1% in 2QFY2015, led by decline in revenue.
On the US shale front, the macroeconomic environment remained quite
challenging. Higher supplies from the OPEC and a slowdown in China affected
crude prices and resulted in unit realizations declining by 51% yoy. Consequently,
even with modest growth in volumes, the revenue for the quarter declined 45% yoy
to `897cr. The segment’s EBIT margin declined to 21% during the quarter as
against 30.1% in 2QFY2015.
Exhibit 7: Domestic E&P revenues and EBIT Margin
Exhibit 8: US Shale revenues and EBIT Margin
1,800
35.0%
1,800
45.0%
40.0%
1,600
1,600
30.0%
35.0%
1,400
1,400
25.0%
30.0%
1,200
1,200
25.0%
1,000
20.0%
1,000
20.0%
800
15.0%
800
15.0%
10.0%
600
600
10.0%
5.0%
400
400
0.0%
5.0%
200
200
-5.0%
0
0.0%
0
-10.0%
4Q14
1Q15
2Q15
3Q15
4Q15
4Q15
2Q16
4Q14
1Q15
2Q15
3Q15
4Q15
4Q15
2Q16
Segment Revenue
EBIT Margin (%)
Segment Revenue
EBIT Margin (%)
Source: Company, Angel Research
Source: Company, Angel Research
Store expansion continues to drive Retail segment revenues
The Retail segment added 110 stores during the quarter, leading to a
22%
increase in revenue at `4,167cr. The store count reached 2,857 with 1,379 of
these being Reliance Digital stores. The segment’s EBIT remained stable at 2.3% as
against 2.4% in 2QFY2015.
RIL is building up an ecosystem for distribution of Jio devices; the company is
gearing up for its roll out, which would be in a phased manner. Reliance Retail will
soon be launching its own brand of 4G LTE smartphones under the brand ‘LYF’.
The company has made investments of ~`95,000cr in the Telecom business.
Reliance Jio is the first telecom operator to hold a pan-India Unified License and
holds the highest amount of liberalised spectrum among telecom operators,
totaling to 751.1MHz. The company plans to provide seamless 4G services using
LTE in 800MHz, 1800MHz and 2300MHz bands through an integrated ecosystem.
We believe the Retail and Telecom businesses would be the key drivers for growth
for the company in the coming years.
October 21, 2015
5
Reliance Industries | 2QFY2016 Result Update
Investment arguments
Growth in core business profits to remain strong
We expect RIL’s core Refining and Petrochemicals business to continue to
outperform, led by its leadership in these segments. Refining margins are expected
to remain strong considering delays in other upcoming refinery projects, which
should limit supplies in the market. Also, new capacity additions are expected to
drive revenues and EBIT of the Petrochemicals business. While the E&P business
would continue to remain a drag, we believe the Refining and Petrochemicals
businesses would more than offset the declines.
Strong investments in Jio and Retail business to drive growth
RIL is nearing the end of its massive capex programme of ~`200,000cr, the full
benefit of which should start showing up from the next fiscal. The company has
made huge investments in Jio (~`95,000cr so far with another ~`5,000cr to be
invested by the time of launch of services), while it continues to invest in the Retail
business. RIL plans to expand its store presence from 200 locations to over 900
cities and towns. Apart from these, the company has spent ~80% of the capex for
its four key projects (petcoke gasification plant at its refinery, refinery off-gas
cracker in petrochemicals, polyester/aromatics capacity expansion and import of
ethane from US). We expect these investments to drive EBITDA for the company
over the coming years.
October 21, 2015
6
Reliance Industries | 2QFY2016 Result Update
Outlook and valuation
We believe RIL’s growth in the coming years to be driven by its core Refining and
Petrochemicals business. We value the Refining business at 7x EBITDA, while we
assign a 6.5x multiple to the Petrochemicals business. We value the telecom
business at 0.3x invested capital, while retail is valued at 1x sales. We retain our
Accumulate rating on the stock with a target price of `1,050, implying a 10%
upside from current levels.
Exhibit 9: RIL - SOTP Valuation
Business
Value (` Cr)
` per share
Methodology
Refining Segment
1,70,736
580
EV/EBITDA (7x)
Petrochemicals
1,35,325
459
EV/EBITDA (6.5x)
KG D6
12,014
41
DCF
PMT
5,396
18
EV/EBITDA (4x)
Shale
8,273
28
EV/EBITDA (3x)
Retail
21,189
72
1x Sales
Telecom
30,000
102
0.3x investments
Net Debt
(73,510)
(250)
Target Value
3,09,424
1,050
Source: Company, Angel Research
Company background
Reliance Industries Ltd is a Fortune Global 500 company and the largest private
sector company in India with interests in the energy and materials value chain.
Over the years the company has successfully integrated backwards in the energy
chain and has attained leadership in most areas. The company operates one of
the largest refining capacities of 1.24mmbbl/day and has one of the most complex
refineries in the world. The company is now foraying into newer businesses such as
organized retail and broadband services.
October 21, 2015
7
Reliance Industries | 2QFY2016 Result Update
Profit & Loss Statement (Standalone)
Y/E March (` cr)
FY2013
FY2014
FY2015
FY2016E FY2017E
Net Sales
3,60,297
3,90,117
3,29,076
3,04,775
3,44,392
Other operating income
0
0
0
0
0
Total operating income
3,60,297
3,90,117
3,29,076
3,04,775
3,44,392
% chg
9.2
8.3
(15.6)
(7.4)
13.0
Total Expenditure
3,29,510
3,59,240
2,97,474
2,66,250
2,98,286
Raw Material cost
3,03,312
3,30,249
2,65,075
2,28,623
2,41,235
Employee Costs
3,354
3,370
3,686
4,928
5,416
Other Expenses
22,844
25,621
28,713
21,01,219
35,86,895
EBITDA
30,787
30,877
31,602
38,524
46,106
% chg
(8.4)
0.3
2.3
21.9
19.7
(% of Net Sales)
8.5
7.9
9.6
12.6
13.4
Depreciation& Amortisation
9,465
8,789
8,488
8,922
12,009
EBIT
21,322
22,088
23,114
29,602
34,097
% chg
(4.1)
3.6
4.6
28.1
15.2
(% of Net Sales)
5.9
5.7
7.0
9.7
9.9
Interest & other Charges
3,036
3,206
2,367
2,746
3,155
Other Income
7,998
8,936
8,721
8,167
9,028
Profit before tax
26,284
27,818
29,468
35,023
39,969
% chg
2.1
5.8
5.9
18.9
14.1
Tax Expense
5,281
5,834
6,749
8,141
9,742
(% of PBT)
20.1
21.0
22.9
23.2
24.4
Recurring PAT
21,003
21,984
22,719
26,883
30,227
Adjusted PAT
19,716
20,173
20,397
26,883
30,227
% chg
4.8
2.3
1.1
31.8
12.4
(% of Net Sales)
5.5
5.2
6.2
8.8
8.8
October 21, 2015
8
Reliance Industries | 2QFY2016 Result Update
Balance Sheet (Standalone)
Y/E March (` cr)
FY2013
FY2014
FY2015
FY2016E FY2017E
SOURCES OF FUNDS
Equity Share Capital
3,229
3,232
3,236
3,236
3,236
Reserves & Surplus
1,76,791
1,93,859
2,12,940
2,36,099
2,61,432
Shareholders Funds
1,80,020
1,97,091
2,16,176
2,39,335
2,64,668
Total Loans
72,427
89,968
97,620
1,07,750
1,03,075
Deferred Tax Liability
12,293
12,376
12,956
13,109
14,474
Other Long term liabilities
0
0
1,404
0
0
Total Liabilities
2,64,740
2,99,435
3,28,156
3,60,194
3,82,217
APPLICATION OF FUNDS
Gross Block
2,13,154
2,22,565
2,36,062
2,50,210
3,31,775
Less: Acc. Depreciation
1,03,406
1,13,159
1,21,499
1,30,779
1,43,154
Net Block
1,09,748
1,09,406
1,14,563
1,19,432
1,88,622
Capital Work-in-Progress
19,116
41,716
75,753
92,250
33,000
Investments
52,509
86,062
1,12,573
1,15,989
1,19,114
Current Assets
1,15,610
1,01,963
65,637
96,376
1,09,798
Cash
49,547
36,624
11,571
16,239
25,044
Inventories
42,729
42,932
36,551
31,243
33,830
Debtor
11,880
10,664
4,661
6,468
7,363
Other
11,454
11,743
12,854
42,427
43,561
Current liabilities
53,871
68,309
69,908
63,853
68,317
Net Current Assets
61,739
33,654
(4,271)
32,523
41,481
Other Assets
21,628.0
28,597.0
29,538.0
-
-
Total Assets
2,64,740
2,99,435
3,28,156
3,60,194
3,82,217
October 21, 2015
9
Reliance Industries | 2QFY2016 Result Update
Cash flow statement (Standalone)
Y/E March (` cr)
FY2013
FY2014
FY2015
FY2016E FY2017E
Profit before tax
39,598
49,547
33,224
35,023
39,969
Depreciation
9,465
8,789
8,488
8,922
12,009
Change in Working Capital
5,782
14,515
8,315
(32,127)
(152)
Others
(17,185)
(24,626)
(8,660)
28,036
(1,261)
Direct taxes paid
(4,665)
(6,065)
(6,082)
(7,987)
(8,377)
Cash Flow from Operations
32,995
42,160
35,285
31,868
42,187
(Inc.)/ Dec. in Fixed Assets
(15,911)
(32,399)
(42,634)
(30,645)
(22,315)
(Inc.)/ Dec. in Investments
2,132
(31,232)
(23,403)
(3,416)
(3,125)
Others
(1,018)
(382)
10,039
0
0
Cash Flow from Investing
(14,797)
(64,013)
(55,998)
(34,061)
(25,440)
Issue of Equity
12
183
226
-
-
Inc./(Dec.) in loans
1,230
12,476
5,453
10,130
(4,675)
Dividend Paid (Incl. Tax)
(2,924)
(3,093)
(3,268)
(3,268)
(3,268)
Others
(6,567)
(4,036)
(3,351)
-
-
Cash Flow from Financing
(8,249)
5,530
(940)
6,862
(7,943)
Inc./(Dec.) in Cash
9,949
(16,323)
(21,653)
4,668
8,805
Opening Cash balances
39,598
49,547
33,224
11,571
16,239
Closing Cash balances
49,547
33,224
11,571
16,239
25,044
October 21, 2015
10
Reliance Industries | 2QFY2016 Result Update
Key ratios
Y/E March
FY2013
FY2014
FY2015
FY2016E
FY2017E
Per Share Data (`)
Reported EPS
71.5
74.8
77.2
91.3
102.6
Adjusted EPS
67.2
68.6
69.3
91.3
102.6
Cash EPS
103.8
104.7
106.0
121.5
143.4
DPS
9.0
9.5
10.0
10.0
10.0
Book Value
613.1
670.4
734.5
812.4
898.4
Valuation Ratio (x)
P/E (on FDEPS)
13.3
12.8
12.4
10.5
9.3
P/CEPS
9.2
9.1
9.0
7.9
6.7
P/BV
1.6
1.4
1.3
1.2
1.1
Dividend yield (%)
0.9
1.0
1.0
1.0
1.0
EV/Sales
0.8
0.9
1.1
1.2
1.0
EV/EBITDA
9.9
10.8
11.6
9.7
7.8
EV/Total Assets
1.1
1.1
1.1
1.0
0.9
Returns (%)
ROCE
8.8
8.2
7.7
9.0
9.5
ROE
12.1
11.7
11.0
11.8
12.0
Turnover ratios (x)
Asset Turnover (Gross Block)
1.7
1.8
1.4
1.3
1.2
Inventory (days)
39.9
40.1
44.1
40.6
34.5
Receivables (days)
15.3
10.5
8.5
6.7
7.3
Payables (days)
51.8
57.2
76.7
80.1
70.0
WC cycle (ex-cash) (days)
14.9
4.3
(10.4)
0.3
17.3
Solvency ratios (x)
Net debt to equity
0.1
0.3
0.4
0.4
0.3
Net debt to EBITDA
0.3
0.6
0.9
0.8
0.8
Interest Coverage (EBIT / Int.)
7.0
6.9
9.8
10.8
10.8
October 21, 2015
11
Reliance Industries | 2QFY2016 Result Update
Research Team Tel: 022 - 39357800
DISCLAIMER
Angel Broking Private Limited (hereinafter referred to as “Angel”) is a registered Member of National Stock Exchange of India Limited,
Bombay Stock Exchange Limited and Metropolitan Stock Exchange of India Limited. It is also registered as a Depository Participant with
CDSL and Portfolio Manager with SEBI. It also has registration with AMFI as a Mutual Fund Distributor. Angel Broking Private Limited is
a registered entity with SEBI for Research Analyst in terms of SEBI (Research Analyst) Regulations, 2014 vide registration number
INH000000164. Angel or its associates has not been debarred/ suspended by SEBI or any other regulatory authority for accessing
/dealing in securities Market. Angel or its associates including its relatives/analyst do not hold any financial interest/beneficial
ownership of more than 1% in the company covered by Analyst. Angel or its associates/analyst has not received any compensation /
managed or co-managed public offering of securities of the company covered by Analyst during the past twelve months. Angel/analyst
has not served as an officer, director or employee of company covered by Analyst and has not been engaged in market making activity
of the company covered by Analyst.
This document is solely for the personal information of the recipient, and must not be singularly used as the basis of any investment
decision. Nothing in this document should be construed as investment or financial advice. Each recipient of this document should
make such investigations as they deem necessary to arrive at an independent evaluation of an investment in the securities of the
companies referred to in this document (including the merits and risks involved), and should consult their own advisors to determine
the merits and risks of such an investment.
Reports based on technical and derivative analysis center on studying charts of a stock's price movement, outstanding positions and
trading volume, as opposed to focusing on a company's fundamentals and, as such, may not match with a report on a company's
fundamentals.
The information in this document has been printed on the basis of publicly available information, internal data and other reliable
sources believed to be true, but we do not represent that it is accurate or complete and it should not be relied on as such, as this
document is for general guidance only. Angel Broking Pvt. Limited or any of its affiliates/ group companies shall not be in any way
responsible for any loss or damage that may arise to any person from any inadvertent error in the information contained in this report.
Angel Broking Pvt. Limited has not independently verified all the information contained within this document. Accordingly, we cannot
testify, nor make any representation or warranty, express or implied, to the accuracy, contents or data contained within this document.
While Angel Broking Pvt. Limited endeavors to update on a reasonable basis the information discussed in this material, there may be
regulatory, compliance, or other reasons that prevent us from doing so.
This document is being supplied to you solely for your information, and its contents, information or data may not be reproduced,
redistributed or passed on, directly or indirectly.
Neither Angel Broking Pvt. Limited, nor its directors, employees or affiliates shall be liable for any loss or damage that may arise from
or in connection with the use of this information.
Note: Please refer to the important ‘Stock Holding Disclosure' report on the Angel website (Research Section). Also, please refer to the
latest update on respective stocks for the disclosure status in respect of those stocks. Angel Broking Pvt. Limited and its affiliates may
have investment positions in the stocks recommended in this report.
Disclosure of Interest Statement
Reliance Industries
1. Analyst ownership of the stock
No
2. Angel and its Group companies ownership of the stock
No
3. Angel and its Group companies' Directors ownership of the stock
No
4. Broking relationship with company covered
No
Note: We have not considered any Exposure below ` 1 lakh for Angel, its Group companies and Directors
Ratings (Based on expected returns
Buy (> 15%)
Accumulate (5% to 15%)
Neutral (-5 to 5%)
over 12 months investment period):
Reduce (-5% to -15%)
Sell (< -15)
October 21, 2015
12