Initiating Coverage | Auto Ancillary
June 16, 2015
Rane Brake Lining
BUY
CMP
`282
No Brake to its Ascent
Target Price
`336
Rane Brake Lining (RBL) is engaged in the manufacture of safety critical friction
Investment Period
12 Months
material products viz brake linings, disc pads and brake shoes. It is the leader in
the automobile OEM (Passenger and commercial vehicle) segment with a 38%
Stock Info
share, while it has an 18% share in the aftermarket segment.
Sector
Auto Ancillary
Recovery in OEM segment coupled with aftermarket focus to drive growth
Market Cap (` cr)
223
Passenger vehicle and the MHCV OEM segment, which contribute about 47% to
Net Debt (` cr)
61
RBL’s revenues, are in an uptrend and slated to grow in double digits over the
Beta
1.3
next two years. Improved economic growth, further easing of interest rates, lower
fuel prices and low base during the recent slowdown period would lead to an
52 Week High / Low
387 / 212
OEM upcycle in FY2016/17. RBL, with its market leadership (38% market share)
Avg. Daily Volume
650
and well established client base, would reap benefits from an anticipated upsurge
Face Value (`)
10
in demand. Further, RBL’s strategy to enhance its distribution network in
BSE Sensex
26,587
underpenetrated Northern and Eastern markets and to introduce new products, is
Nifty
8,014
likely to boost its aftermarket revenues. We expect RBL’s aftermarket segment
(constituting 38% of sales) to grow at 14% CAGR over FY2015-2017. RBL is likely
Reuters Code
RABL.BO
to outpace the industry and further augment its share in the aftermarket segment
Bloomberg Code
RABL@IN
(current aftermarket share is 18%).
Operating leverage, raw material localization and energy savings to
Shareholding Pattern (%)
augment margins
Promoters
66.5
RBL would reap benefits of operating leverage given the double digit top-line
growth over the next two years. Also, it is working on enhancing the localization
MF / Banks / Indian Fls
10.9
levels. Imported raw material currently forms about 48% of the material costs and
FII / NRIs / OCBs
-
the company aims to realize 100-200bp cost reduction with increased domestic
Indian Public / Others
22.6
procurement. Further, RBL is also working towards reducing its energy costs by
implementing best practices across manufacturing plants and utilizing power from
low cost sources. We expect RBL’s margins to improve by 70bp over FY2016/17.
Abs. (%)
3m 1yr 3yr
Outlook and valuation: RBL’s revenues are estimated to grow at 12% CAGR over
Sensex
(6.7)
5.4
56.9
the next two years. Upsurge in OEM volumes coupled with focus on the
RBL
(12.5)
27.8
148.2
aftermarket segment would drive the top-line. Also, the company’s margins are
expected to improve on account of operating leverage, enhanced local
procurement and energy savings. Given the healthy top-line growth and margin
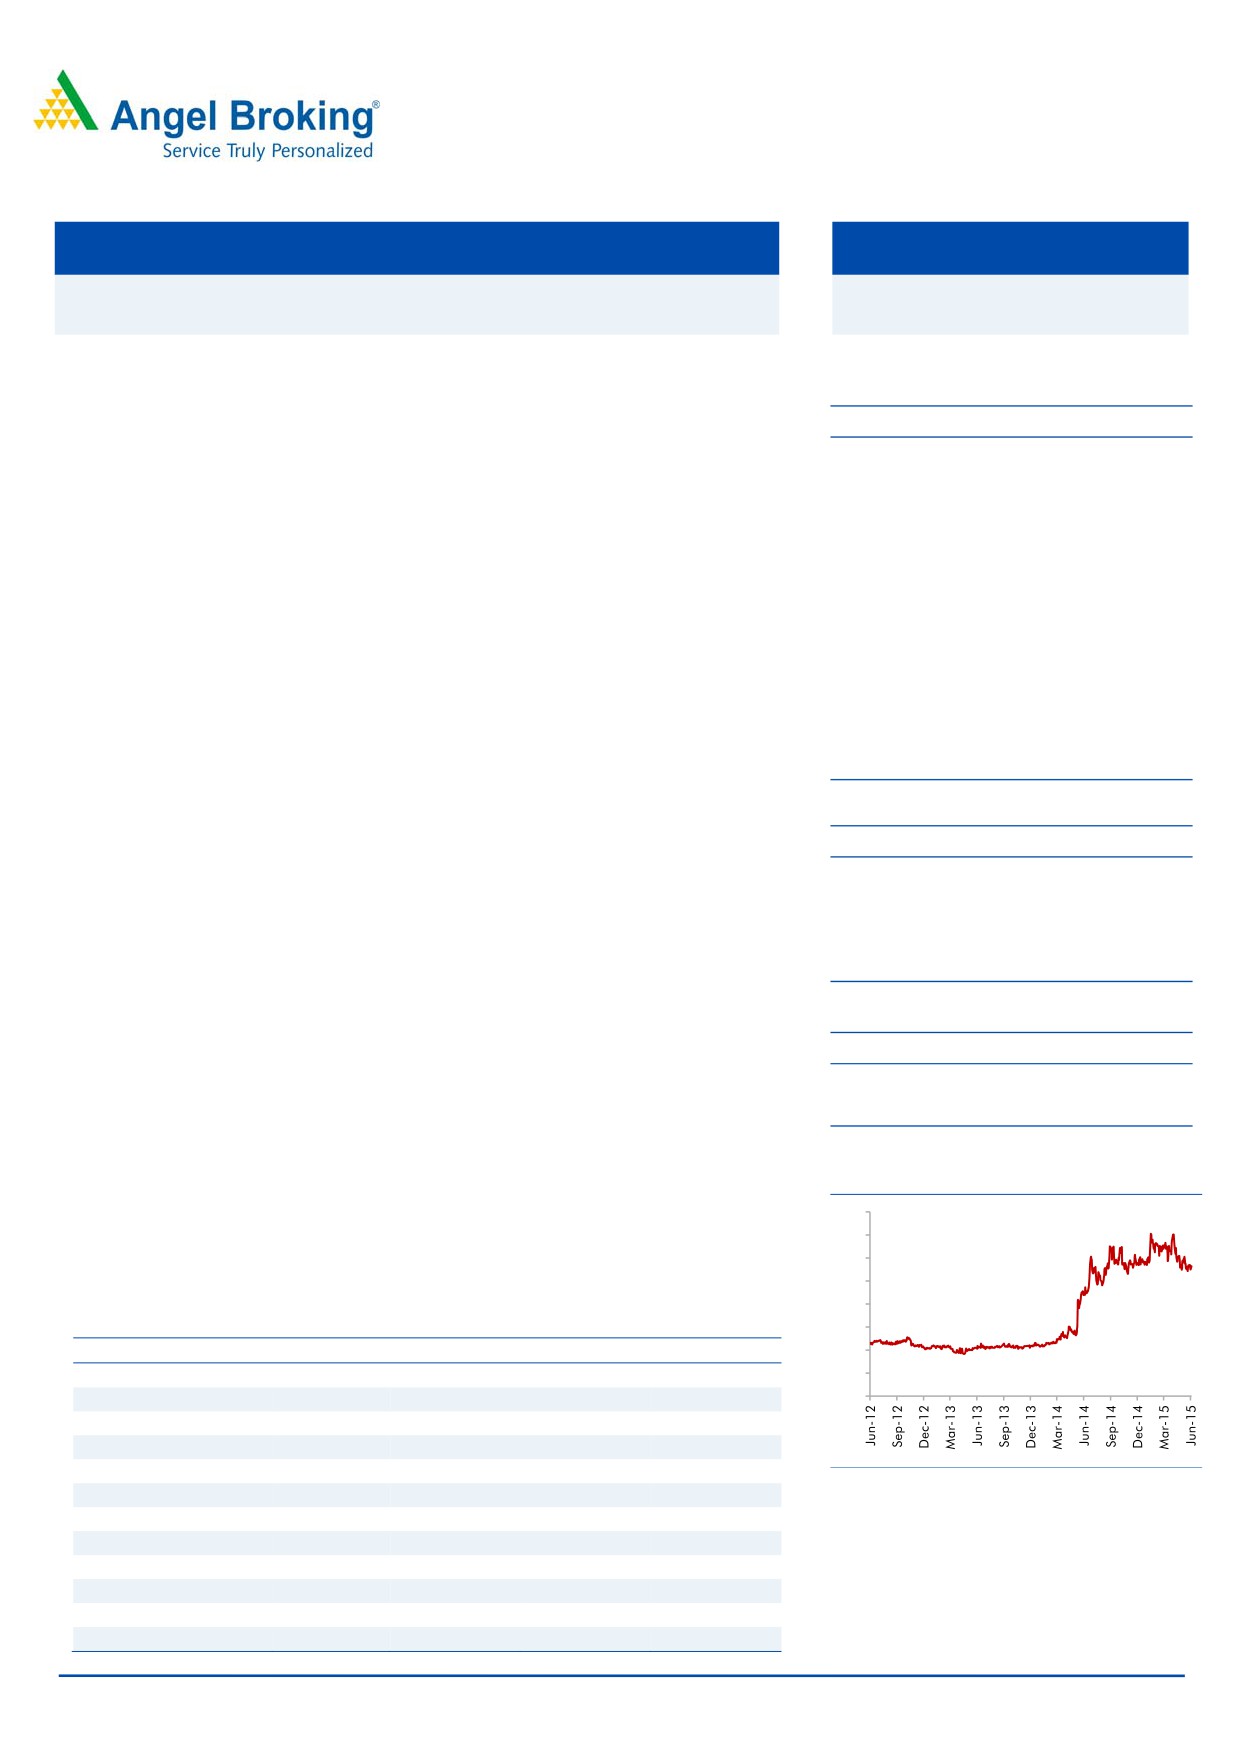
3-Year Daily price chart
improvement, RBL’s earnings are likely to grow at a CAGR of 17% over
400
FY2015-2017. Its return ratios are also estimated to expand due to margin
350
improvement and reduction in leverage. We initiate coverage on RBL with a Buy
300
250
recommendation and target price of `336 (based on 12x FY2017 earnings).
200
Key financials
150
Y/E March (` cr)
FY2014
FY2015
FY2016E
FY2017E
100
Net sales
384
416
460
520
50
% chg
2.0
8.4
10.5
13.0
0
Net profit (Adj.)
17
16
19
22
% chg
89.1
(6.4)
15.4
19.0
EBITDA margin (%)
10.5
10.9
11.3
11.6
Source: Company, Angel Research
EPS (`)
21.7
20.4
23.5
28.0
P/E (x)
13.0
13.9
12.0
10.1
P/BV (x)
2.0
1.8
1.7
1.5
RoE (%)
15.3
13.2
14.0
15.2
RoCE (%)
11.9
13.3
15.7
16.7
Bharat Gianani
EV/Sales (x)
0.8
0.7
0.6
0.6
022-39357800 Ext: 6817
EV/EBITDA (x)
7.5
6.3
5.4
4.9
Source: Company, Angel Research, Note: CMP as of June 15, 2015
Please refer to important disclosures at the end of this report
1
Rane Brake Lining | Initiating Coverage
Investment Arguments
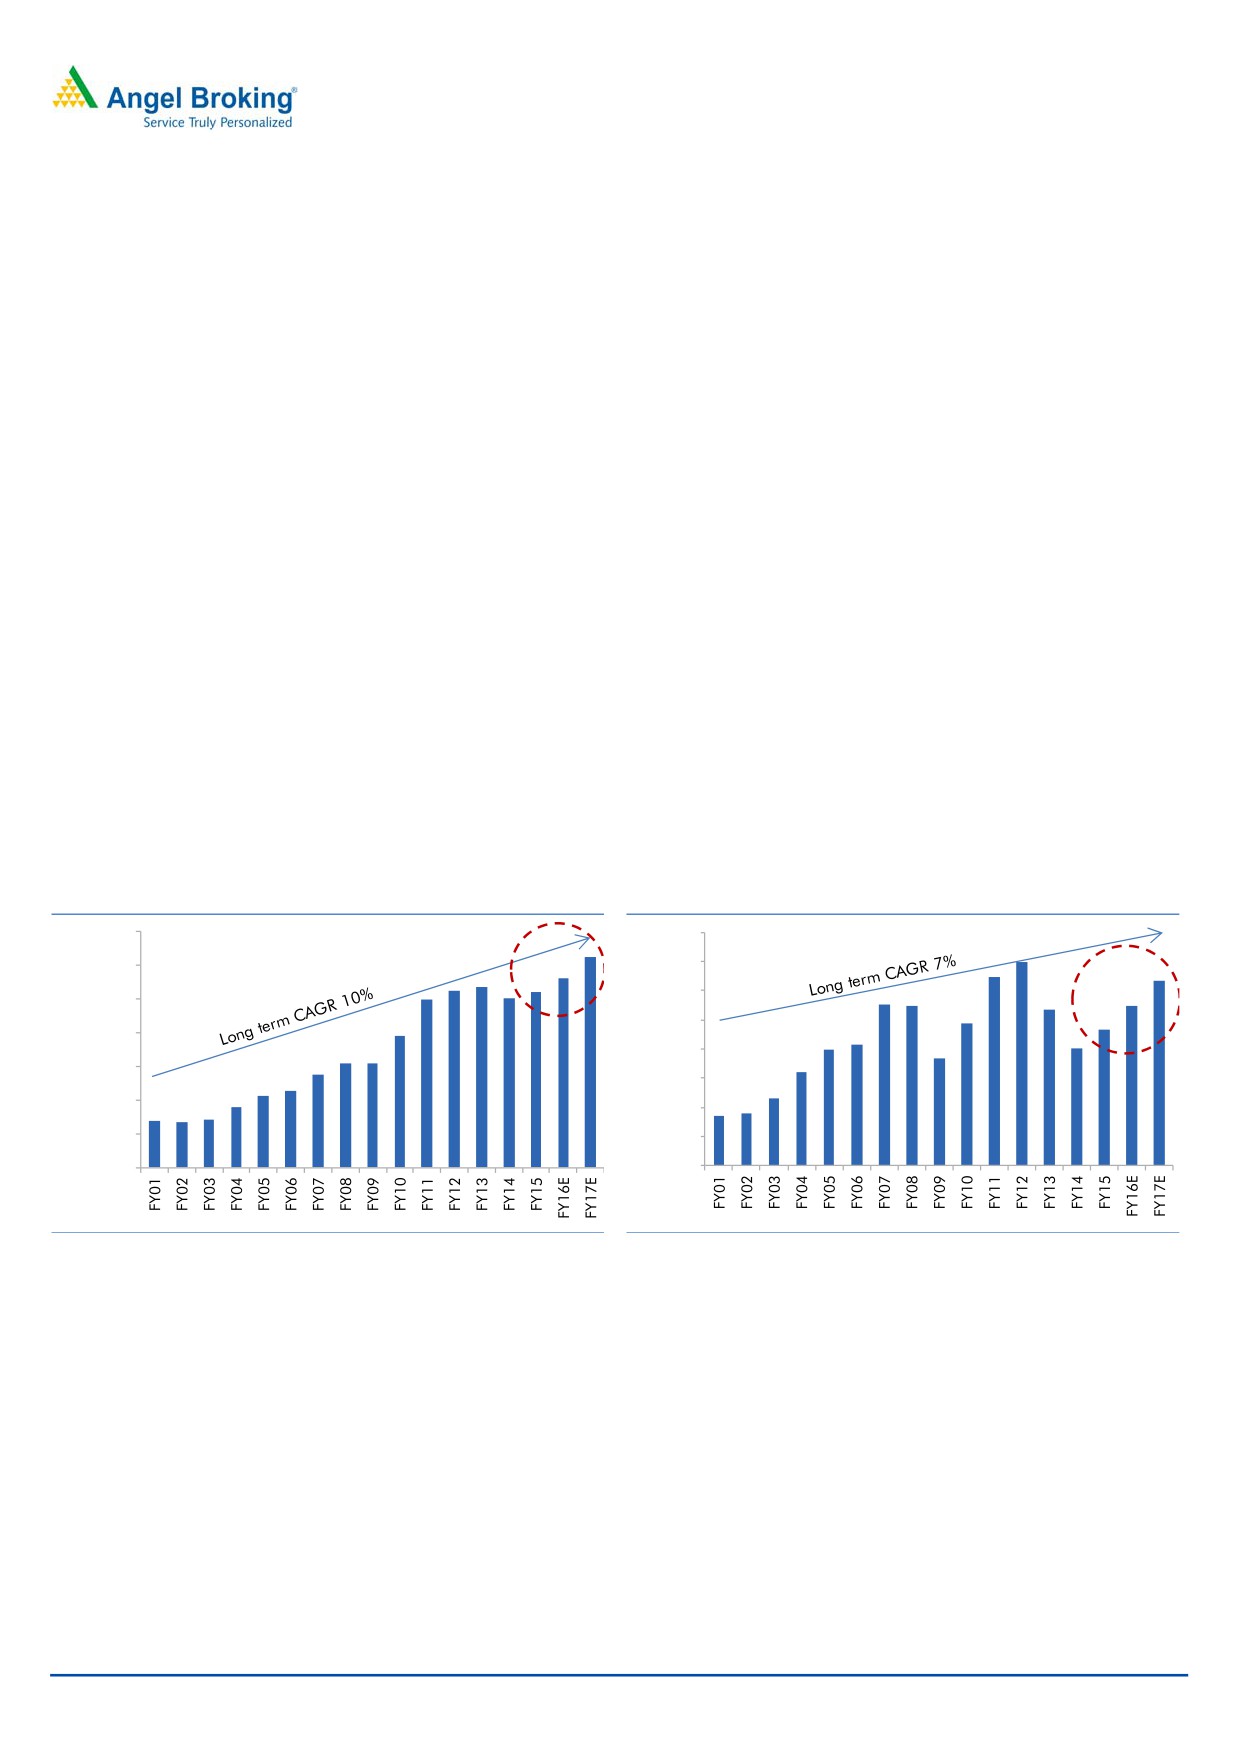
Passenger vehicle and HCV OEM to record double digit growth
The passenger and MHCV OEM industry is clearly in an upcycle in the medium
term. After three consecutive years of slowdown, the industry showed signs of
recovery in FY2015. The passenger vehicle segment grew 4% in FY2015, after
flattish volumes over the FY2012-FY2014 period. Similarly, the MHCV segment
surged 16% after two consecutive years of double digit decline. We expect the
industry growth to accelerate in FY2016/17. Favourable macro economic factors,
viz (a) higher economic growth leading to higher income levels, (b) easing of
interest rates which would reduce the operating cost and (c) lower fuel prices
which reduce the maintenance cost, are likely to boost OEM demand. Further, the
slowdown period has created a low base, thus paving way for healthy growth over
the medium term. The passenger vehicle and MHCV OEM segments are likely to
grow in double digits, ie we estimate a 9% and 16% CAGR respectively over
FY2015-2017 period,_in order to retract to long term CAGR trend of 10% and 7%
respectively.
We believe RBL with its leadership position (commanding 38% market share) and
well established client base is well poised to benefit from an uptrend in volumes. It
derives about 47% revenues from the OEM segment and would be the key
beneficiary of an OEM upcycle. We estimate RBL’S OEM segment revenues to grow
by 10% CAGR over the next two years.
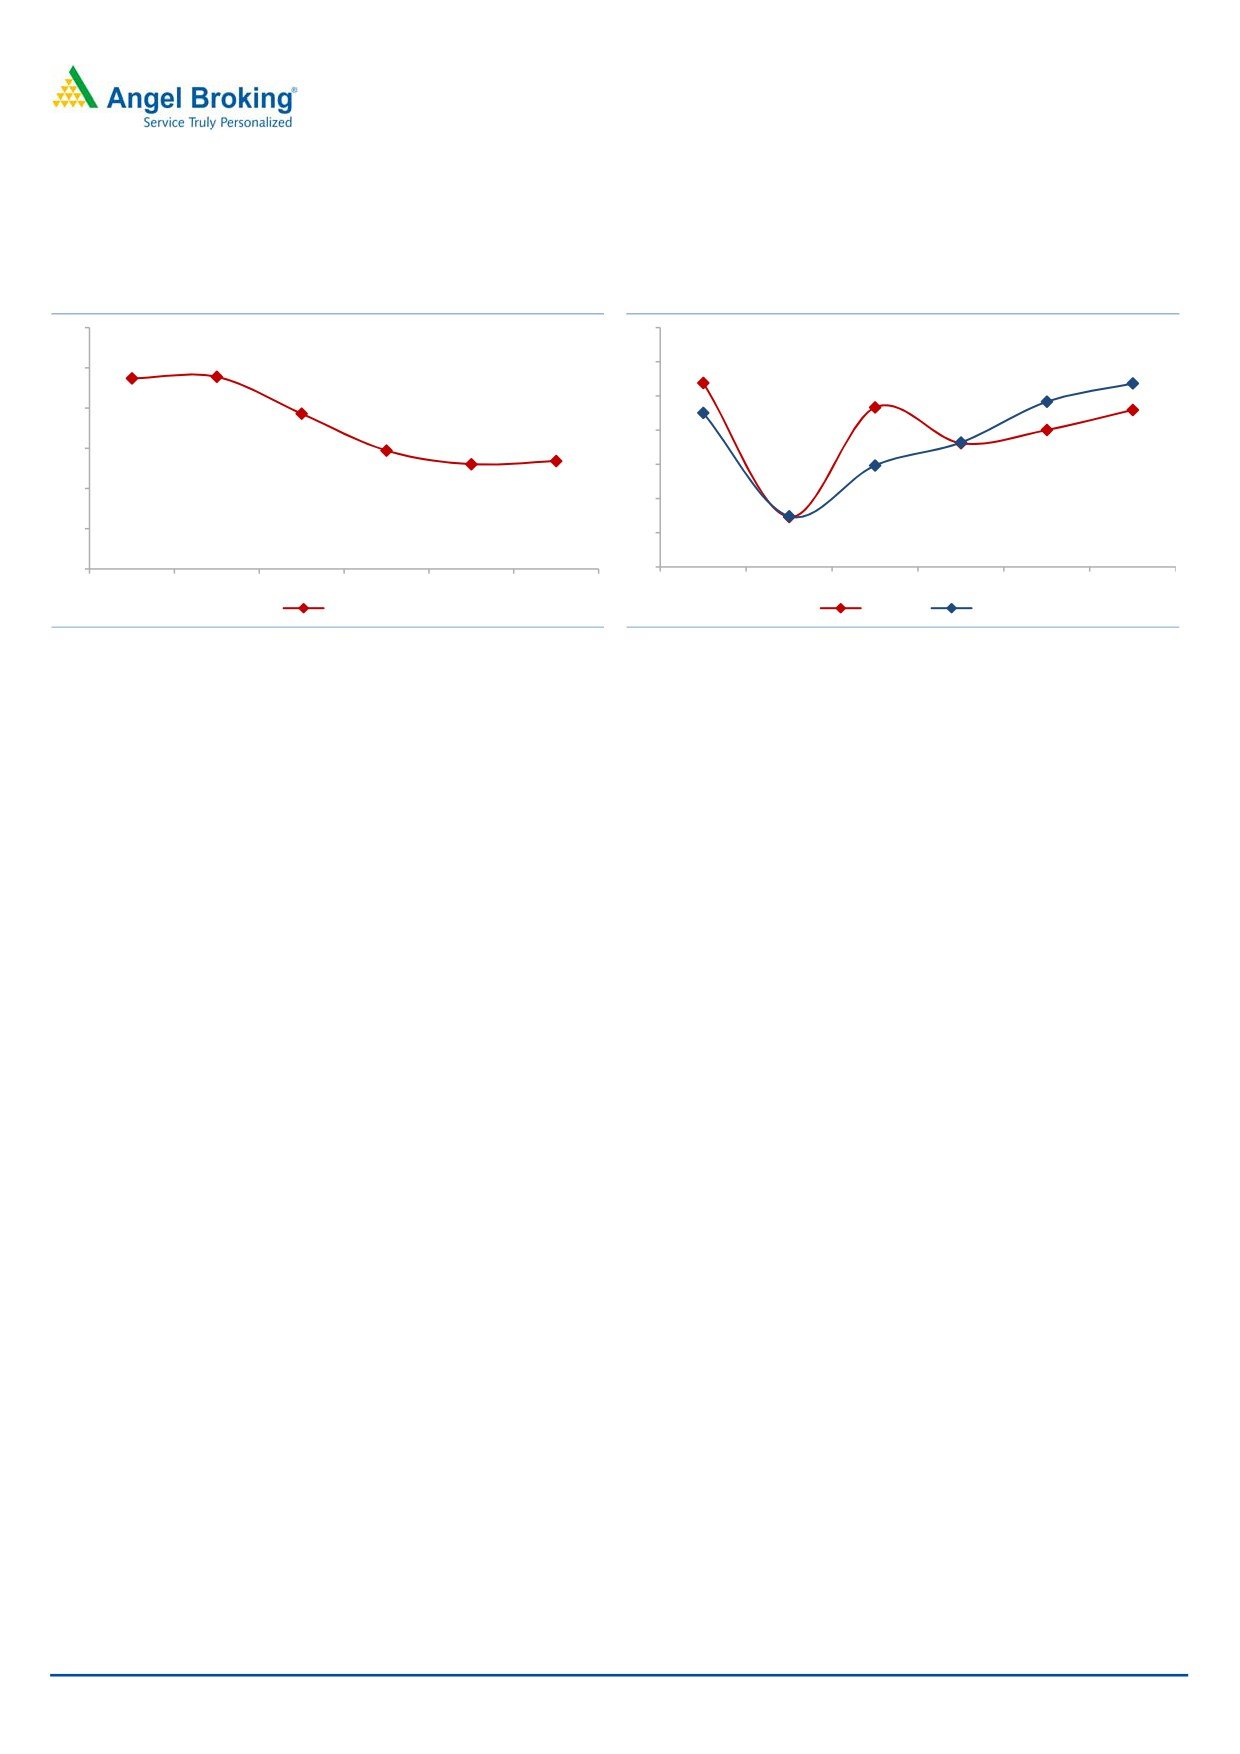
Exhibit 1: Passenger vehicle industry trend
Exhibit 2: MHCV industry trend
3,500,000
400,000
Implied
3,000,000
CAGR
350,000
Implied
9%
CAGR
300,000
2,500,000
16%
250,000
2,000,000
200,000
1,500,000
150,000
1,000,000
100,000
500,000
50,000
0
0
Source: SIAM, Angel Research
Source: SIAM, Angel Research
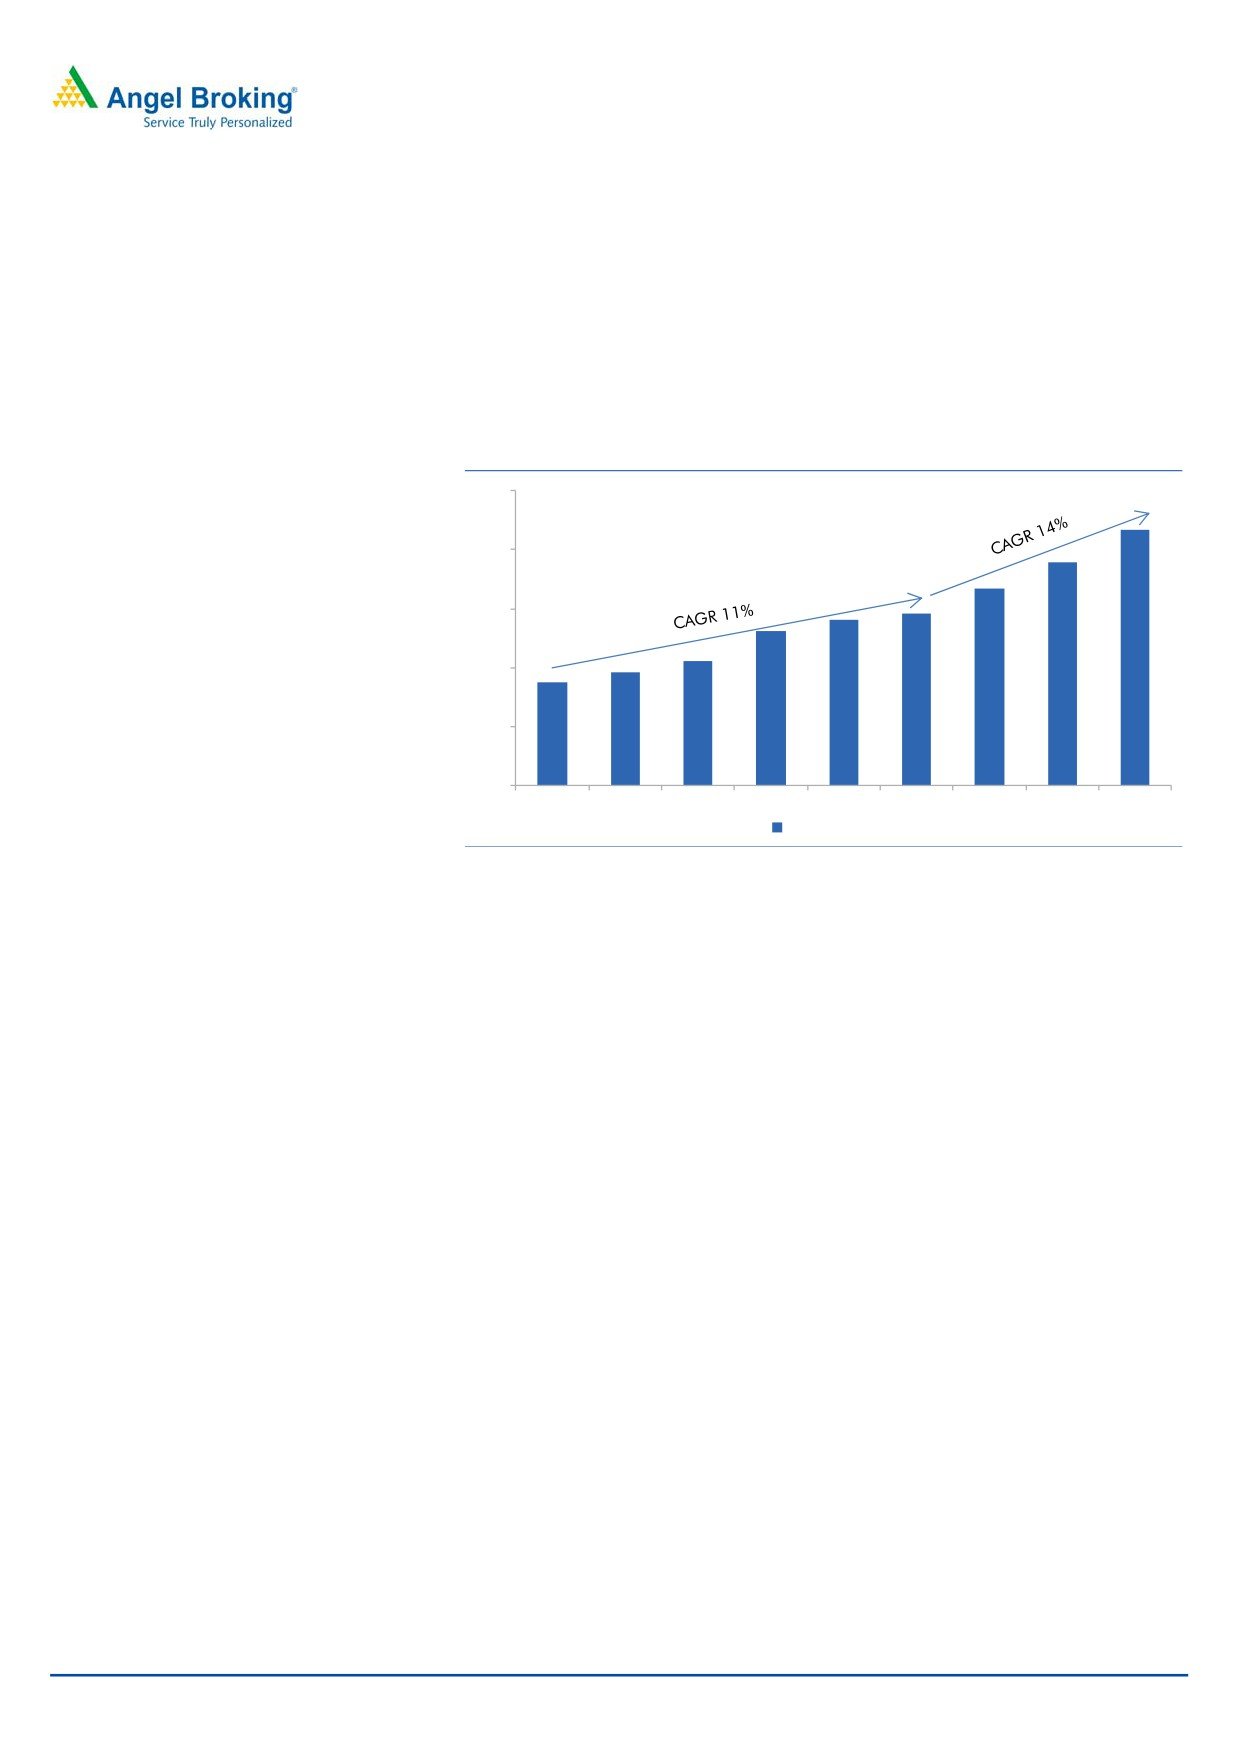
Expanding reach in Northern and Eastern markets and new
product introduction to drive aftermarket segment
RBL’s products have strong acceptance in the aftermarket segment in which it
commands 18% market share. In a move to further boost aftermarket revenues,
RBL is targeting to strengthen the distribution network in the Northern and the
Eastern markets where it has relatively lower dealer penetration. RBL is traditionally
strong in the Southern and Western regions which account for about 60-65% of
the company’s overall aftermarket revenues. With demand potential of Northern
and Eastern regions being almost similar to the Southern and Western regions, RBL
has immense growth potential. Apart from enhancing the dealer network, RBL is
also introducing new related products in the aftermarket space. It recently
introduced brake shoes, thereby enhancing product offerings. Further,
June 16, 2015
2
Rane Brake Lining | Initiating Coverage
improvement in the economy along with uptick in OEM volumes would bolster the
replacement demand going ahead.
As per the industry estimates, replacement market is almost double the size of the
OEM segment. With the dual strategy of enhancing distribution network and
introducing new products, RBL is likely to gain market share in the replacement
space. We expect RBL’s aftermarket division (constituting about 40% of revenues)
to grow at a CAGR of 14% over FY2015-17.
Exhibit 3: RBL after market growth trend
250
200
150
100
50
0
FY09
FY10
FY11
FY12
FY13
FY14
FY15
FY16E FY17E
Aftermarket (` cr)
Source: Company, Angel Research
Operating leverage, raw material localization and energy
savings to lead to margin improvement
RBL is poised to register double digit top-line growth (12% CAGR) over the next two
years. Uptick in the OEM segment coupled with healthy growth in the aftermarket
space would boost the top-line. The company is likely to draw benefits of operating
leverage on the back of healthy top-line growth. Also it’s working on reducing the
raw material costs by increasing the local content. It is planning to enhance
sourcing domestically and reduce dependence on imports (Imported raw material
currently contributes about 50% of the overall raw material costs). RBL aims to curb
the material costs by 100-200bp on back of increased localization. Further, it is
planning to reduce energy consumption by improving manufacturing processes
across its plants and utilizing power from low cost sources. Given the cost
reduction initiatives, we expect RBL’s margins to improve by 70bp over the next two
years.
RBL is also likely to realize the benefits of JPY weakening against INR given that the
imported raw material constitutes about half of the material costs and is largely
JPY denominated. Benefits of weak Yen would accrue from FY2016, given the
policy of hedging raw material costs for the next 6 months. (JPY had started to
depreciate from 2HFY2015).
June 16, 2015
3
Rane Brake Lining | Initiating Coverage
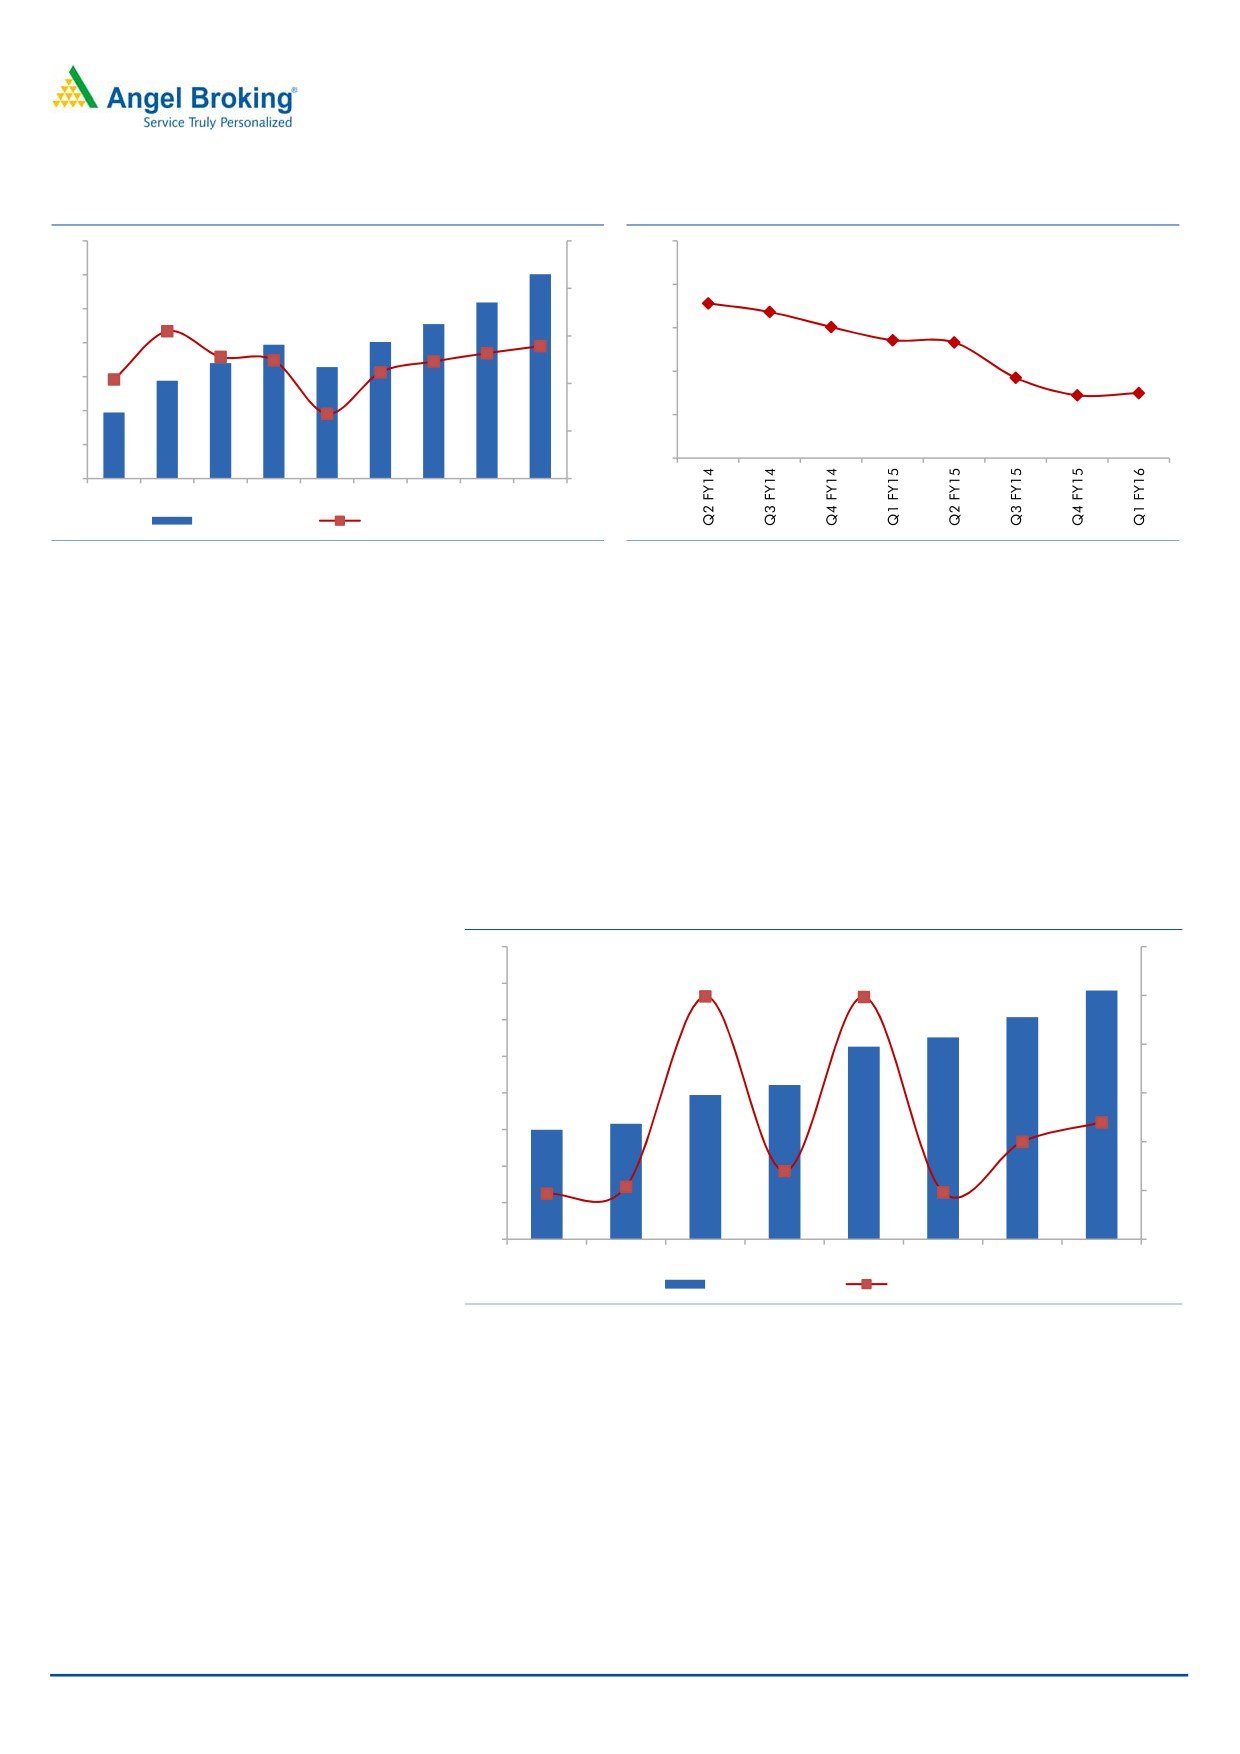
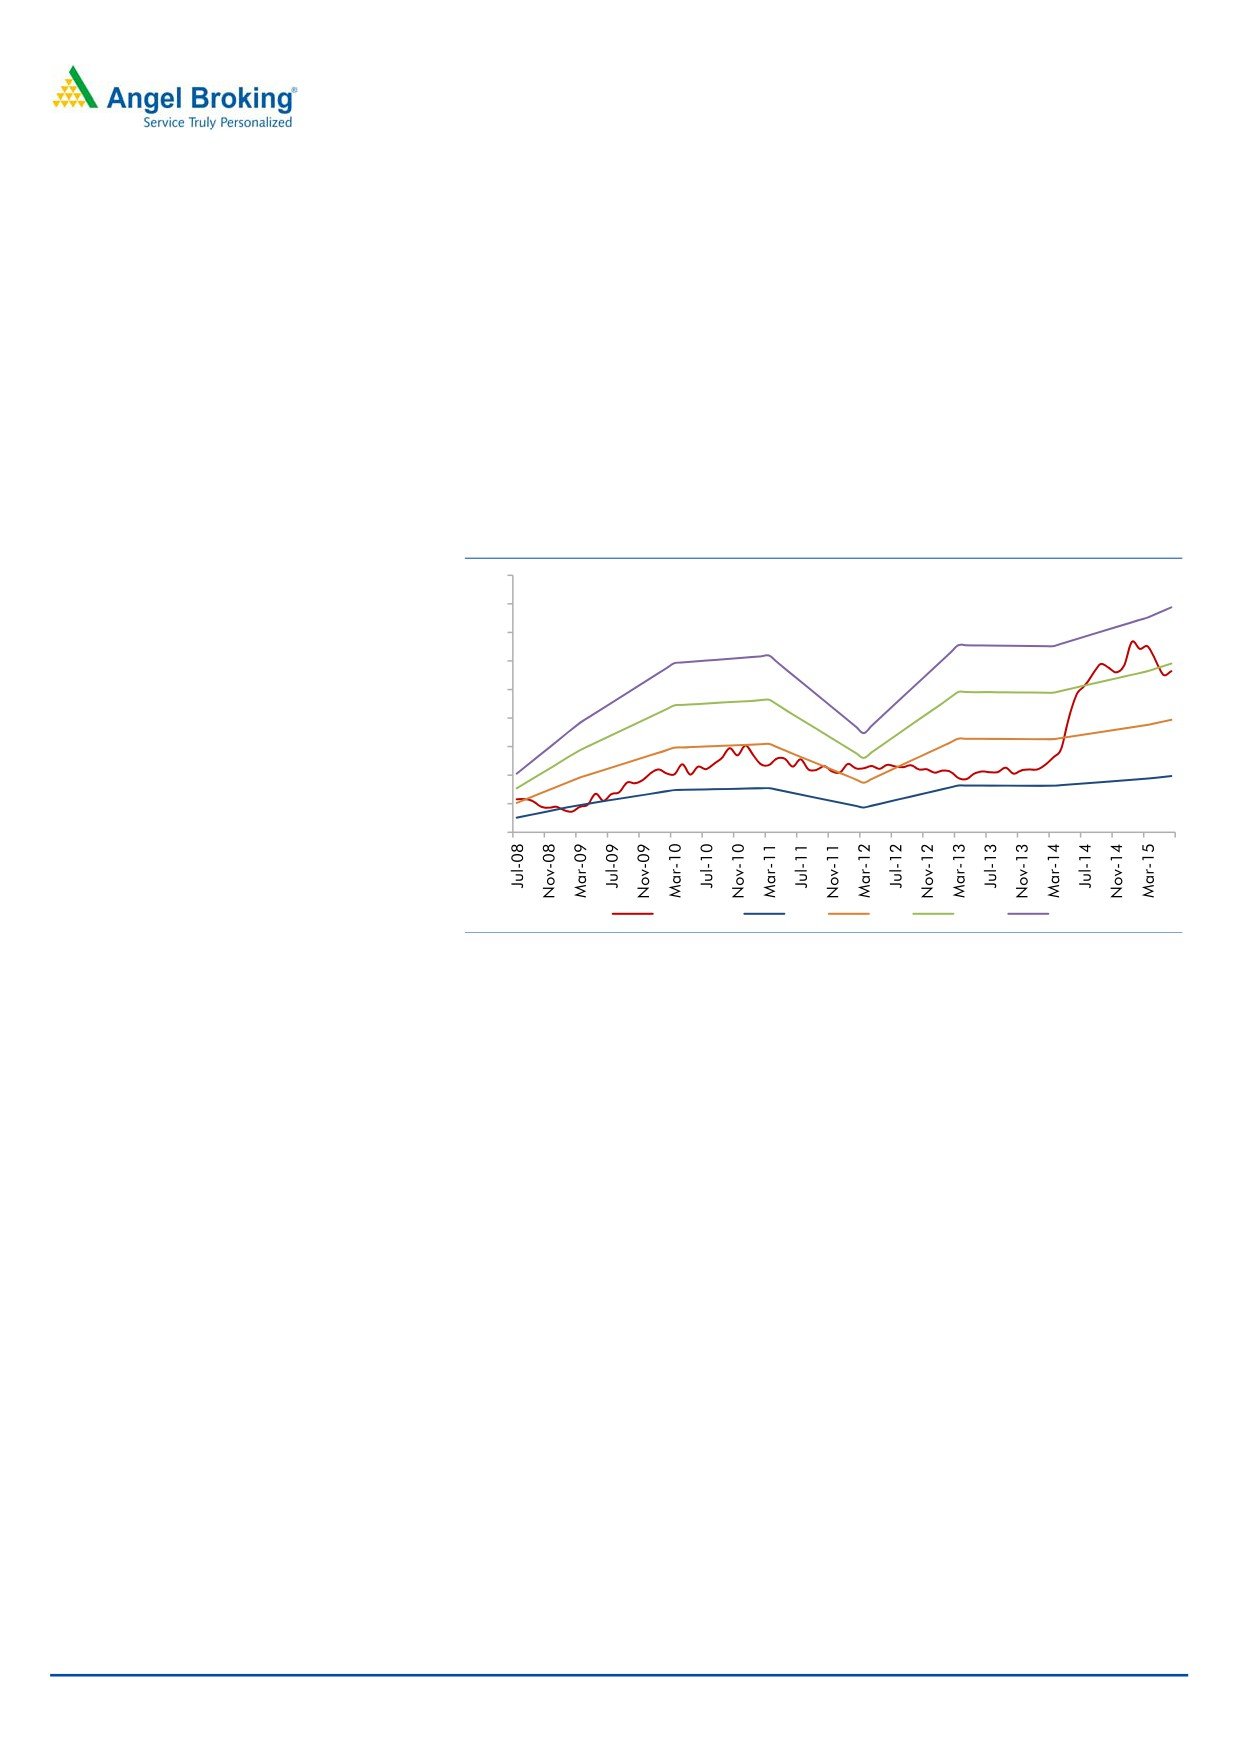
Exhibit 4: EBIDTA margin to improve
Exhibit 5: INR-JPY Trend
70
16
0.70
60
14
0.65
50
0.60
12
40
30
0.55
10
20
0.50
8
10
0.45
0
6
FY09
FY10
FY11
FY12
FY13
FY14
FY15
FY16E FY17E
EBIDTA (` cr)
EBIDTA Margin (%)
Source: Company, Angel Research
Source: Exchange rates, Angel Research
Exports to provide steady growth
The export segment, constituting about 7% of revenues, is expected to provide
steady revenue stream for the company. Apart from boosting the top-line, exports
act as a natural hedge given the high level of raw material imports. To enhance
exports, RBL aims to strengthen distribution network in the existing markets of
SAARC, Middle East and Africa. It is also tapping new markets and has recently
commenced supplies to Nigeria, Malawi and Ukraine. Further, RBL has identified
Europe as a focus area to enhance export revenues and it also aims to expand
product offerings in the market.
Exhibit 6: RBL export growth trend
40
30
35
25
30
20
25
20
15
15
10
10
5
5
0
0
FY10
FY11
FY12
FY13
FY14
FY15
FY16E
FY17E
Exports (` cr)
Growth (%)
Source: Company, Angel Research
Margin improvement coupled with improvement in leverage to
boost return ratios
RBL’s margins are estimated to improve by 70bp over FY2016/17. This would be
on the back of a double digit top-line growth, increased localization coupled with
savings in energy costs. Further, RBL has no major capex plans in the immediate
term. We also estimate the leverage metrics of RBL to improve over the next two
years, considering the improving profitability and stable debt levels. Consequently,
we expect the Debt/Equity ratio to improve marginally. Given the improvement in
profitability coupled with improving D/E ratio, we expect the RoCE to improve from
June 16, 2015
4
Rane Brake Lining | Initiating Coverage
13% in FY2015 to 17% in FY2017. Also, RoE is estimated to improve from 13%
currently to 15% in FY2017.
Exhibit 7: Capital Gearing
Exhibit 8: Return ratios
1.2
20
18
1.0
16
0.8
14
0.6
12
0.4
10
0.2
8
0.0
6
FY12
FY13
FY14
FY15
FY16E
FY17E
FY12
FY13
FY14
FY15
FY16E
FY17E
Debt/Equity (x)
RoE (%)
RoCE (%)
Source: Company, Angel Research
Source: Company, Angel Research
Management targets
The Management is targeting revenue CAGR of 18% over FY2015-FY2018. As
per the Management, uptrend in OEM sales would contribute to the robust
growth. Also, the company’s efforts of enhancing aftermarket base by
increasing dealer network in the underpenetrated Northern and Eastern
markets & introducing new products would boost the top-line.
The Management is aiming to double the RoCE to 25% by FY2018. Margin
improvement on back of raw material localization, energy savings, and
lowering leverage would be the key drivers to achieve the desired RoCE.
RBL has guided for a cumulative capex of `120cr over the next three years.
June 16, 2015
5
Rane Brake Lining | Initiating Coverage
Outlook and Valuation
RBL’s revenues are estimated to grow at 12% CAGR over the next two years.
Upsurge in OEM volumes coupled with focus on the aftermarket segment would
drive the top-line. Also, the company’s margins are expected to improve on
account of operating leverage, enhanced local procurement and energy savings.
Given the healthy top-line growth and margin improvement, RBL’s earnings are
likely to grow at a CAGR of 17% over FY2015-2017. Its return ratios are also
estimated to expand due to margin improvement and reduction in leverage. We
initiate coverage on RBL with a Buy recommendation and target price of `336
(based on 12x FY2017 earnings).
Exhibit 9: One-year forward P/E band
450
400
350
300
250
200
150
100
50
0
Price (`)
4x
8x
12x
16x
Source: Company, Angel Research
Company Background
Rane Brake Lining Ltd (RBL) is a part of diversified ancillary supplier Rane Group.
Rane Group has a strong and diversified clientele and supplies various products viz
steering and suspension systems, steering columns, hydraulic pumps, friction
material, engine components and diecast components. The group through its
holding arm (Rane Holdings Ltd) has four subsidiaries viz Rane Madras Ltd, Rane
Engine Valves Ltd, Rane Brake Lining Ltd and Rane Holdings America Inc. Rane
Group also has three joint ventures namely Rane TRW Steering Systems, Rane NSK
Steering Systems and JMA Marketing Ltd.
RBL is the flagship company of the Rane Group engaged in the manufacturing of
safety critical components such as brake linings, disc pads, clutch facings, clutch
buttons, brake shoes and railway brake blocks. Key braking components ie brake
lining and disc pads constitute bulk of the revenues (approximately 87%) for the
company. The products are manufactured across four plants based in South India.
June 16, 2015
6
Rane Brake Lining | Initiating Coverage
Exhibit 10: RBL manufacturing footprint
Location
Products
User segment
Brake linings, disc pads and clutch facings; Composite brake blocks; Organic pads for
Automotive, Railway,
Chennai
trainer aircraft
Aerospace
Hyderabad
Brake linings, clutch facings & sintered clutch buttons; Compositive brake blocks
Automotive, Railway
Puducherry
Disc pads, clutch facings & CV brake pads; Composite brake blocks
Automotive, Railway
Trichy
Disc pads & brake linings
Automotive
Source: Company, Angel Research
RBL supplies braking and related components across the automotive segments viz
passenger vehicles, commercial vehicles, two wheelers and railways. Passenger car
and the HCV segment constitute about 33% and 39% revenues for the company.
Aircraft and the utility vehicle segment contribute about 9% and 7% respectively.
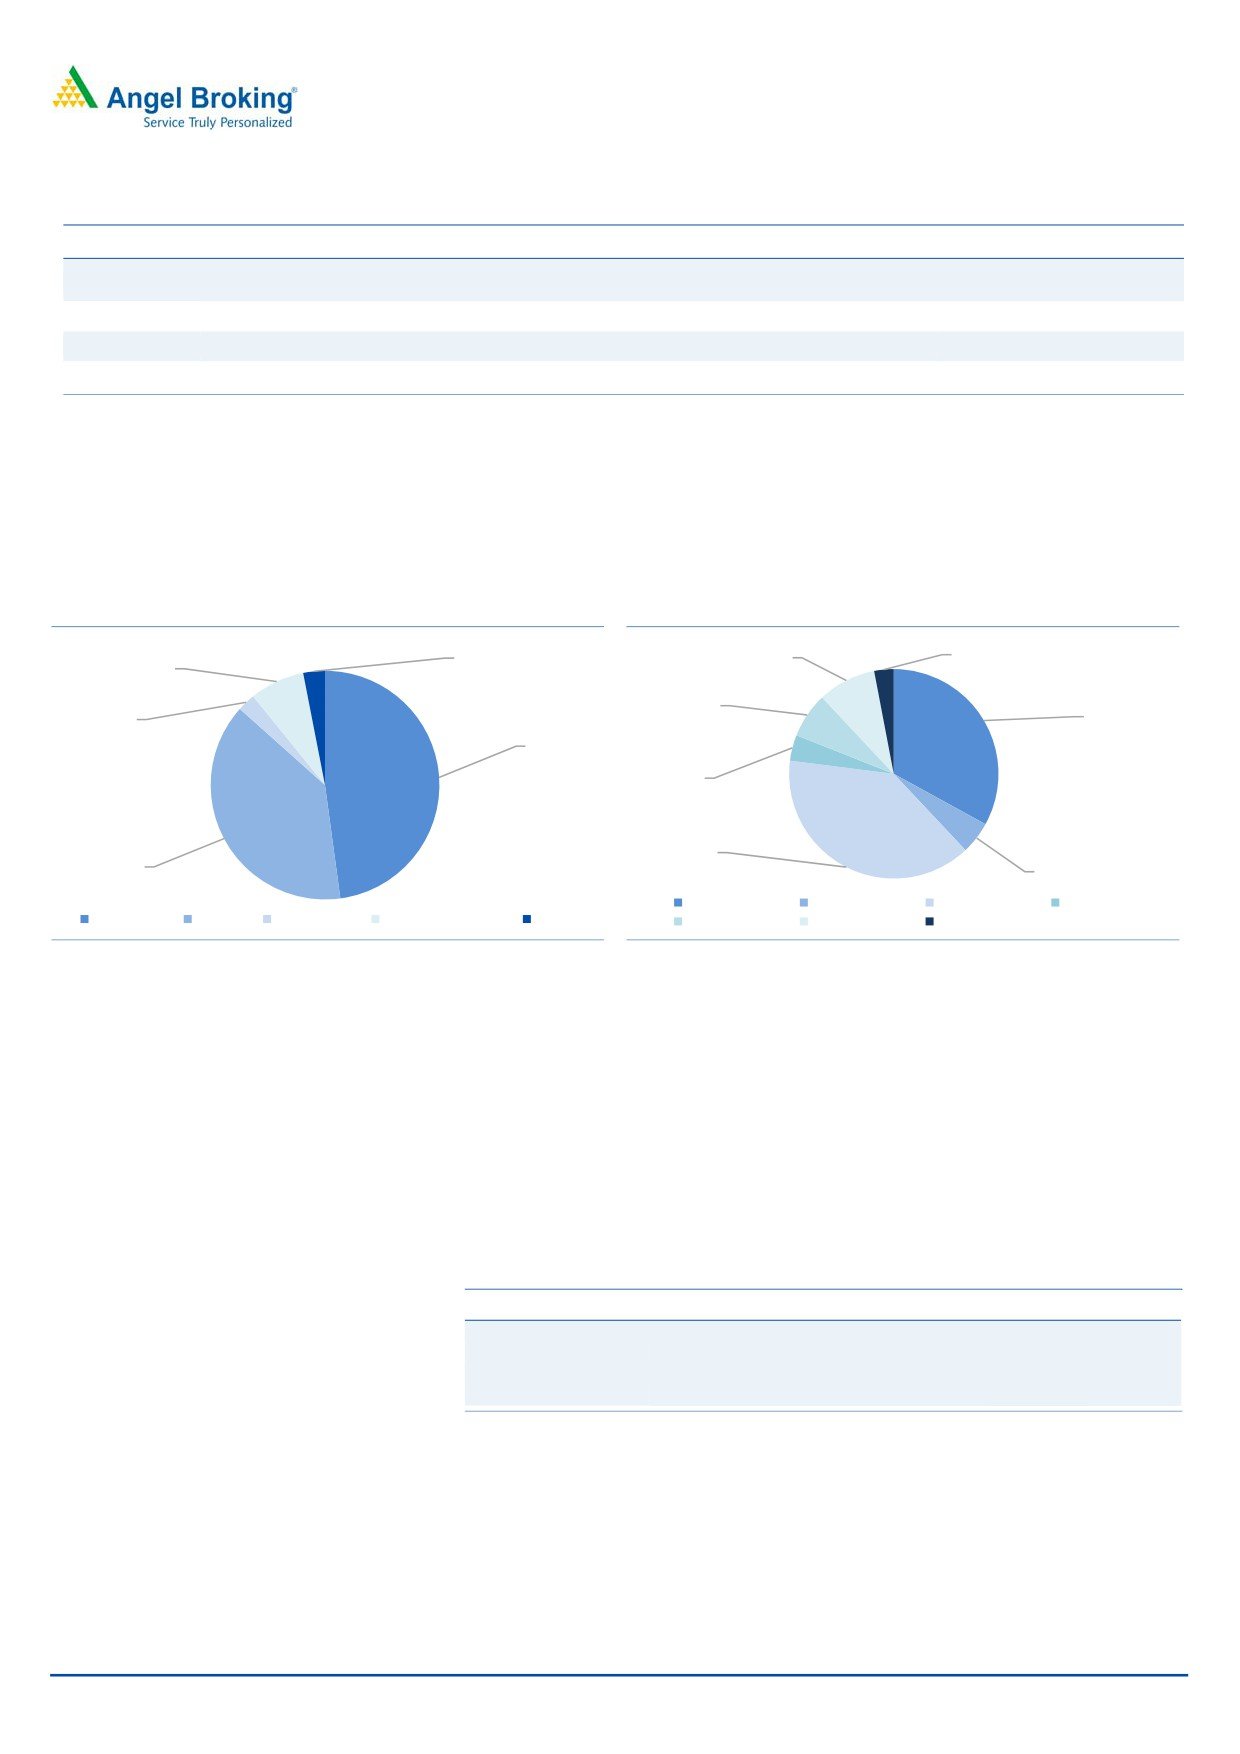
Exhibit 11: Product breakup
Exhibit 12: Segmentwise breakup
3%
9%
3%
8%
7%
3%
33%
48%
4%
39%
39%
5%
Pasenger cars
SCV/LCV/MCV HCV
2W/3W
Brake Linings Disc Pads Clutch facings Railway brake blocks Others
Railways
Aircraft and UV
Tractors
Source: Company, Angel Research
Source: Company, Angel Research
The OEM segment forms about half of the revenues of the company. RBL has
leadership position in the domestic market commanding share of 38%. RBL is a
Tier 2 supplier catering to leading OEMs such as Maruti Suzuki, Toyota, Honda
and Nissan. In the commercial vehicle segment RBL’s key clientele includes leading
players like Tata Motors, Ashok Leyland and M&M. Apart from the OEM segment,
RBL also has strong presence in the aftermarket space, which forms about 40% of
the revenues. Given the strong OEM base and a well established dealer network,
RBL is a preferred aftermarket supplier commanding a market share of 18%.
Exhibit 13: Client base
Key clientile
End customers
Tier 1 clientle
Passenger vehicle
Maruti Suzuki, Toyota, Honda India,
Brakes India, Brembo,
Nissan, Volkswagen India
Mando, Endurance,
Commercial Vehicle Tata Motors, Ashok Leyland, M&M,
Chassis Brakes
Bharat Benz
International
Source: Company, Angel Research
June 16, 2015
7
Rane Brake Lining | Initiating Coverage
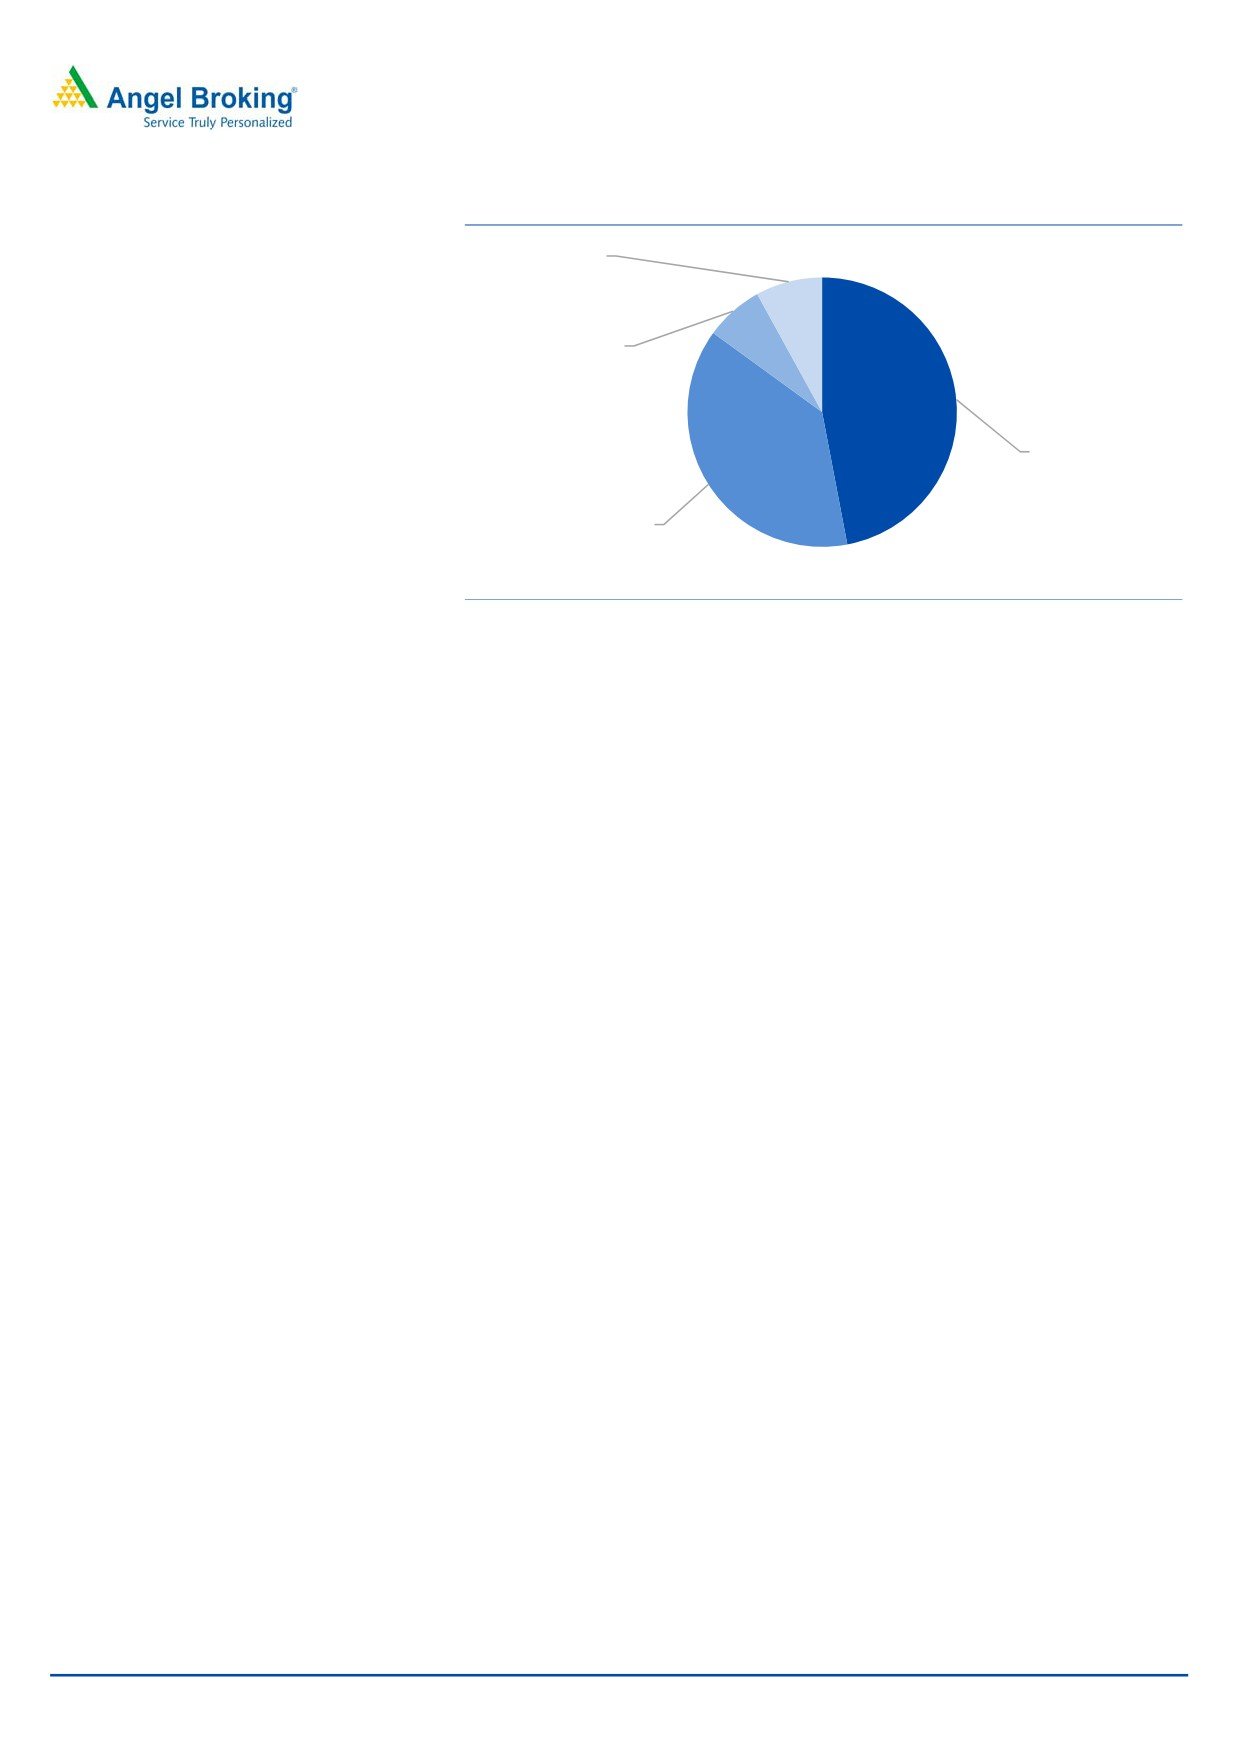
Exhibit 14: Customer segmentation
Others, 8%
Exports, 7%
OEM, 47%
Aftermarket, 38%
Source: Company, Angel Research
June 16, 2015
8
Rane Brake Lining | Initiating Coverage
Profit & Loss Statement
Y/E March (` cr)
FY2012
FY2013
FY2014
FY2015
FY2016E
FY2017E
Total operating income
359
376
384
416
460
520
% chg
17.4
4.8
2.0
8.4
10.5
13.0
Total Expenditure
320
344
344
371
408
460
Net Raw Materials
195
204
194
204
224
252
Personnel
46
49
53
61
69
78
Other
79
90
97
106
115
130
EBITDA
39
33
40
45
52
60
% chg
15.9
(16.7)
22.5
13.1
14.0
16.0
(% of Net Sales)
11.0
8.7
10.5
10.9
11.3
11.6
Depreciation & Amortisation
15
18
18
21
22
25
EBIT
26
14
19
23
30
36
% chg
18.5
(46.1)
35.1
18.6
32.1
18.8
(% of Net Sales)
7.3
3.8
5.0
5.4
6.5
6.8
Interest & other Charges
7
7
8
6
6
7
Other Income
4
3
2
2
3
4
PBT (recurring)
22
11
17
21
27
32
% chg
11.3
(50.1)
53.2
23.2
30.9
19.0
Extraordinary Expense/(Inc.)
0
0
0
0
0
0
PBT (reported)
22
11
17
21
27
32
Tax
6
2
0
4
8
10
(% of PBT)
26.1
16.7
(2.9)
21.8
31.0
31.0
PAT (reported)
16
9
17
16
19
22
ADJ. PAT
16
9
17
16
19
22
% chg
5.9
(43.8)
89.1
(6.4)
15.4
19.0
(% of Net Sales)
4.5
2.4
4.5
3.9
4.0
4.3
Basic EPS (`)
20.5
11.5
21.7
20.4
23.5
28.0
Fully Diluted EPS (`)
20.5
11.5
21.7
20.4
23.5
28.0
% chg
5.9
(43.8)
89.1
(6.4)
15.4
19.0
June 16, 2015
9
Rane Brake Lining | Initiating Coverage
Balance sheet statement
Y/E March (` cr)
FY2012 FY2013 FY2014 FY2015E FY2016E FY2017E
SOURCES OF FUNDS
Equity Share Capital
8
8
8
8
8
8
Reserves& Surplus
89
94
104
114
125
138
Shareholders Funds
97
102
112
122
133
146
Total Loans
84
90
81
67
65
74
Deferred Tax Liability
9
9
9
9
9
9
Other long term liab.
0
0
0
0
0
0
Long term provisions
1
2
2
2
2
2
Total Liabilities
191
203
205
200
209
232
APPLICATION OF FUNDS
Gross Block
240
259
286
293
315
356
Less: Acc. Dep.
119
136
153
174
196
221
Net Block
121
123
133
119
119
135
Capital WIP
3
19
0
0
0
0
Investments
0
0
0
0
0
0
Long Loans and adv.
8
7
9
10
11
12
Current Assets
119
113
125
136
151
165
Cash
11
2
3
6
7
3
Short term loan
8
7
7
8
9
10
Other
100
104
114
122
135
153
Current liabilities
61
58
63
66
73
82
Net Current Assets
58
55
61
70
78
83
Total Assets
191
203
205
200
209
232
June 16, 2015
10
Rane Brake Lining | Initiating Coverage
Cash flow statement
Y/E March (` cr)
FY2012
FY2013
FY2014
FY2015E FY2016E FY2017E
Profit before tax
22
11
17
21
27
32
Depreciation
15
17
17
21
22
25
Change in Working Capital
(4)
(5)
(6)
(7)
(7)
(10)
Others
1
(0)
(0)
0
0
0
Direct taxes paid
(6)
(2)
0
(4)
(8)
(10)
Cash Flow from Operations
28
21
29
31
34
38
(Inc.)/ Dec. in Fixed Assets
(31)
(35)
(9)
(7)
(22)
(41)
(Inc.)/ Dec. in Investments
0
0
0
0
0
0
(Inc.)/ Dec. in Loans & Adv
-
-
-
-
-
-
Cash Flow from Investing
(31)
(35)
(9)
(7)
(22)
(41)
Issue of Equity
-
-
-
-
-
-
Inc./(Dec.) in loans
20
6
(9)
(14)
(2)
9
Dividend Paid (Incl. Tax)
(6)
(3)
(6)
(7)
(8)
(9)
Others
(3)
2
(3)
(1)
(1)
(1)
Cash Flow from Financing
12
5
(18)
(21)
(11)
(1)
Inc./(Dec.) in Cash
9
(8)
2
2
1
(5)
Opening Cash balances
2
11
2
3
6
7
Closing Cash balances
11
2
3
6
7
3
June 16, 2015
11
Rane Brake Lining | Initiating Coverage
Key ratios
Y/E March
FY2012
FY2013
FY2014
FY2015E
FY2016E
FY2017E
Valuation Ratio (x)
P/E (on FDEPS)
13.8
24.5
13.0
13.9
12.0
10.1
P/CEPS
7.1
8.3
6.3
6.0
5.5
4.7
P/BV
2.3
2.2
2.0
1.8
1.7
1.5
Dividend yield (%)
2.0
1.1
2.1
2.0
2.3
2.7
EV/Sales
0.8
0.8
0.8
0.7
0.6
0.6
EV/EBITDA
7.5
9.5
7.5
6.3
5.4
4.9
EV / Total Assets
1.6
1.5
1.5
1.4
1.3
1.3
Per Share Data (`)
EPS (Basic)
20.5
11.5
21.7
20.4
23.5
28.0
EPS (fully diluted)
20.5
11.5
21.7
20.4
23.5
28.0
Cash EPS
39.5
34.1
44.8
46.8
51.4
59.5
DPS
5.5
3.2
5.9
5.6
6.5
7.7
Book Value
122.0
128.9
141.8
153.9
167.7
184.3
Dupont Analysis
EBIT margin
7.3
3.8
5.0
5.4
6.5
6.8
Tax retention ratio
0.7
0.8
1.0
0.8
0.7
0.7
Asset turnover (x)
2.0
1.9
1.9
2.1
2.3
2.3
ROIC (Post-tax)
10.8
5.9
9.8
9.1
10.2
10.7
Cost of Debt (Post Tax)
5.9
6.8
9.8
7.0
6.2
6.2
Leverage (x)
0.8
0.9
0.7
0.5
0.4
0.5
Operating ROE
14.4
5.1
9.8
10.2
12.0
12.9
Returns (%)
ROCE (Pre-tax)
15.0
9.0
11.9
13.3
15.7
16.7
Angel ROIC (Pre-tax)
14.6
7.0
9.5
11.6
14.8
15.5
ROE
16.8
8.9
15.3
13.2
14.0
15.2
Turnover ratios (x)
Asset Turnover (Gross Block)
1.50
1.46
1.34
1.42
1.46
1.46
Inventory / Sales (days)
28.7
27.3
26.5
27.0
27.0
27.0
Receivables (days)
70.6
72.9
81.8
80.0
80.0
80.0
Payables (days)
61.8
56.5
60.3
57.6
57.6
57.4
WC cycle (ex-cash) (days)
48.2
50.9
55.2
56.7
56.6
56.8
Solvency ratios (x)
Net debt to equity
0.8
0.9
0.7
0.5
0.4
0.5
Net debt to EBITDA
1.9
2.7
1.9
1.3
1.1
1.2
Interest Coverage (EBIT / Int.)
3.9
1.9
2.5
3.8
5.1
5.3
June 16, 2015
12
Rane Brake Lining | Initiating Coverage
Research Team Tel: 022 - 39357800
DISCLAIMER
Angel Broking Private Limited (hereinafter referred to as “Angel”) is a registered Member of National Stock Exchange of India Limited,
Bombay Stock Exchange Limited and MCX Stock Exchange Limited. It is also registered as a Depository Participant with CDSL and
Portfolio Manager with SEBI. It also has registration with AMFI as a Mutual Fund Distributor. Angel Broking Private Limited is a
registered entity with SEBI for Research Analyst in terms of SEBI (Research Analyst) Regulations, 2014 vide registration number
INH000000164. Angel or its associates has not been debarred/ suspended by SEBI or any other regulatory authority for accessing
/dealing in securities Market. Angel or its associates including its relatives/analyst do not hold any financial interest/beneficial
ownership of more than 1% in the company covered by Analyst. Angel or its associates/analyst has not received any compensation /
managed or co-managed public offering of securities of the company covered by Analyst during the past twelve months. Angel/analyst
has not served as an officer, director or employee of company covered by Analyst and has not been engaged in market making activity
of the company covered by Analyst.
This document is solely for the personal information of the recipient, and must not be singularly used as the basis of any investment
decision. Nothing in this document should be construed as investment or financial advice. Each recipient of this document should
make such investigations as they deem necessary to arrive at an independent evaluation of an investment in the securities of the
companies referred to in this document (including the merits and risks involved), and should consult their own advisors to determine
the merits and risks of such an investment.
Reports based on technical and derivative analysis center on studying charts of a stock's price movement, outstanding positions and
trading volume, as opposed to focusing on a company's fundamentals and, as such, may not match with a report on a company's
fundamentals.
The information in this document has been printed on the basis of publicly available information, internal data and other reliable
sources believed to be true, but we do not represent that it is accurate or complete and it should not be relied on as such, as this
document is for general guidance only. Angel Broking Pvt. Limited or any of its affiliates/ group companies shall not be in any way
responsible for any loss or damage that may arise to any person from any inadvertent error in the information contained in this report.
Angel Broking Pvt. Limited has not independently verified all the information contained within this document. Accordingly, we cannot
testify, nor make any representation or warranty, express or implied, to the accuracy, contents or data contained within this document.
While Angel Broking Pvt. Limited endeavors to update on a reasonable basis the information discussed in this material, there may be
regulatory, compliance, or other reasons that prevent us from doing so.
This document is being supplied to you solely for your information, and its contents, information or data may not be reproduced,
redistributed or passed on, directly or indirectly.
Neither Angel Broking Pvt. Limited, nor its directors, employees or affiliates shall be liable for any loss or damage that may arise from
or in connection with the use of this information.
Note: Please refer to the important ‘Stock Holding Disclosure' report on the Angel website (Research Section). Also, please refer to the
latest update on respective stocks for the disclosure status in respect of those stocks. Angel Broking Pvt. Limited and its affiliates may
have investment positions in the stocks recommended in this report.
Disclosure of Interest Statement
Rane Brake Lining
1. Analyst ownership of the stock
No
2. Angel and its Group companies ownership of the stock
No
3. Angel and its Group companies' Directors ownership of the stock
No
4. Broking relationship with company covered
No
Note: We have not considered any Exposure below ` 1 lakh for Angel, its Group companies and Directors
Ratings (Based on expected returns
Buy (> 15%)
Accumulate (5% to 15%)
Neutral (-5 to 5%)
over 12 months investment period):
Reduce (-5% to -15%)
Sell (< -15)
June 16, 2015
13