1QFY2017 Result Update | Agrichemical
July 26, 2016
Rallis India
NEUTRAL
CMP
`218
Performance Highlights
Target Price
-
Y/E March (` cr)
1QFY2017 4QFY2016
% chg (qoq) 1QFY2016
% chg (yoy)
Investment Period
-
Net sales
445
342
30.1
415
7.2
Other income
7
15
(53.1)
5
47.8
Stock Info
Gross profit
202
148
36.3
186
8.5
Sector
Agrichemical
Operating profit
70
36
96.8
56
24.8
Market Cap (` cr)
4,246
Adj. Net profit
49
32
52.7
42
16.1
Net debt (` cr)
126
Source: Company, Angel Research
Beta
0.8
52 Week High / Low
240/142
For 1QFY2017, Rallis India (Rallis) reported a yoy growth of 7.2% in sales to
Avg. Daily Volume
83,801
`445cr (V/s `415cr in 1QFY2016). On the operating front, the gross margin
Face Value (`)
1
came in at 45.4% (V/s 44.8% in 1QFY2016), which along with sales growth
BSE Sensex
28,095
aided the OPM to come in at 15.8% (V/s 13.5% in 1QFY2016). Aided by sales
Nifty
8,636
growth, a good operating performance and surge in other income (`7cr V/s `5cr
Reuters Code
RALL.BO
in 1QFY2016), the Adj. Net profit grew 16.1% yoy to `49cr (V/s `42cr in
Bloomberg Code
RALI@IN
1QFY2016). We maintain our Neutral view on the stock.
Robust numbers: For 1QFY2017, the company reported a yoy growth of 7.2% in
Shareholding Pattern (%)
sales to `445cr (V/s `415cr in 1QFY2016). On the operating front, the gross
Promoters
50.1
margin came in at 45.4% (V/s 44.8% in 1QFY2016), which along with sales
MF / Banks / Indian Fls
19.1
growth aided the OPM to come in at 15.8% (V/s 13.5% in 1QFY2016). Aided by
FII / NRIs / OCBs
7.7
sales growth, a good operating performance and surge in other income (`7cr V/s
Indian Public / Others
23.1
`5cr in 1QFY2016), the Adj. Net profit grew 16.1% yoy to `49cr (V/s `42cr in
1QFY2016). The reported net profit came in at `174cr (V/s `42cr in 1QFY2016),
Abs. (%)
3m 1yr 3yr
benefitting from an exceptional income of `158cr related to profit on assignment
Sensex
9.4
(0.1)
39.8
of leasehold rights of a plot of land in MIDC area, Turbhe, Novi Mumbai.
Rallis India
13.5
(7.0)
40.1
Outlook and valuation: For FY2016-18E, we expect a CAGR of 15.0% and
22.3% in net sales and profit, respectively, with recovery expected in FY2017. At
3-year price chart
the current levels, the stock is trading at a fair valuation of 19.8x its FY2018E EPS.
400
350
Hence, we maintain our Neutral recommendation on the stock.
300
250
Key financials (Consolidated)
200
Y/E March (` cr)
FY2015
FY2016
FY2017E
FY2018E
150
Net Sales
1,822
1,637
1,937
2,164
100
% chg
4.3
(10.1)
18.3
11.7
50
0
Adj.Net Profit
157
143
176
214
% chg
3.5
(9.0)
22.8
21.9
EBITDA %
14.2
13.3
13.3
14.3
Source: Company, Angel Research
FDEPS (`)
8.1
7.4
9.0
11.0
P/E (x)
27.0
29.7
24.2
19.8
P/BV (x)
5.2
4.7
4.2
3.7
RoE (%)
20.5
16.7
18.4
19.8
RoACE (%)
24.7
19.2
20.2
22.1
Sarabjit Kour Nangra
EV/Sales (x)
2.3
2.6
2.2
1.9
+91-22-39357800 ext. 6806
EV/EBITDA (x)
16.4
19.5
16.4
13.3
Source: Company, Angel Research; Note: CMP as of July 25, 2016
Please refer to important disclosures at the end of this report
1
Rallis India | 1QFY2017 Result Update
Exhibit 1: 1QFY2017 performance (Consolidated)
Y/E March (` cr)
1QFY2017
4QFY2016
% chg (QoQ) 1QFY2016
% chg (YoY)
FY2016
FY2015
% chg
Net sales
445
342
30.1
415
7.2
1,612
1,801
(10.5)
Other income
7
15
(53.1)
5
47.8
30
25
19.9
Total income
452
357
26.6
420
7.6
1,642
1,826
(10.1)
Gross profit
202
148
36.3
186
8.5
773
806
(4.1)
Gross margin (%)
45.4
43.3
44.8
48.0
44.8
EBDITA
70
36
96.8
56
24.8
214
256
(16.5)
EBDITA margin (%)
15.8
10.4
13.5
13.3
14.2
Financial cost
2
3
(22.5)
4
(43.5)
14
10
35.5
Depreciation
12
6
110.9
11
8.3
45
50
(10.8)
PBT
62
42
49.4
45
37.6
186
221
(16.0)
Provision for taxation
47
10
380.2
3
1473.6
39
62
(37.2)
PAT Before Exc. And MI
16
32
(50.7)
42
(62.7)
147
160
(8.3)
Minority
0
(0)
0
4
3
-
Exceptional
158
0
0
0
0
Reported PAT
174
32
440.2
42
310.9
143
157
(9.0)
Adjusted PAT
49
32
52.7
42
16.1
143
157
(9.0)
EPS (`)
2.5
1.7
2.2
7.4
8.1
Source: Company, Angel Research
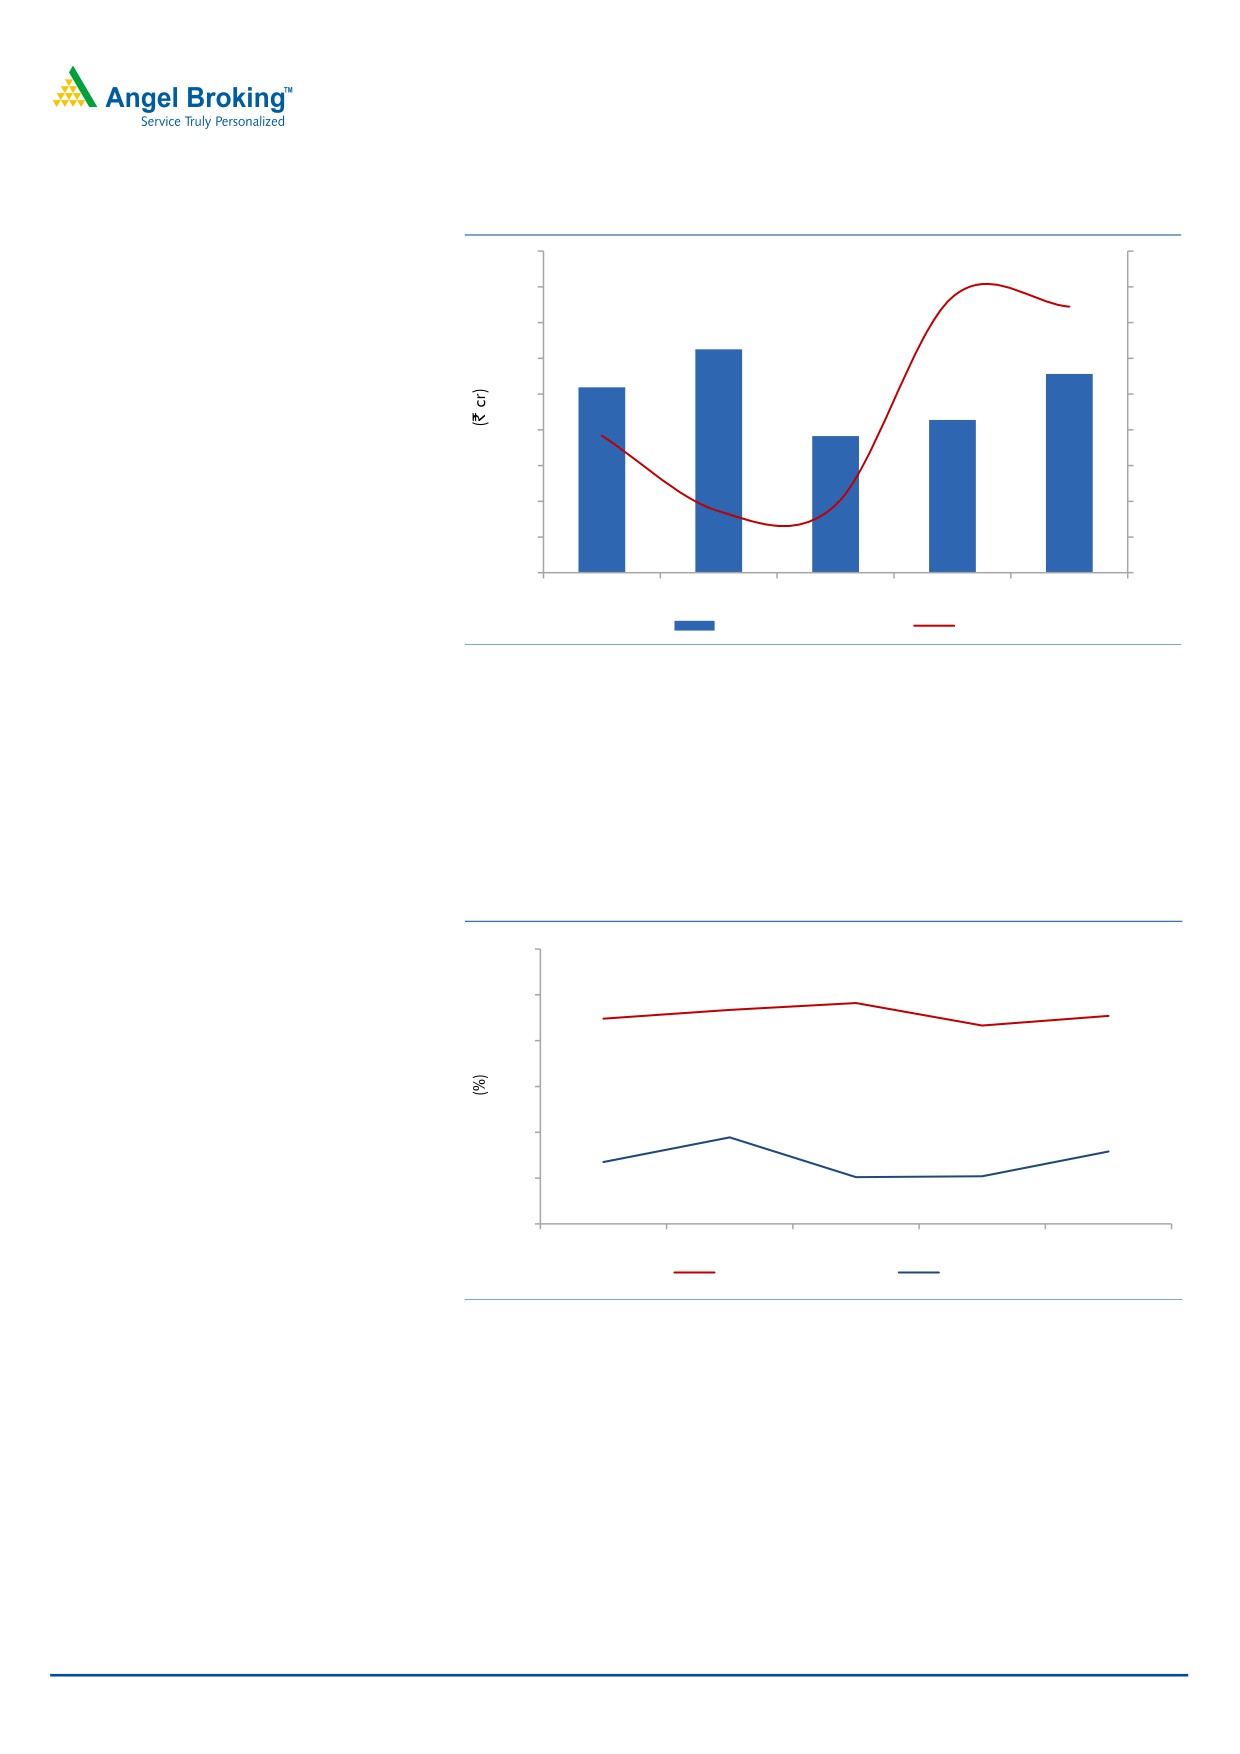
Sales rose by 7.2% yoy
For 1QFY2017, the company’s sales rose 7.2% yoy to `445cr (V/s `415cr in
1QFY2016). The onset of monsoon this year was delayed and the progress in June
was sluggish, leaving a monsoon deficit of 11% by the end of the month. A sharp
drop in cotton planting further accentuated the concerns for the company.
Consequently demand and placement were muted during 1QFY2017 which
however have picked up in July. With purchase of agrochemicals shifting to the
current quarter, the Management remains confident of robust growth in
2QFY2017.
Metahelix revenues registered a 16% yoy growth to `189.7cr, which is soft due to
unavailability of seeds. Poor Rabi yields due to lack of ground water resulted in
shortage of seeds.
July 26, 2016
2
Rallis India | 1QFY2017 Result Update
Exhibit 2: Revenue performance
720
15
640
10
560
5
500
480
445
0
415
400
(5)
342
306
320
(10)
240
(15)
160
(20)
80
(25)
0
(30)
1QFY2016
2QFY2016
3QFY2016
4QFY2016
1QFY2017
Total Revenue
% YoY
Source: Company, Angel Research
OPM expands yoy
On the operating front, the gross margin came in at 45.4% V/s 44.8% in
1QFY2016, which along with sales growth aided the OPM to come in at 15.8%
(V/s 13.5% in 1QFY2016). The gross margin for the quarter expanded by 55bp
yoy, while the OPM expanded by 220bp.
Exhibit 3: Margin trend (%)
60.0
48.2
46.7
50.0
44.8
45.4
43.3
40.0
30.0
20.0
18.9
10.0
15.8
13.5
10.2
10.4
0.0
1QFY2016
2QFY2016
3QFY2016
4QFY2016
1QFY2017
Gross margin
EBITDA margin
Source: Company, Angel Research
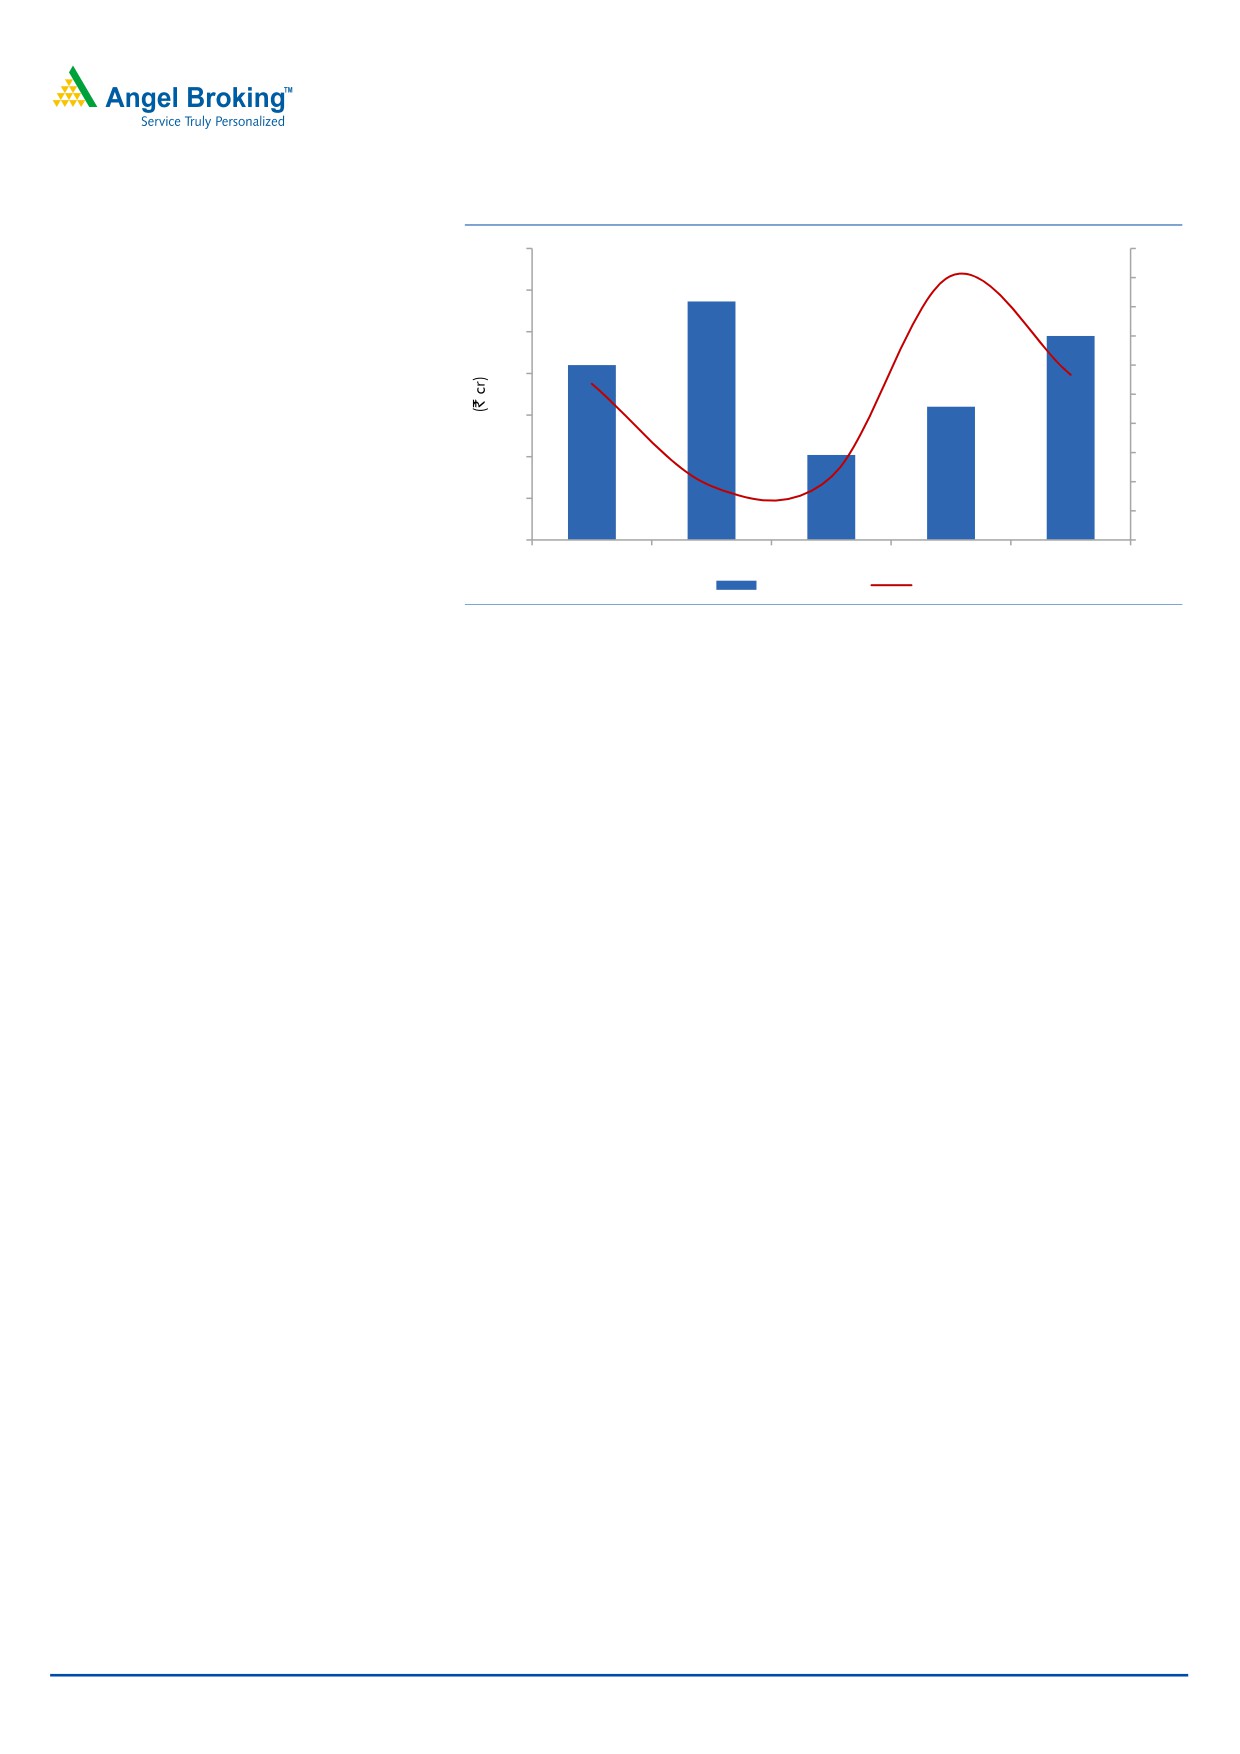
Earnings rise 16.1% yoy on back of exceptional income
Aided by sales growth, a good operating performance and surge in other income
(`7cr V/s `5cr in 1QFY2016), the Adj. Net profit grew 16.1% yoy to `49cr (V/s
`42cr in 1QFY2016). The reported net profit came in at `174cr (V/s `42cr in
1QFY2016), benefitting from an exceptional income of `158cr related to profit on
assignment of leasehold rights of a plot of land in MIDC area, Turbhe, Novi
Mumbai. The profit is net of costs including a premium levied under the repealed
Urban Land (Ceiling and Regulation) Act 1976, which has been paid under
protest.
July 26, 2016
3
Rallis India | 1QFY2017 Result Update
Exhibit 4: Adjusted PAT trend
70
60
50
57
60
40
49
50
30
42
20
40
32
10
30
0
20
20
(10)
(20)
10
(30)
0
(40)
1QFY2016
2QFY2016
3QFY2016
4QFY2016
1QFY2017
Adj PAT
% YoY
Source: Company, Angel Research
July 26, 2016
4
Rallis India | 1QFY2017 Result Update
Concall highlights
The Management has shared a positive outlook for the year on the back of a
normal monsoon and pick up in the company’s export business.
The onset of monsoon was delayed and the progress in June was sluggish,
leaving an 11% monsoon deficit by the end of the month. Concerns got
accentuated by a sharp drop in cotton planting. Consequently, demand and
placement were muted during 1QFY2017 which however have picked up in
July. With purchase of agrochemicals shifting to the current quarter, the
Management remains confident of robust growth in 2QFY2017.
Investment arguments
Company set to seize rising opportunities in the domestic crop protection market:
India's overall pesticide consumption is one of the lowest in the world and has a
huge potential to grow. We believe Rallis is well placed to seize this opportunity on
the back of its wide distribution network, strong brands, and a robust new-product
pipeline. According to industry estimates, the unorganized market accounts for
50% of the industry. Nonetheless, we believe Rallis is in a position to wrest market
share as well as charge a premium for its products. FY2016 has been challenging
on back of poor monsoons but the outlook for FY2017 is favorable and should
bode well for domestic sales growth. A lower base would result in 17.3% CAGR in
the domestic business during FY2016-18E.
Exports under pressure: Although a late entrant, the company has been enhancing
its focus in the exports market, which is now turning out to be its main growth
driver. Overall exports formed ~30% of sales in FY2016. In FY2016, the global
weakness in the agrochemical industry put pressure on Rallis’ exports business
where the revenues dropped by 20% yoy to `400cr. The company’s primary export
market is Brazil where a sluggish demand environment, currency volatility and
macro headwinds led to deferment/cancelation of many orders. However, export
orders saw a revival in 4QFY2016; still the Management remains cautious on
recovery in Brazil which could take more than a couple of quarters. This would
likely keep the exports business revenues under pressure. Going forward, the
segment will continue to post a 7.2% CAGR over FY2016-18E.
Seed business to augment the domestic portfolio: After the acquisition of
Metahelix’ seeds business in 2010, the seeds business forms a major part of the
domestic business of the company. During FY2016, Rallis’ seed business under
Metahelix reported a decent growth of 8% yoy to `334cr (almost 23% of the
domestic business) on back of increased market share and despite significant
reduction in acreages for some of the key crops such as paddy and corn. The
company is also strengthening its cotton portfolio and will be launching a new
product to take on the market leaders in this crop. The Management remains
confident of Metahelix achieving 12-14% margins in a good monsoon year.
During FY2016, the company increased its stake in Metahelix to 100%.
Contract manufacturing ramping up slowly: Rallis plans to focus on contract
manufacturing for exports and selectively target top players. To facilitate the same,
the company has set up a plant at Dahej, which in FY2013 was working at full
capacity and contributed significantly to the overall growth of the company. The
July 26, 2016
5
Rallis India | 1QFY2017 Result Update
company has bagged two CRAMS projects on a pilot basis during the year. The
Management expects to convert these pilot projects into full commercial contracts
in FY2017 and expects them to contribute to earnings growth from FY2018-2019.
Currently, Rallis has two molecules under CRAMS which are being manufactured
at its Dahej facility.
Outlook and valuation
Over FY2016-18E, we expect the company to post a CAGR of 15.0% and 22.3%
in net sales and profit, respectively, with recovery expected in FY2017, driven by
above normal monsoons. At the current levels, the stock is trading at a fair
valuation of
19.8x its FY2018E EPS. Hence, we maintain our Neutral
recommendation on the stock.
Exhibit 5: Key assumptions
Particulars (%)
FY2017E
FY2018E
Domestic growth
24.0
11.0
Export growth
5.0
15.0
Total revenue growth
18.3
11.7
EBITDA margin
13.3
14.3
Capex (` cr)
70
70
Source: Company, Angel Research
Exhibit 6: Peer valuation
Company Reco
Mcap CMP TP
Upside
P/E (x)
EV/Sales (x)
EV/EBITDA (x)
RoE (%)
CAGR (%)
(` cr)
(`)
(`)
(%) FY17E FY18E FY17E FY18E FY17E FY18E FY17E FY18E Sales PAT
Rallis
Neutral
4,215
218
-
-
24.2
19.8
2.2
1.9
16.4
13.3
18.4
19.8
15.0
22.3
UPL
Buy
25,888
579
684
18.1
15.9
13.3
1.7
1.4
9.1
7.6
21.4
21.2
16.0
18.9
Source: Company, Angel Research, Bloomberg
July 26, 2016
6
Rallis India | 1QFY2017 Result Update
Company background
Rallis is one of the oldest and second largest pesticide agrichemical companies in
the country with a market share of around 13% and belongs to the Tata Group.
The company also has a credible presence in the international market.
Contribution from the domestic business stands at ~70%, while exports account
for the balance.
July 26, 2016
7
Rallis India | 1QFY2017 Result Update
Profit & loss (Consolidated)
Y/E March (` cr)
FY2013
FY2014
FY2015
FY2016
FY2017E
FY2018E
Gross sales
1,535
1,840
1,922
1,730
2,059
2,302
Less: Excise duty
95
114
121
119
147
164
Net Sales
1,440
1,726
1,801
1,612
1,911
2,138
Other operating income
18
21
21
26
26
26
Total operating income
1,458
1,747
1,822
1,637
1,937
2,164
% chg
14.4
19.8
4.3
(10.1)
18.3
11.7
Total Expenditure
1,241
1,485
1,545
1,398
1,656
1,832
Net Raw Materials
823
1,008
995
839
1,110
1,242
Other Mfg costs
304
342
341
404
382
406
Personnel
94
111
129
132
137
154
Other
20
24
25
22
27
30
EBITDA
199
240
256
214
255
306
% chg
3.9
20.8
6.5
(16.5)
19.1
20.3
(% of Net Sales)
13.8
13.9
14.2
13.3
13.3
14.3
Depreciation & Amort.
32
41
50
45
56
61
EBIT
186
221
228
195
225
271
% chg
(1.5)
18.9
3.1
(14.3)
15.1
20.8
(% of Net Sales)
12.9
12.8
12.6
12.1
11.8
12.7
Interest & other Charges
21
13
10
14
9
8
Other Income
5
6
4
4
4
4
(% of PBT)
3
3
2
2
2
2
Share in profit of Asso.
-
-
-
-
-
-
Recurring PBT
170
214
222
186
220
268
% chg
(3.5)
26.3
3.4
(16.2)
18.2
21.9
Extraordinary Exp./(Inc.)
3
-
-
-
-
-
PBT (reported)
172
214
222
186
220
268
Tax
53
62
62
39
44
54
(% of PBT)
31.0
28.8
27.9
21.0
20.0
20.0
Minority Interest
(0)
0.8
2.6
3.7
3.7
3.7
PAT (reported)
119
152
157
143
176
214
ADJ. PAT
114
152
157
143
176
214
% chg
4.6
32.9
3.5
(9.0)
22.8
21.9
(% of Net Sales)
7.9
8.8
8.7
8.9
9.2
10.0
Basic EPS (`)
5.9
7.8
8.1
7.4
9.0
11.0
Fully Diluted EPS (`)
5.9
7.8
8.1
7.4
9.0
11.0
% chg
4.6
32.9
3.5
(9.0)
22.8
21.9
July 26, 2016
8
Rallis India | 1QFY2017 Result Update
Balance sheet (Consolidated)
Y/E March (` cr)
FY2013
FY2014
FY2015
FY2016
FY2017E
FY2018E
SOURCES OF FUNDS
Equity Share Capital
19
19
19
19
19
19
Preference Capital
-
-
-
-
-
-
Reserves & Surplus
601
699
795
880
987
1,132
Shareholders Funds
621
718
815
899
1,006
1,152
Minority Interest
5
10
10
4
4
4
Total Loans
131
75
111
75
110
50
Other Long Term Liabilities
6
4
4
4
4
4
Long Term provisions
30
15
19
18
18
18
Deferred Tax Liability
28
32
36
39
39
39
Total Liabilities
821
853
993
1,038
1,184
1,270
APPLICATION OF FUNDS
Gross Block
581
651
687
764
834
904
Less: Acc. Depreciation
195
233
282
327
383
444
Net Block
386
418
405
437
451
460
Capital Work-in-Progress
35
21
21
21
21
21
Goodwill
169
186
196
259
259
259
Investments
20
25
24
28
28
28
Long Term Loans and Adv.
92
98
110
110
109
122
Current Assets
488
549
680
650
778
895
Cash
26
9
7
8
25
53
Loans & Advances
28
40
28
35
69
77
Other
435
500
645
607
684
765
Current liabilities
368
445
443
467
462
517
Net Current Assets
120
104
237
183
316
379
Mis. Exp. not written off
-
-
-
-
-
-
Total Assets
821
853
993
1,038
1,184
1,270
July 26, 2016
9
Rallis India | 1QFY2017 Result Update
Cash flow statement (Consolidated)
Y/E March (` cr)
FY2013
FY2014
FY2015
FY2016
FY2017E FY2018E
Profit before tax
172
214
222
186
220
268
Depreciation
32
41
50
45
56
61
(Inc)/Dec in Working Capital
(61)
(7)
(147)
55
(115)
(47)
Direct taxes paid
(53)
(62)
(62)
(39)
(44)
(54)
Cash Flow from Operations
150
186
63
246
117
227
(Inc.)/ Dec. in Fixed Assets
(5)
(56)
(36)
(76)
(70)
(70)
(Inc.)/ Dec. in Investments
3
(5)
1
(4)
-
-
Inc./ (Dec.) in loans and adv.
Cash Flow from Investing
(2)
(61)
(35)
(80)
(70)
(70)
Issue of Equity
-
-
-
-
-
-
Inc./(Dec.) in loans
(6)
(73)
40
(36)
35
(60)
Dividend Paid (Incl. Tax)
(50)
(55)
(68)
(68)
(68)
(68)
Others
(78)
(14)
(1)
-
-
(1)
Cash Flow from Financing
(134)
(142)
(29)
(165)
(29)
(129)
Inc./(Dec.) in Cash
15
(17)
(2)
1
17
28
Opening Cash balances
11
26
9
7
8
25
Closing Cash balances
26
9
7
8
25
53
July 26, 2016
10
Rallis India | 1QFY2017 Result Update
Key ratios
Y/E March
FY2013
FY2014
FY2015
FY2016
FY2017E
FY2018E
Valuation Ratio (x)
P/E (on FDEPS)
37.2
28.0
27.0
29.7
24.2
19.8
P/CEPS
28.2
22.1
20.5
22.6
18.3
15.5
P/BV
6.8
5.9
5.2
4.7
4.2
3.7
Dividend yield (%)
0.9
0.9
0.9
1.4
1.8
2.3
EV/Sales
2.9
2.4
2.3
2.6
2.2
1.9
EV/EBITDA
21.3
17.4
16.4
19.5
16.4
13.3
EV / Total Assets
5.2
4.9
4.2
4.0
3.5
3.2
Per Share Data (`)
EPS (Basic)
5.9
7.8
8.1
7.4
9.0
11.0
EPS (fully diluted)
5.9
7.8
8.1
7.4
9.0
11.0
Cash EPS
7.7
9.9
10.6
9.6
11.9
14.1
DPS
2.0
2.0
2.0
3.0
4.0
5.0
Book Value
31.9
36.9
41.9
46.2
51.7
59.2
Dupont Analysis
EBIT margin
12.9
12.8
12.6
12.1
11.8
12.7
Tax retention ratio
69.0
71.2
72.1
79.0
80.0
80.0
Asset turnover (x)
1.9
2.1
2.0
1.6
1.7
1.8
ROIC (Post-tax)
16.6
19.0
18.0
15.4
16.4
17.9
Cost of Debt (Post Tax)
10.1
8.7
7.9
11.6
8.0
8.0
Leverage (x)
0.2
0.2
0.2
0.2
0.1
0.1
Operating ROE
18.0
20.6
19.6
16.1
17.3
18.7
Returns (%)
ROCE (Pre-tax)
23.8
26.4
24.7
19.2
20.2
22.1
Angel ROIC (Pre-tax)
33.7
35.9
32.4
25.7
27.6
29.9
ROE
19.5
22.7
20.5
16.7
18.4
19.8
Turnover ratios (x)
Asset Turnover (Gross Block)
2.6
2.8
2.7
2.3
2.4
2.5
Inventory / Sales (days)
67
62
74
89
81
85
Receivables (days)
34
35
37
44
40
42
Payables (days)
111
98
105
119
102
98
WC cycle (ex-cash) (days)
16
20
33
46
45
53
Solvency ratios (x)
Net debt to equity
0.2
0.1
0.2
0.1
0.1
0.0
Net debt to EBITDA
0.7
0.3
0.5
0.4
0.4
0.1
Interest Coverage (EBIT / Int.)
9.0
17.5
22.5
14.4
24.3
33.9
July 26, 2016
11
Rallis India | 1QFY2017 Result Update
Research Team Tel: 022 - 39357800
DISCLAIMER
Angel Broking Private Limited (hereinafter referred to as “Angel”) is a registered Member of National Stock Exchange of India Limited,
Bombay Stock Exchange Limited and Metropolitan Stock Exchange Limited. It is also registered as a Depository Participant with CDSL
and Portfolio Manager with SEBI. It also has registration with AMFI as a Mutual Fund Distributor. Angel Broking Private Limited is a
registered entity with SEBI for Research Analyst in terms of SEBI (Research Analyst) Regulations, 2014 vide registration number
INH000000164. Angel or its associates has not been debarred/ suspended by SEBI or any other regulatory authority for accessing
/dealing in securities Market. Angel or its associates/analyst has not received any compensation / managed or co-managed public
offering of securities of the company covered by Analyst during the past twelve months.
This document is solely for the personal information of the recipient, and must not be singularly used as the basis of any investment
decision. Nothing in this document should be construed as investment or financial advice. Each recipient of this document should
make such investigations as they deem necessary to arrive at an independent evaluation of an investment in the securities of the
companies referred to in this document (including the merits and risks involved), and should consult their own advisors to determine
the merits and risks of such an investment.
Reports based on technical and derivative analysis center on studying charts of a stock's price movement, outstanding positions and
trading volume, as opposed to focusing on a company's fundamentals and, as such, may not match with a report on a company's
fundamentals. Investors are advised to refer the Fundamental and Technical Research Reports available on our website to evaluate the
contrary view, if any.
The information in this document has been printed on the basis of publicly available information, internal data and other reliable
sources believed to be true, but we do not represent that it is accurate or complete and it should not be relied on as such, as this
document is for general guidance only. Angel Broking Pvt. Limited or any of its affiliates/ group companies shall not be in any way
responsible for any loss or damage that may arise to any person from any inadvertent error in the information contained in this report.
Angel Broking Pvt. Limited has not independently verified all the information contained within this document. Accordingly, we cannot
testify, nor make any representation or warranty, express or implied, to the accuracy, contents or data contained within this document.
While Angel Broking Pvt. Limited endeavors to update on a reasonable basis the information discussed in this material, there may be
regulatory, compliance, or other reasons that prevent us from doing so.
This document is being supplied to you solely for your information, and its contents, information or data may not be reproduced,
redistributed or passed on, directly or indirectly.
Neither Angel Broking Pvt. Limited, nor its directors, employees or affiliates shall be liable for any loss or damage that may arise from
or in connection with the use of this information.
Disclosure of Interest Statement
Rallis India
1. Financial interest of research analyst or Angel or his Associate or his relative
No
2. Ownership of 1% or more of the stock by research analyst or Angel or associates or relatives
No
3. Served as an officer, director or employee of the company covered under Research
No
4. Broking relationship with company covered under Research
No
Ratings (Based on expected returns
Buy (> 15%)
Accumulate (5% to 15%)
Neutral (-5 to 5%)
over 12 months investment period):
Reduce (-5% to -15%)
Sell (< -15)
July 26, 2016
12