1QFY2017 Result Update | Breweries & Distilleries
August 18, 2016
Radico Khaitan
BUY
CMP
`101
Performance Highlights
Target Price
`125
Quarterly Data
Investment Period
12 months
(` cr)
1QFY17 1QFY16
% yoy 4QFY16
% qoq
Revenue
430
417
3.1
378
14.0
Stock Info
EBITDA
56.3
46
21.9
39
45.1
Sector
Breweries & Distilleries
Margin (%)
13.1
11.1
201bp
10.3
281bp
Market Cap (` cr)
1,349
Adj. PAT
22
17
25.2
15
45.7
Net Debt (` cr)
742
Source: Company, Angel Research
Beta
0.8
For 1QFY2017, Radico Khaitan’s results have come in line with our estimates.
52 Week High / Low
131 / 81
The company’s top-line grew by ~3% yoy to `430cr on back of higher sales of
Avg. Daily Volume
67,796
premium products while the bottom-line grew by ~25% yoy to `22cr on the back
Face Value (`)
2
of a strong operating performance and lower taxes.
BSE Sensex
28,005
Top-line grew ~3% yoy: Volume growth during the quarter was of 3.6% yoy
Nifty
8,624
which resulted in the top-line growing by 3% yoy to `430cr (our estimate was of
Reuters Code
RADC.BO
`427cr). The company has consciously shifted its focus in favor of prestige &
Bloomberg Code
RDCK@IN
above products which command better margins, over higher volume mass market
products. Prestige & above brands’ volume grew
~11% yoy while their
Shareholding Pattern (%)
contribution to total IMFL volumes increased from 25.2% in 1QFY2016 to 26.9%
in 1QFY2017.
Promoters
40.5
MF / Banks / Indian Fls
13.3
Despite lower sales, PAT grew by ~25% yoy: On the operating front, the
FII / NRIs / OCBs
21.1
company’s margin improved by 201bp yoy to 13.1%, primarily on account of a
Indian Public / Others
25.1
favorable shift in the product mix from regular to premium products. The
company reported a ~25% yoy rise in its net profit to `21.5cr for the quarter on
the back of a strong operating performance and lower taxes.
Abs. (%)
3m 1yr 3yr
Sensex
9.4
0.7
50.9
Outlook and Valuation:
Going forward, we believe that the company has the potential to perform better
RKL
5.8
15.9
9.5
on the bottom-line front on the back of (a) volume growth (b) higher sales of
premium products (c) anticipation of better price hikes and (d) gradual reduction
in debt which should lead to significant savings in interest costs. Hence, we
3-year price chart
recommend a Buy rating on the stock with a target price of `125.
180
160
Key financials
140
Y/E March (` cr)
FY2015
FY2016
FY2017E
FY2018E
120
100
Net sales
1,488
1,543
1,659
1,802
80
% chg
2.5
3.7
7.5
8.6
60
40
Net profit
68
77
84
98
20
0
% chg
(5.1)
13.7
9.6
16.4
EBITDA margin (%)
11.4
12.6
13.0
13.2
EPS (`)
5.1
5.8
6.3
7.4
Source: Company, Angel Research
P/E (x)
19.9
17.5
15.9
13.7
P/BV (x)
1.6
1.5
1.4
1.3
RoE (%)
8.1
8.5
8.6
9.3
RoCE (%)
7.8
8.8
9.6
10.4
Amarjeet S Maurya
EV/Sales (x)
1.4
1.4
1.2
1.1
022-39357800 Ext: 6831
EV/EBITDA (x)
12.2
10.7
9.5
8.6
Source: Company, Angel Research, Note: CMP as of August 17, 2016
Please refer to important disclosures at the end of this report
1
Radico Khaitan | 1QFY2017 Result Update
Exhibit 1: Quarterly performance
Y/E March (` cr)
1QFY17
1QFY16
% yoy
4QFY16
% qoq
FY2016
FY2015
% chg
Net Sales
430
417
3.1
378
14.0
1,543
1,488
3.7
Consumption of RM
229
226
1.1
183
25.0
721
720
0.1
(% of Sales)
53.1
54.2
48.5
46.7
48.3
Staff Costs
37
31
20.4
34
9.9
131
120
9.6
(% of Sales)
8.6
7.4
8.9
8.5
8.0
Selling & Administrative Exps.
42
41
2.2
65
(35.1)
273
284
(3.8)
(% of Sales)
9.8
9.9
17.2
17.7
19.1
Operating Expense
66
73
(9.3)
57
15.6
224
195
14.7
(% of Sales)
15.4
17.5
15.1
14.5
13.1
Total Expenditure
374
371
0.8
339
10.4
1,348
1,318
2.3
Operating Profit
56
46
21.9
39
45.1
195
170
14.2
OPM (%)
13.1
11.1
10.3
12.6
11.4
Interest
21
21
0.5
23
(7.0)
85
90
(5.8)
Depreciation
10
11
(2.0)
10
1.5
40
38
5.3
Other Income
3.85
9.77
(60.6)
14.77
(73.9)
38
45
(15.2)
PBT
28
24
17.9
20
39.6
108
87
23.6
(% of Sales)
6.6
5.8
5.4
7.0
5.9
Provision for Taxation
7
7
(0.3)
6
23.4
31
19
58.1
(% of PBT)
24.0
28.4
27.2
28.6
22.4
Minority Interest
-
-
-
-
-
-
-
-
Reported PAT
22
17
25.2
15
45.7
77
68
13.7
PATM
5.0
4.1
3.9
5.0
4.5
Source: Company, Angel Research
August 18, 2016
2
Radico Khaitan | 1QFY2017 Result Update
Top-line grew ~3% yoy
Volumes during the quarter grew by 3.6% yoy, which resulted in the top-line
growing by 3% yoy to `430cr (our estimate was of `427cr). The company has
consciously shifted its focus in favor of prestige & above products which command
better margins, over higher volume mass market products. Prestige & above
brands’ volume grew ~11% yoy while their contribution to total IMFL volumes
increased from 25.2% in 1QFY2016 to 26.9% in 1QFY2017.
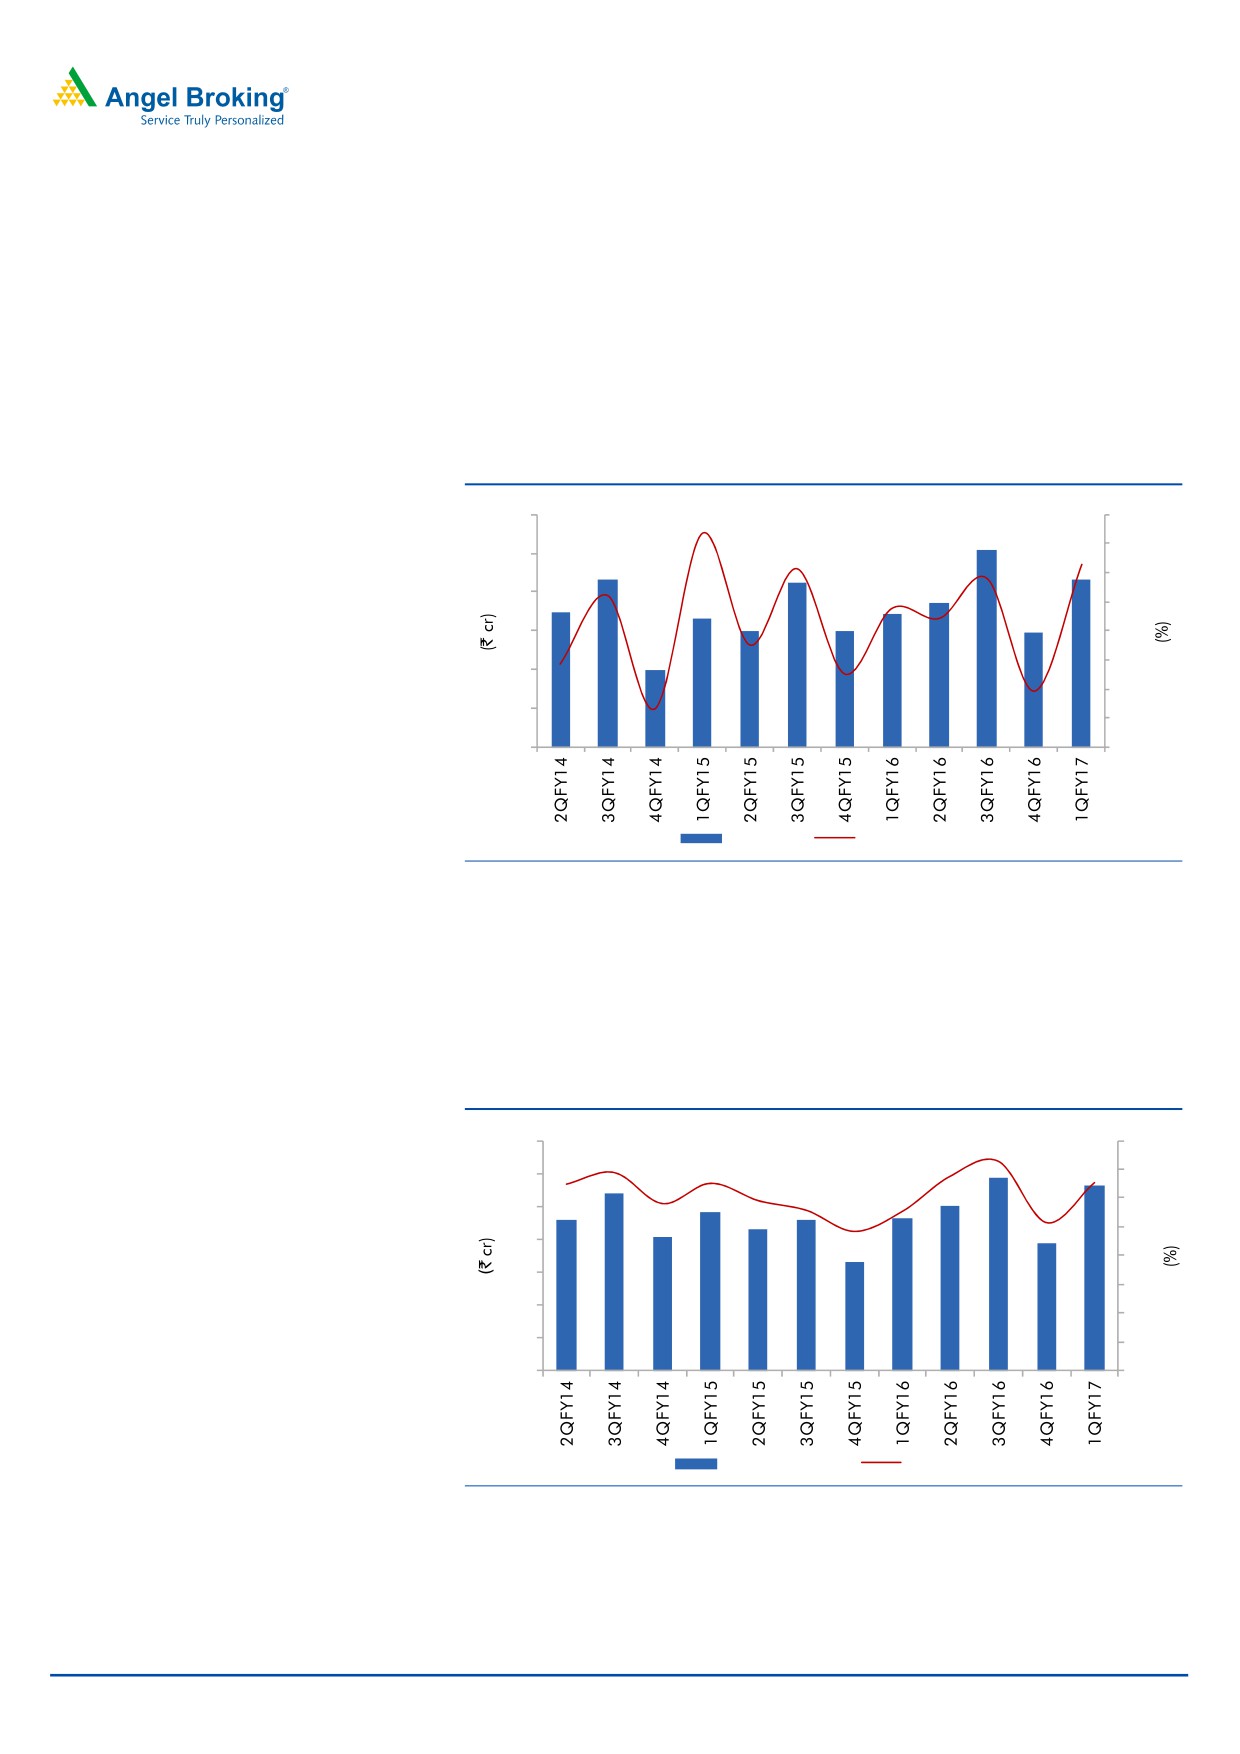
Exhibit 2: Top-line growth trend
30
80
60
25
40
20
20
15
-
(20)
10
(40)
5
(60)
0
(80)
Net Profit
QoQ growth (%)
Source: Company, Angel Research
Strong operating performance
On the operating front, the company’s margin improved by 201bp yoy to 13.1%,
primarily on account of a favorable shift in the product mix from regular to
premium products which command higher margins.
Exhibit 3: Operating profit and margin trend
70
16
60
14
12
50
10
40
8
30
6
20
4
10
2
0
0
Operating Profit
Margin (%)
Source: Company, Angel Research
August 18, 2016
3
Radico Khaitan | 1QFY2017 Result Update
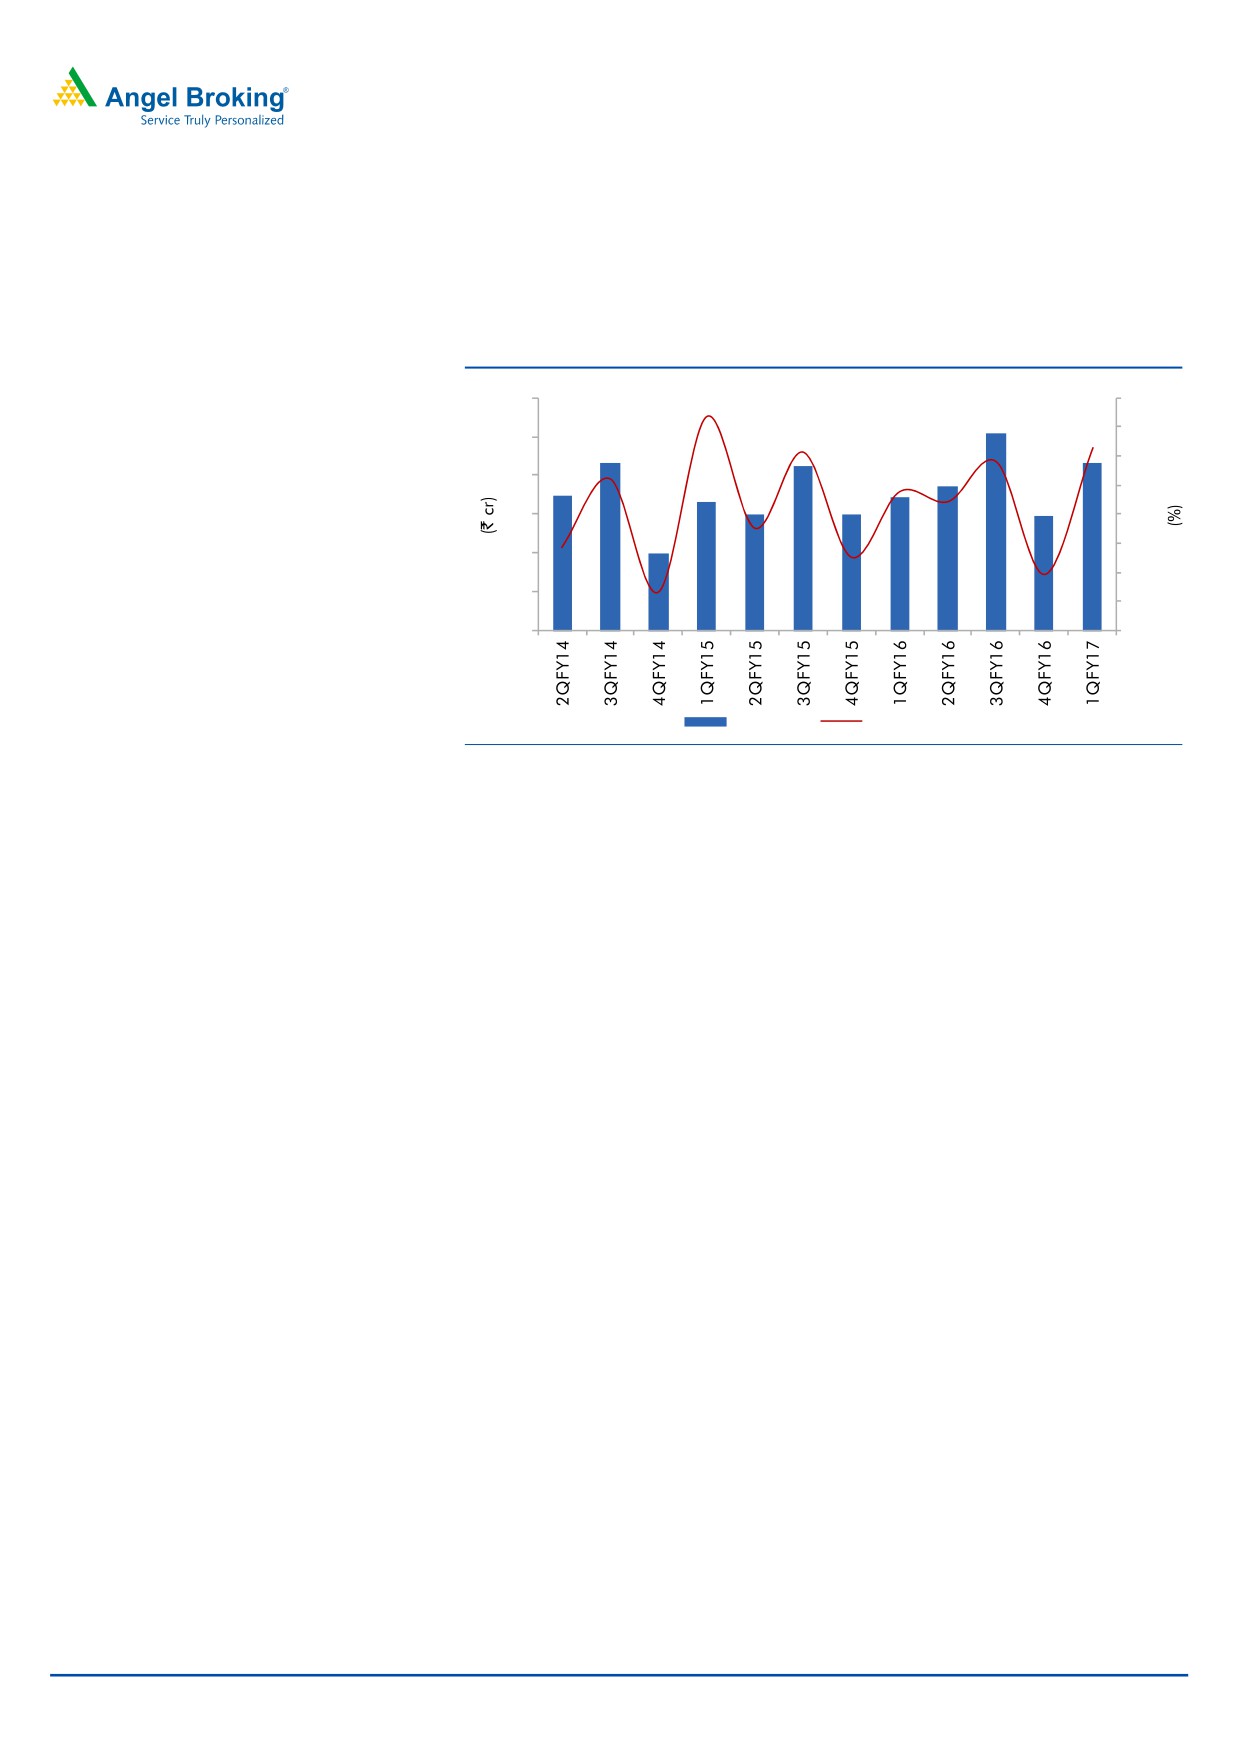
PAT grew by ~25% yoy
The company reported a ~25% yoy rise in its net profit for the quarter to `21.5cr
on the back of a strong operating performance and lower taxes.
Exhibit 4: Net Profit and growth trend
30
80
60
25
40
20
20
15
-
(20)
10
(40)
5
(60)
0
(80)
Net Profit
QoQ growth (%)
Source: Company, Angel Research
August 18, 2016
4
Radico Khaitan | 1QFY2017 Result Update
Investment rationale
Pricing environment expected to be favorable for IMFL industry
Our interaction with liquor companies suggests that prices have now bottomed out.
We expect the industry’s pricing environment to likely get better going ahead
mainly because there has not been any significant price hike in products in recent
times due to delay in approval by various state governments. Hence, the industry is
now expecting a significant price hike in the coming financial year. Also, the
industry leader United Spirits has been facing pressure at the operating level and
the company has a huge debt on its balance sheet. Hence we believe that the
company’s new Management would shift focus on profitability over volume growth,
which in turn, would lead to increased scope for other liquor companies to hike
prices.
Higher proportion of premium products in volume mix to drive
profitability
In the IMFL segment, more than 20% of the company’s volumes come from
prestige and above products, which is a high margin business, and the balance
volumes come from regular and others brands. Since the last eight years, the
company’s prestige and above brands’ volume has reported a CAGR of ~23%
and their share in the product mix has increased from 7.9% in FY2009 to 24% in
FY2016. We expect volume contribution of prestige and above products in the
IMFL segment to increase further on back of higher ad spend. The company has
roped in celebrity Hrithik Roshan as its brand ambassador. Also, the company’s
presence in the prestige Vodka segment is under penetrated which leaves scope
for growth. Thus, this would improve the overall margin for the company and
result in higher profitability.
Wide distribution network with strong brands
RKL has a strong sales and distribution network with a presence in retail and off-
trade outlets in the relevant segments in different parts of India. Currently, the
company is selling its products through over 45,000 retail outlets and over 5,000
on-premise outlets. Apart from wholesalers, a total of around 300 employees
divided into four zones, each headed by regional profit centre head, ensure an
adequate on-the-ground sales and distribution presence across the country.
The company has strong brands likes Magic Moments Vodka, Morpheus Brandy,
Verve Vodka, Florence Brandy, After Dark Whisky etc.
August 18, 2016
5
Radico Khaitan | 1QFY2017 Result Update
Outlook and valuation
The company has not performed well in the last two years due to increasing raw
material costs (ENA is a key raw material) and with it not receiving significant price
hikes from various states. We expect the company to perform well going forward in
anticipation of better price hikes and healthy sales growth in premium products.
This would result in an overall improvement in the operating margin of the
company. We expect the company to report strong earnings CAGR of ~13% to
~`98cr over FY2016-18E. Hence, we recommend a Buy rating on the stock with a
target price of `125.
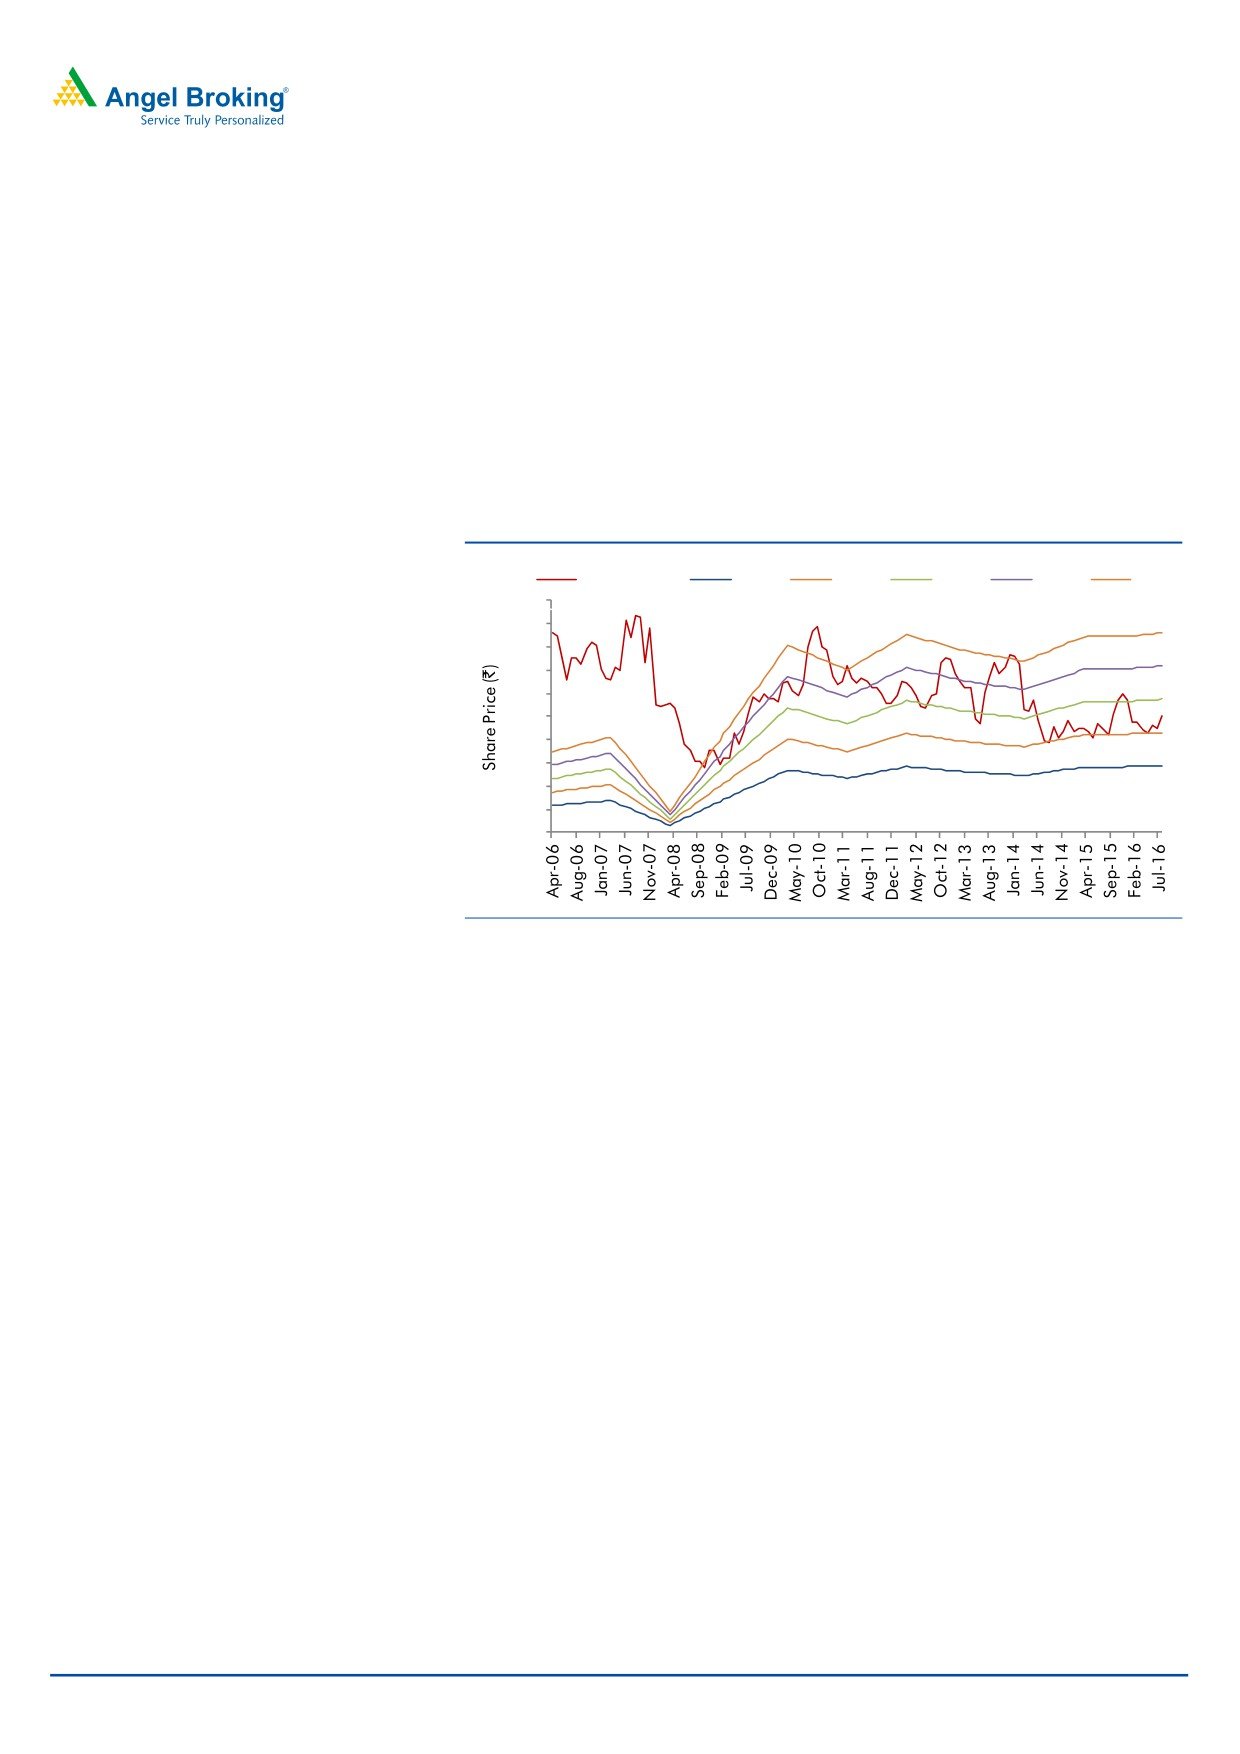
Exhibit 5: One-year forward P/E band
Share Price
10x
15x
20x
25x
30x
200
180
160
140
120
100
80
60
40
20
0
Source: Company, Angel Research
Company Background
Radico Khaitan Ltd is an India-based spirits company engaged in the manufacture
of liquor. The company has three distilleries and one JV with total capacity of
150mn litres and 33 bottling units spread across the country. The company is one
of the largest providers of branded IMFL to the Canteen Stores Department (CSD),
which has significant entry barriers. RKL's brands include After Dark Whisky, Magic
Moments Vodka, Morpheus Brandy, Contessa Rum, Old Admiral Brandy and 8
PM. Its liquor business also includes rectified spirit and country liquor. Its alcohol
products include rectified spirit, silent spirit, cane juice spirit, malt spirit, grain spirit
and ethanol. The company’s PET division produces a range of PET bottles and jars
for industries such as pharmaceutical, cosmetics, home and personal care, edible
oil and confectionery.
August 18, 2016
6
Radico Khaitan | 1QFY2017 Result Update
Profit & Loss Statement
Y/E March (` cr)
FY2013
FY2014
FY2015
FY2016
FY2017E
FY2018E
Total operating income
1,258
1,452
1,488
1,543
1,659
1,802
% chg
10.0
15.4
2.5
3.7
7.5
8.6
Total Expenditure
1,074
1,258
1,318
1,348
1,443
1,564
Raw Material Cost
585
653
717
721
771
834
Personnel Expenses
79
93
107
131
129
141
Selling & Administrative Exp.
235
286
284
273
290
315
Others Expenses
176
226
210
224
252
274
EBITDA
184
193
170
195
216
238
% chg
17.7
5.0
(11.9)
14.2
11.0
10.3
(% of Net Sales)
14.6
13.3
11.4
12.6
13.0
13.2
Depreciation& Amortisation
35
39
38
40
43
45
EBIT
149
155
132
154
173
194
% chg
20.4
3.9
(14.6)
16.8
12.3
11.7
(% of Net Sales)
11.8
10.7
8.9
10.0
10.4
10.7
Interest & other Charges
70
85
90
85
89
89
Other Income
30
36
45
38
40
40
(% of PBT)
27.8
34.3
51.6
35.4
32.3
27.7
Share in profit of Associates
-
-
-
-
-
-
Recurring PBT
109
106
87
108
124
144
% chg
25.7
(2.6)
(18.1)
23.6
15.1
16.4
Prior Period & Extra. Exp./(Inc.)
-
-
-
-
-
-
PBT (reported)
109
106
87
108
124
144
Tax
32
35
19
31
40
46
(% of PBT)
29.3
33.0
22.4
28.6
32.0
32.0
PAT (reported)
77
71
68
77
84
98
% chg
21.4
(7.8)
(5.1)
13.7
9.6
16.4
(% of Net Sales)
6.1
4.9
4.5
5.0
5.1
5.4
Basic EPS (`)
5.8
5.4
5.1
5.8
6.3
7.4
Fully Diluted EPS (`)
5.8
5.4
5.1
5.8
6.3
7.4
% chg
21.2
(7.9)
(5.1)
13.7
9.6
16.4
August 18, 2016
7
Radico Khaitan | 1QFY2017 Result Update
Balance Sheet
Y/E March (` cr)
FY2013
FY2014
FY2015
FY2016
FY2017E FY2018E
SOURCES OF FUNDS
Equity Share Capital
27
27
27
27
27
27
Reserves& Surplus
702
754
812
877
949
1,032
Shareholders Funds
728
781
839
904
976
1,059
Total Loans
768
904
849
851
830
810
Deferred Tax Liability
70
85
85
85
85
85
Total Liabilities
1,566
1,770
1,773
1,840
1,890
1,954
APPLICATION OF FUNDS
Gross Block
744
821
831
851
871
891
Less: Acc. Depreciation
214
250
288
329
371
416
Net Block
529
571
542
522
499
475
Capital Work-in-Progress
5
8
8
8
8
8
Investments
109
108
98
98
98
98
Current Assets
1,161
1,330
1,379
1,471
1,560
1,684
Inventories
186
211
212
220
232
252
Sundry Debtors
435
523
538
562
604
657
Cash
16
15
10
11
14
15
Loans & Advances
314
441
470
492
518
562
Other Assets
209
139
149
185
192
198
Current liabilities
249
262
270
274
290
326
Net Current Assets
912
1,067
1,109
1,197
1,270
1,358
Deferred Tax Asset
11
15
15
15
15
15
Mis. Exp. not written off
-
-
-
-
-
-
Total Assets
1,566
1,770
1,773
1,840
1,890
1,954
August 18, 2016
8
Radico Khaitan | 1QFY2017 Result Update
Cashflow Statement
Y/E March (` cr)
FY2013
FY2014
FY2015
FY2016
FY2017E FY2018E
Profit before tax
109
106
87
108
124
144
Depreciation
35
39
38
40
43
45
Change in Working Capital
(242)
(53)
(47)
(87)
(70)
(87)
Interest / Dividend (Net)
42
50
90
85
89
89
Direct taxes paid
(23)
(26)
(19)
(31)
(40)
(46)
Others
13
22
-
-
-
-
Cash Flow from Operations
(66)
137
149
115
146
145
(Inc.)/ Dec. in Fixed Assets
48
(141)
11
(20)
(20)
(20)
(Inc.)/ Dec. in Investments
(3)
(0)
(10)
-
-
-
Cash Flow from Investing
46
(141)
0.2
(20)
(20)
(20)
Issue of Equity
1
1
-
-
-
-
Inc./(Dec.) in loans
97
99
(55)
2
(21)
(20)
Dividend Paid (Incl. Tax)
(12)
(12)
(10)
(12)
(13)
(15)
Interest / Dividend (Net)
(71)
(84)
(90)
(85)
(89)
(89)
Cash Flow from Financing
15
3
(154)
(94)
(123)
(124)
Inc./(Dec.) in Cash
(5)
(1)
(5)
1
2
1
Opening Cash balances
21
16
15
10
11
14
Closing Cash balances
16
15
10
11
14
15
August 18, 2016
9
Radico Khaitan | 1QFY2017 Result Update
Key Ratios
Y/E March
FY2013
FY2014
FY2015
FY2016
FY2017E FY2018E
Valuation Ratio (x)
P/E (on FDEPS)
17.4
18.9
19.9
17.5
15.9
13.7
P/CEPS
11.9
12.2
12.7
11.5
10.6
9.4
P/BV
1.8
1.7
1.6
1.5
1.4
1.3
Dividend yield (%)
0.8
0.8
0.8
0.9
0.9
1.1
EV/Sales
1.6
1.5
1.4
1.4
1.2
1.1
EV/EBITDA
10.8
11.0
12.2
10.7
9.5
8.6
EV / Total Assets
1.1
1.0
1.0
1.0
0.9
0.9
Per Share Data (`)
EPS (Basic)
5.8
5.4
5.1
5.8
6.3
7.4
EPS (fully diluted)
5.8
5.4
5.1
5.8
6.3
7.4
Cash EPS
8.5
8.3
8.0
8.8
9.5
10.7
DPS
0.8
0.8
0.8
0.9
1.0
1.1
Book Value
54.8
58.7
63.0
67.9
73.3
79.6
Returns (%)
ROCE
10.0
9.2
7.8
8.8
9.6
10.4
Angel ROIC (Pre-tax)
10.9
9.9
8.4
9.4
10.2
11.0
ROE
10.6
9.1
8.1
8.5
8.6
9.3
Turnover ratios (x)
Asset Turnover (Gross Block)
2.4
2.5
2.7
3.0
3.3
3.8
Inventory / Sales (days)
54
53
52
52
51
51
Receivables (days)
126
132
132
133
133
133
Payables (days)
36
33
33
32
31
31
WC cycle (ex-cash) (days)
144
152
151
153
153
153
August 18, 2016
10
Radico Khaitan | 1QFY2017 Result Update
Research Team Tel: 022 - 39357800
DISCLAIMER
Angel Broking Private Limited (hereinafter referred to as “Angel”) is a registered Member of National Stock Exchange of India Limited,
Bombay Stock Exchange Limited and Metropolitan Stock Exchange Limited. It is also registered as a Depository Participant with CDSL
and Portfolio Manager with SEBI. It also has registration with AMFI as a Mutual Fund Distributor. Angel Broking Private Limited is a
registered entity with SEBI for Research Analyst in terms of SEBI (Research Analyst) Regulations, 2014 vide registration number
INH000000164. Angel or its associates has not been debarred/ suspended by SEBI or any other regulatory authority for accessing
/dealing in securities Market. Angel or its associates/analyst has not received any compensation / managed or co-managed public
offering of securities of the company covered by Analyst during the past twelve months.
This document is solely for the personal information of the recipient, and must not be singularly used as the basis of any investment
decision. Nothing in this document should be construed as investment or financial advice. Each recipient of this document should
make such investigations as they deem necessary to arrive at an independent evaluation of an investment in the securities of the
companies referred to in this document (including the merits and risks involved), and should consult their own advisors to determine
the merits and risks of such an investment.
Reports based on technical and derivative analysis center on studying charts of a stock's price movement, outstanding positions and
trading volume, as opposed to focusing on a company's fundamentals and, as such, may not match with a report on a company's
fundamentals. Investors are advised to refer the Fundamental and Technical Research Reports available on our website to evaluate the
contrary view, if any.
The information in this document has been printed on the basis of publicly available information, internal data and other reliable
sources believed to be true, but we do not represent that it is accurate or complete and it should not be relied on as such, as this
document is for general guidance only. Angel Broking Pvt. Limited or any of its affiliates/ group companies shall not be in any way
responsible for any loss or damage that may arise to any person from any inadvertent error in the information contained in this report.
Angel Broking Pvt. Limited has not independently verified all the information contained within this document. Accordingly, we cannot
testify, nor make any representation or warranty, express or implied, to the accuracy, contents or data contained within this document.
While Angel Broking Pvt. Limited endeavors to update on a reasonable basis the information discussed in this material, there may be
regulatory, compliance, or other reasons that prevent us from doing so.
This document is being supplied to you solely for your information, and its contents, information or data may not be reproduced,
redistributed or passed on, directly or indirectly.
Neither Angel Broking Pvt. Limited, nor its directors, employees or affiliates shall be liable for any loss or damage that may arise from
or in connection with the use of this information.
Disclosure of Interest Statement
Radico Khaitan
1. Financial interest of research analyst or Angel or his Associate or his relative
No
2. Ownership of 1% or more of the stock by research analyst or Angel or associates or relatives
No
3. Served as an officer, director or employee of the company covered under Research
No
4. Broking relationship with company covered under Research
No
Ratings (Based on expected returns
Buy (> 15%)
Accumulate (5% to 15%)
Neutral (-5 to 5%)
over 12 months investment period):
Reduce (-5% to -15%)
Sell (< -15)
August 18, 2016
11