Initiating Coverage| Bank
August 31, 2016
RBL Bank
ACCUMULATE
CMP
`300
Strong Management at the helm of affairs
Target Price
`325
Strong management team & focused approach to drive growth: The new
Investment Period
12 Months
Management led by MD & CEO Mr Vishwavir Ahuja which took charge in 2010
has been instrumental in the outstanding growth of the bank over the years,
Stock Info
wherein the bank transformed itself from being a traditional bank to a new age
bank. RBL has been largely focusing on funding working capital to large and mid-
Sector
Banking
sized corporates. It has recently ventured into retail lending by buying out the
Market Cap (` cr)
11,063
credit card business of Royal Bank of Scotland (RBS) and has been expanding its
Beta
retail business by introducing other new retail-centric products.
52 Week High / Low
305 / 274
Avg. Daily Volume
NA
Expect 33% CAGR in loan book over FY2016-18: Over FY2012-16, RBL has
Face Value (`)
10
expanded its loan book at a CAGR of 50%. With increasing size of its balance
BSE Sensex
28,400
sheet, we believe it will still be able to grow at a CAGR of ~33% over FY2016-18.
Nifty
8,750
Large and mid-sized corporates form
39% and
21% of the loan book,
Reuters Code
RATB.NS
respectively; while retail and the high yielding MFI segment account for 17% and
Bloomberg Code
RBK.IN
15% of the book. We expect strong growth from all the segments going ahead.
Growth without a compromise in asset quality is likely to be the business mantra:
While the new Management has been aggressive in growth, it has also put in
Shareholding Pattern (%)
place an efficient risk management system which has led to GNPAs being
Foreign Bodies
39
contained below 1% in the last four years. For FY2016, GNPAs at 0.98% and
Domestic Bodies
24
NNPAs at 0.59% are very much comparable to that of new age private sector
banks. Avoiding loans to long gestation projects has helped the bank in
Individuals
34
maintaining superior asset quality and we believe the same is sustainable
Others
3
provided it continues to maintain a conservative approach towards the segment.
Note: Listed on August 31, 2016; Share holding
pettern as per offer documents
Reduction in cost/income (C/I) & improvement in CASA should be ROE accretive:
A 2x rise in branches and 3x rise in employee count over the past few years have
kept the cost structure high for the bank. Front loading of investments resulted in
C/I going upto 70% in FY14, which is down to 58% in FY16, we see further scope
for cost rationalization. Also, the bank’s CASA base at ~18.5% is still low and we
see that improving to 22% by FY18 end. While we have not factored in major
improvement in NIM, there is scope for that in the years to come. ROE is expected
to see a 200bp improvement over FY2018, backed by lower cost structure and
increasing fee income.
Outlook & Valuations: Currently the stock is valued at 2.3x its FY2018E BV of
`130; this we feel is quite attractive given the growth prospects of the bank.
Changing business mix & stable credit cost are expected to lead to a predictable
earnings growth. While the ROE improvement could be gradual, we believe
absolute growth in earnings could accelerate going ahead. RBL in our view has all
the ingredients to become a multi-year growth story with a stable asset quality.
Keeping this in mind we feel the stock should be valued at 2.5x its FY2018E BV.
We recommend ACCUMULATE on the stock with a target price of `325.
Key Financials (Standalone)
Y/E March (` cr)
FY2014
FY2015
FY2016
FY2017E
FY2018E
NII
342
556
819
1,125
1,455
% chg
32.6
62.9
47.2
37.3
29.4
Net profit
93
207
296
460
592
% chg
0
124
43
55
29
NIM (%)
2.2
2.5
2.5
2.6
2.6
EPS (`)
3.4
7.1
9.1
12.7
16.4
P/E (x)
32.9
23.6
18.3
P/ABV (x)
3.3
2.6
2.3
Siddharth Purohit
RoA (%)
0.6
0.9
0.9
1.0
1.0
022 - 3935 7800 Ext: 6872
RoE (%)
5.3
10.1
11.4
12.8
13.3
Source: Company, Angel Research; Note: CMP as of August 31, 2016
Please refer to important disclosures at the end of this report
1
RBL Bank | Initiating Coverage
Investment rationale
Strong management team & Focused approach to drive growth: RBL has been
growing largely on its concerted focus of funding working capital needs of large
and mid-sized corporates. Over the past five years, while a large portion of growth
has been accounted by the corporate loan segment, the bank intends to gradually
reduce its dependence on the segment. Although, corporate would still form a
large part of the loan book, there lies enough scope for the bank to expand into
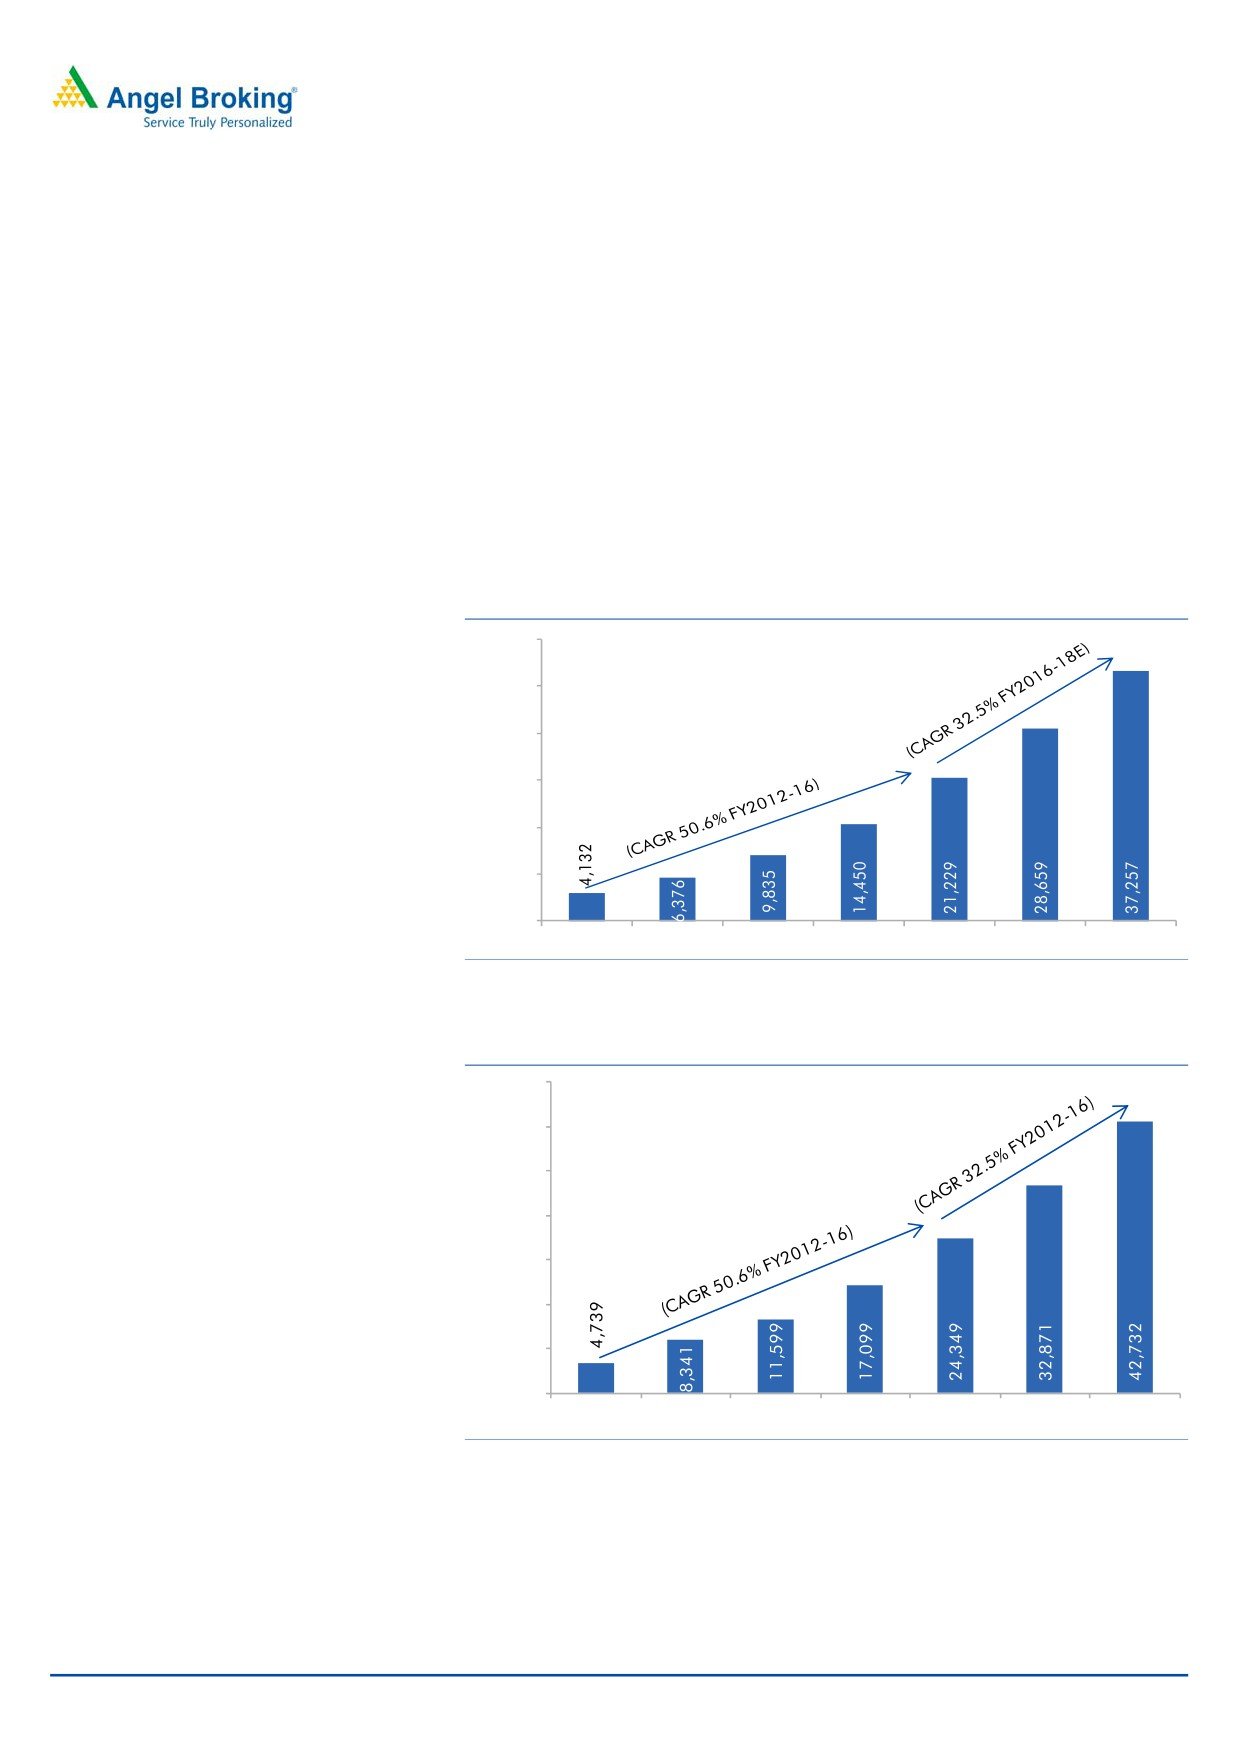
other products. Over FY12-16, RBL has expanded its loan book at a CAGR of
50%; despite a higher base, we believe it will still be able to grow at ~33% CAGR
over FY2016-18. Large and mid-sized corporates form ~39% & 21% of the loan
book, respectively; while retail, a new area of business for the bank accounting for
17% of the book, too is expected to report strong growth.
Exhibit 1: Advances Growth
42,000
35,000
28,000
21,000
14,000
7 ,000
0
FY12
FY13
FY14
FY15
FY16
FY17E
FY18E
Source: Company, Angel Research
Exhibit 2: Deposit Growth
49,000
42,000
35,000
28,000
21,000
14,000
7,000
-
FY12
FY13
FY14
FY15
FY16
FY17E
FY18E
Source: Company, Angel Research
August 31, 2016
2
RBL Bank | Initiating Coverage
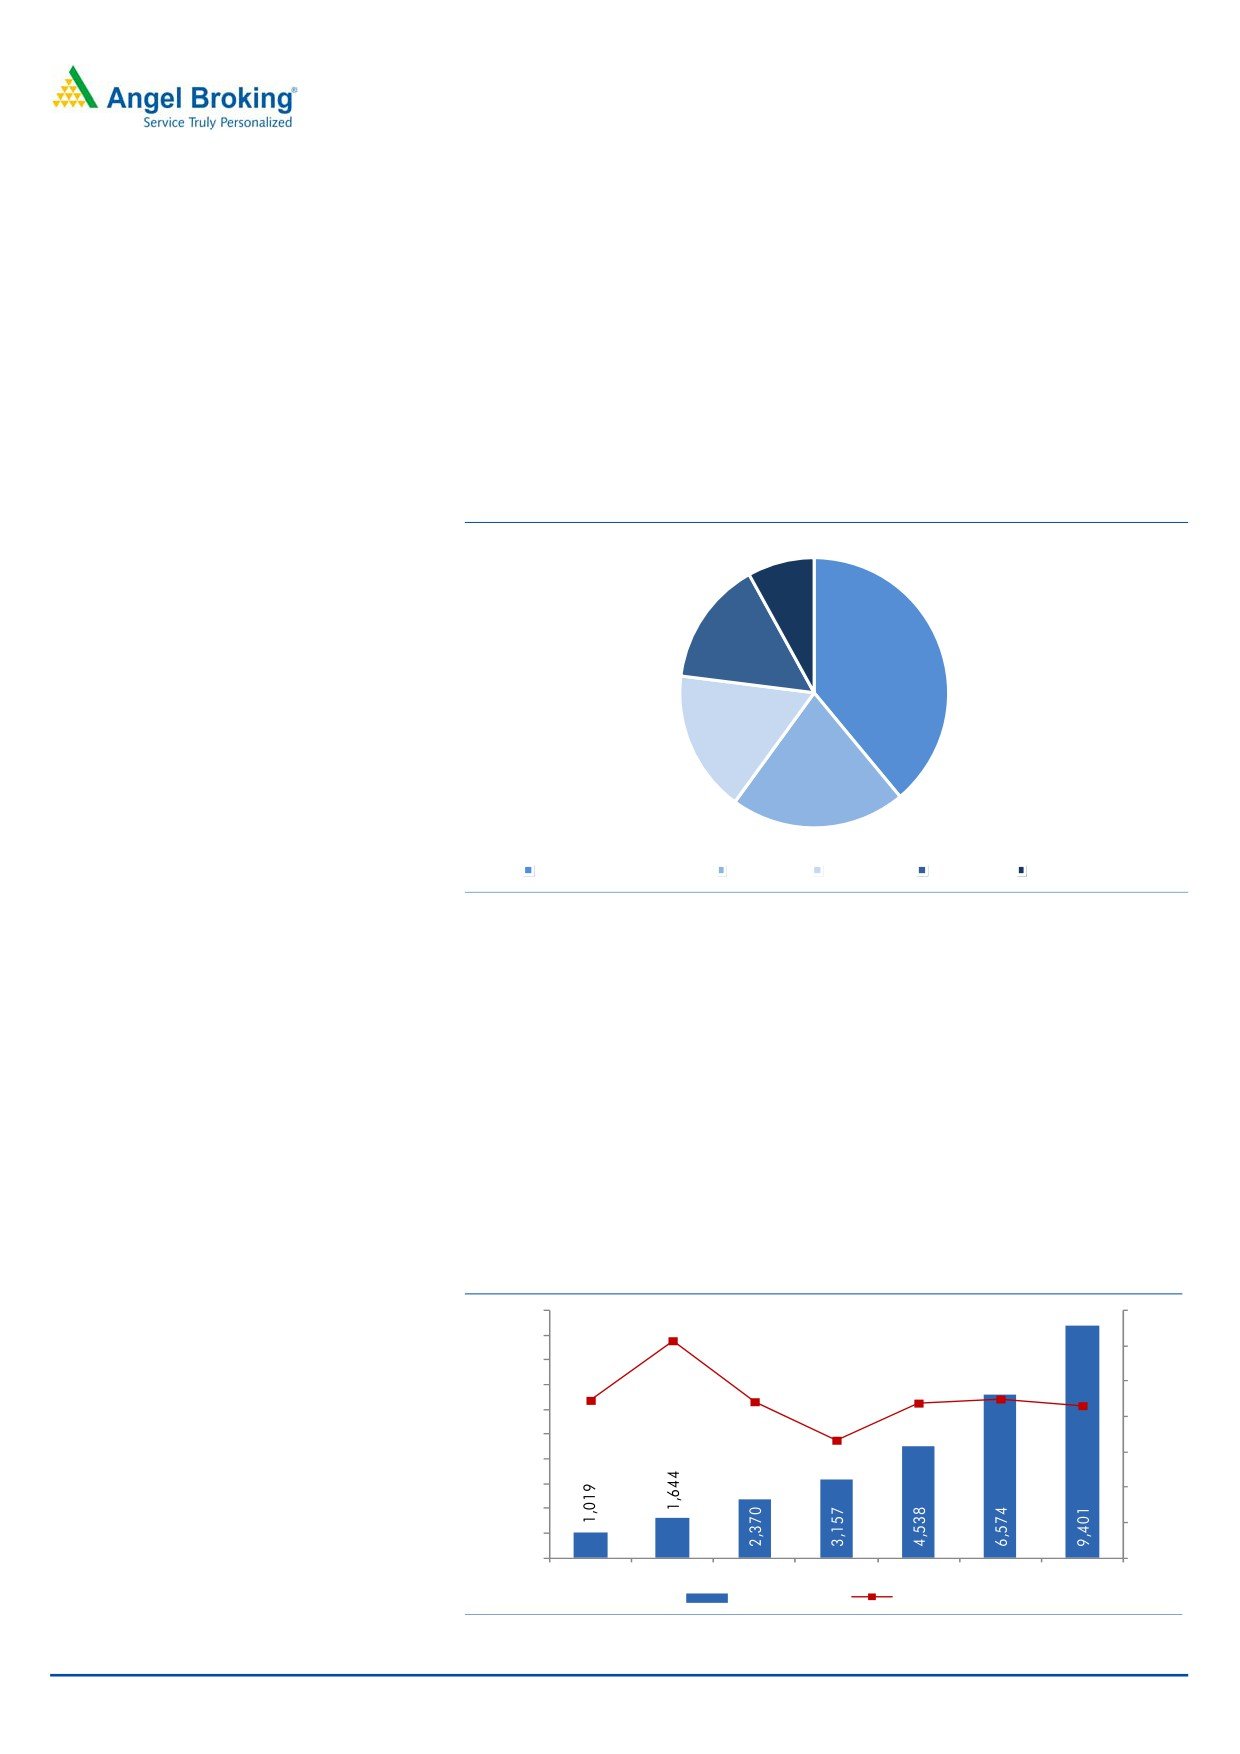
RBL bought over the credit card business of RBS and has been expanding its retail
focus with the introduction of other new retail products. The microfinance segment
accounts for 15% of the bank’s book (~`3133cr), half of which is in the form of
direct loans to micro borrowers, while the balance is through lending to micro
finance companies. Despite it being traditionally perceived to be a risky segment,
the bank has been accruing a very high yield on micro finance disbursals so far,
thereby reflecting the Management’s ability in maintaining asset quality firm; going
forward as well we don’t expect material stress to arise from this segment. The
bank works through business correspondent for the MFI segment and hence has a
strong control over the asset quality.
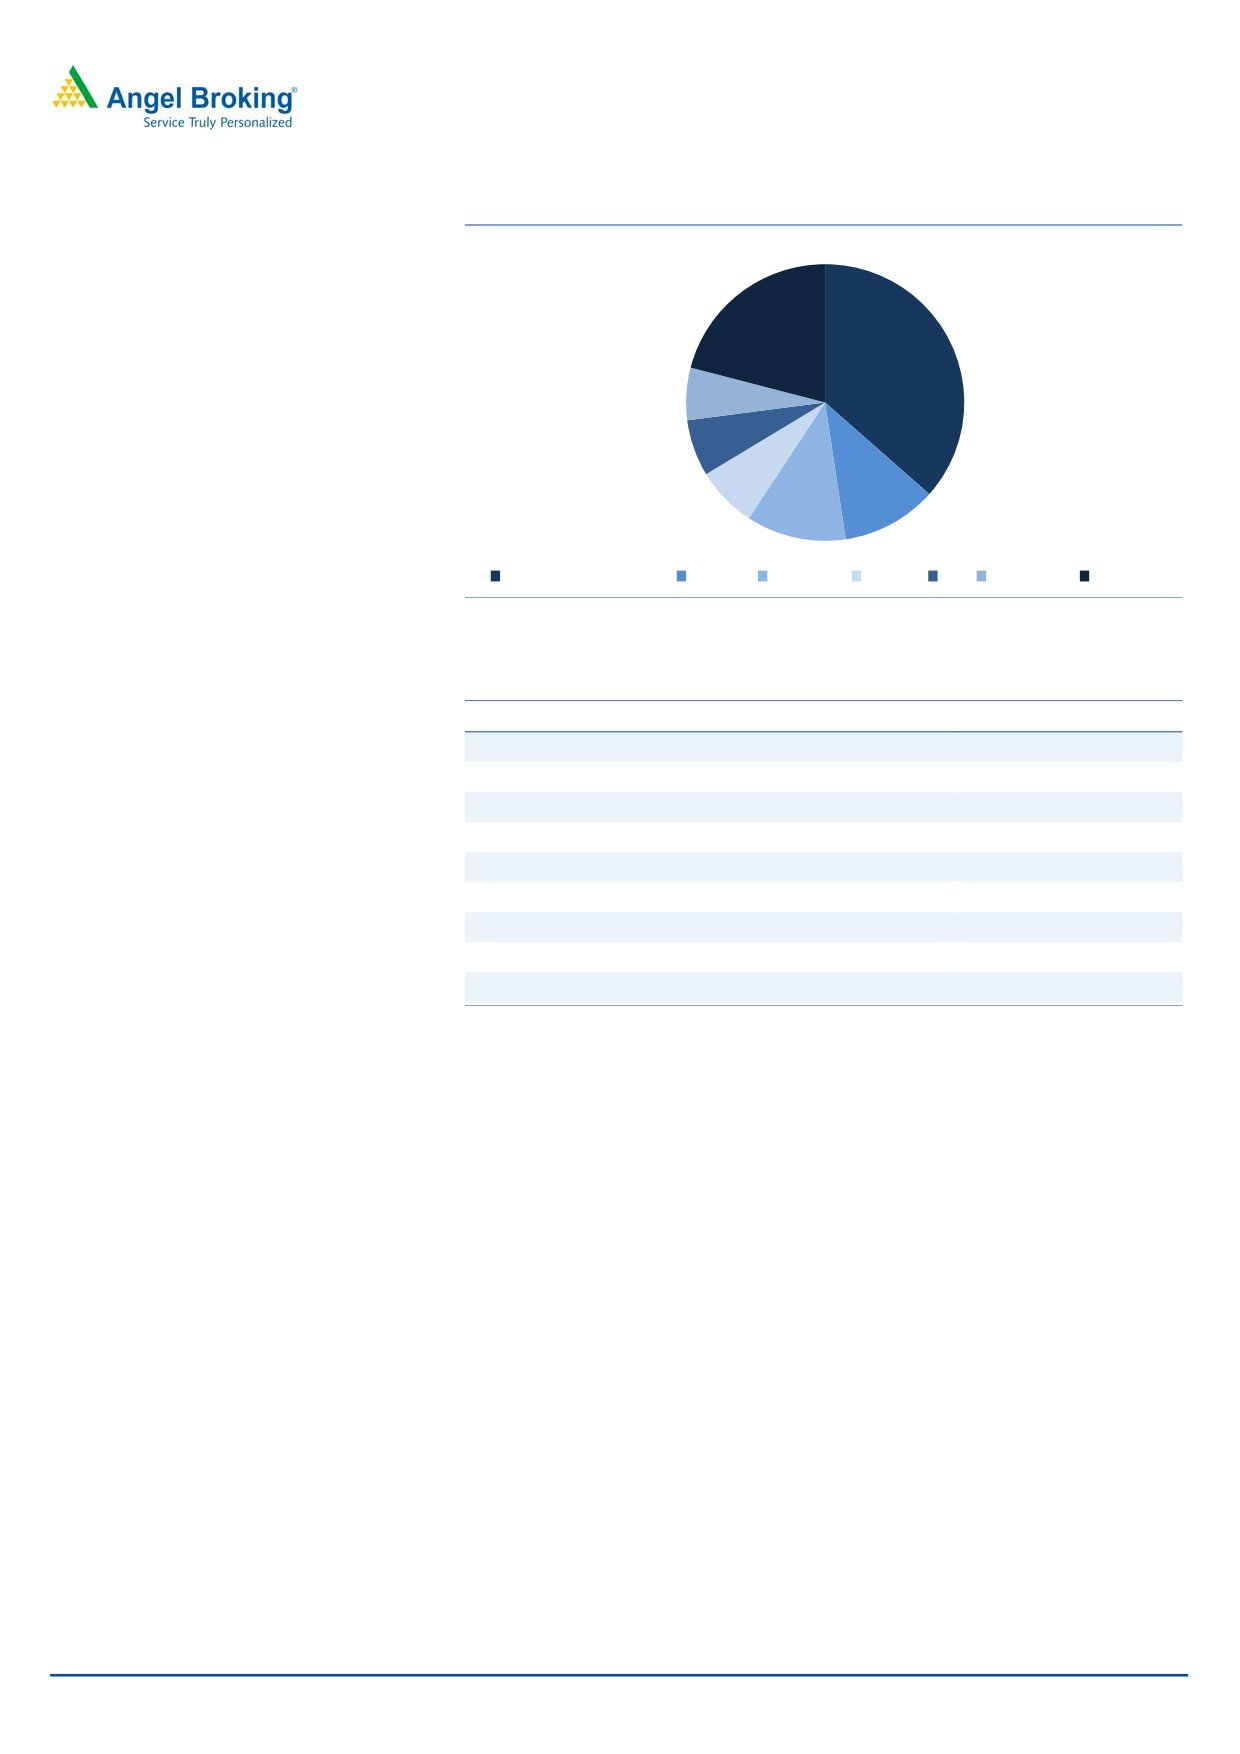
Exhibit 3: Loan Book composition
8%
15%
39%
17%
21%
Large Corporates
SME
Retail
MFIs
Agribusiness
Source: Company, Angel Research
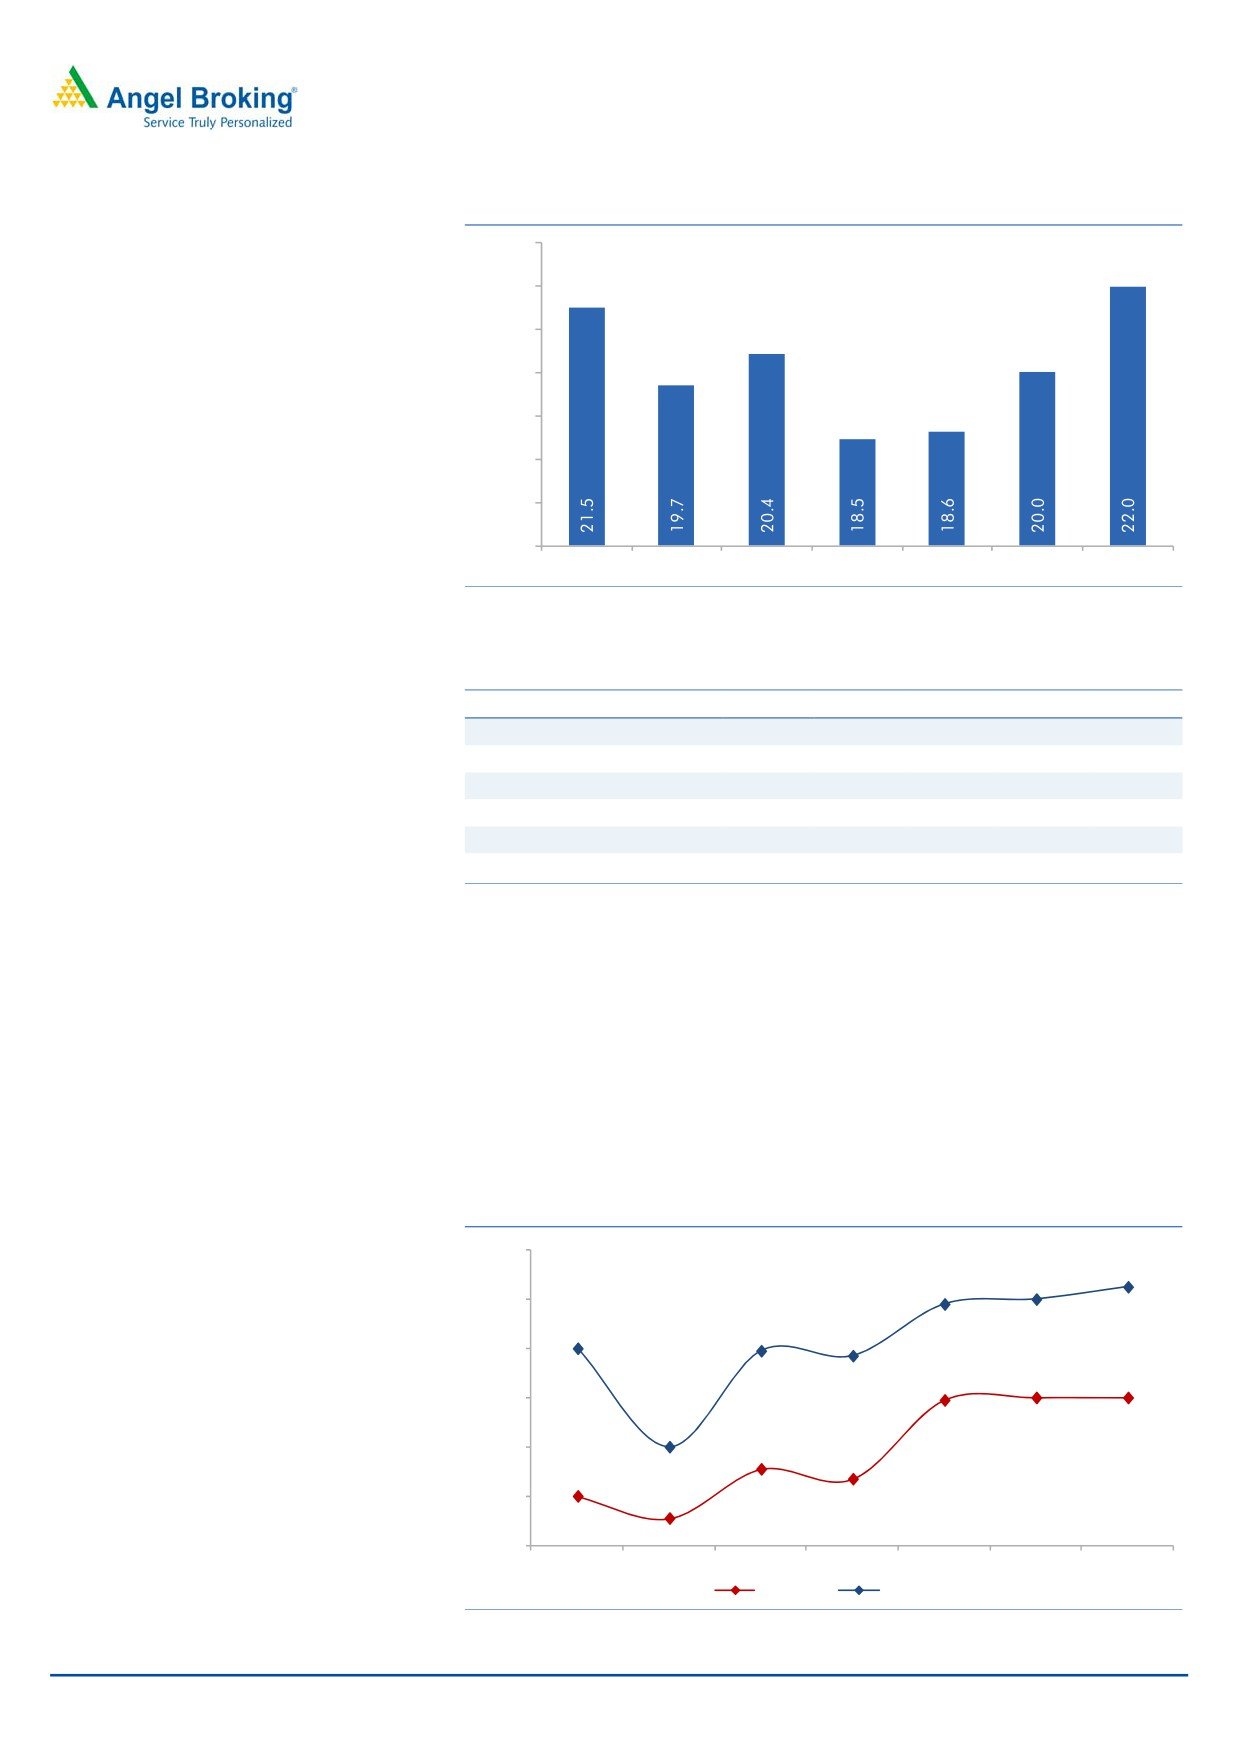
CASA ratio still low but there lies scope for improvement: RBL has a low CASA
base of ~18.5%, but in absolute terms it has been growing at a CAGR of ~45% in
the past few years. It has been observed with many private sector banks that CASA
tends to improve with maturity of business. Going forward, expansion in RBL’s
branch network should enable it to garner low cost deposits, while adoption of
technology and attractive rate loan offerings should also play a role in increasing
the CASA base. We expect RBL to be able to scale up its CASA, albeit at a slower
pace than other private sector banks. Thus, we have factored in
150bp
improvement in CASA ratio for FY2017 and FY2018 each and estimate the CASA
base to reach ~22% by FY2018 end.
Exhibit 4: CASA growth to remain strong
10,000
70.0
61.3
9 ,000
60.0
8 ,000
7 ,000
44.5
44.1
43.7
44.9
50.0
6 ,000
43.0
40.0
33.2
5 ,000
30.0
4 ,000
3 ,000
20.0
2 ,000
10.0
1 ,000
-
0 .0
FY12
FY13
FY14
FY15
FY16
FY17E
FY18E
CASA (` cr)
Growth YoY (%)
Source: Company, Angel Research
August 31, 2016
3
RBL Bank | Initiating Coverage
Exhibit 5: CASA ratio trend
23.0
22.0
21.0
20.0
19.0
18.0
17.0
16.0
FY12
FY13
FY14
FY15
FY16
FY17E
FY18E
Source: Company, Angel Research
Exhibit 6: RBL’s CASA vis-a-vis peers
FY12
FY13
FY14
FY15
FY16
RBL Bank
22.0
20.0
20.0
18.0
19.0
Karur Vysya Bank
19.0
19.0
21.0
22.0
23.3
Federal Bank
27.4
27.2
31.2
30.5
32.5
IndusInd Bank
27.3
29.3
32.5
34.1
35.2
Yes Bank
15.0
18.9
22.0
23.1
28.1
Kotak Mahindra Bank
32.0
29.0
32.0
36.0
38.0
Source: Company, Angel Research;
Strong asset quality despite aggressive growth: Though the new Management has
been aggressive in expanding the loan book, it has been able to adopt an efficient
risk management practice and hence NPAs has been consistently contained below
1% in the last four years. For FY2016 the GNPAs and NNPAs stood at 0.98% and
0.59%, respectively. The bank has a persistent focus of expanding its loan book
and we don’t expect any material deterioration in its asset quality going forward as
well. We expect RBL will be able to maintain slippages ratio of ~1% and credit cost
of 60 bps going ahead.
Exhibit 7: GNPAs and NNPAs trend
1.20
1.05
1.00
0.98
1.00
0.80
0.79
0.77
0.80
0.59
0.60
0.60
0.60
0.40
0.40
0.31
0.27
0.20
0.20
0.11
-
FY12
FY13
FY14
FY15
FY16
FY17E
FY18E
NPA (%)
GNPA (%)
Source: Company, Angel Research
August 31, 2016
4
RBL Bank | Initiating Coverage
Exhibit 8: Comparative Asset Quality
FY16
GNPAs % NNPAs % PCR % Slippages %
Credit Cost %
RBL
0.98
0.59
55.9
1.38
0.54
KVB
1.30
0.55
82.5
3.14
0.83
Federal Bank
2.84
1.65
72.0
3.6
1.21
IndusInd
0.90
0.40
58.6
1.09
0.76
Yes bank
0.76
0.29
62.0
0.93
0.55
Kotak bank
2.40
1.10
63.7
2.42
0.77
Source: Company, Angel Research
Enough scope to bring down cost/income ratio: RBL’s new Management has
brought in fresh talent from other private sector banks and also invested heavily in
technology, along with expansion in the branch network. The bank’s branches
have doubled from 100 to 201 in the past five years, while the number of
employees has also increased by 3x over the same period. This resulted in the
C/I going up to 70% as in FY2014 from 55% in FY2012; for FY2016 it stood at
58%. With the bank now positioned to avail to economies of scale post the
aggressive expansion, we believe there is enough scope for improvement in the
cost structure, which in turn should add to the bottom-line.
Exhibit 9: Cost/Income Ratio (%)
75.0
70.3
70.0
65.0
62.5
59.2
60.0
58.3
54.8
53.48
53.70
55.0
50.0
FY12
FY13
FY14
FY15
FY16
FY17E
FY18E
Source: Company, Angel Research
August 31, 2016
5
RBL Bank | Initiating Coverage
Exhibit 10: Cost/Asset Ratio (%)
3.1
2.9
2.9
2.7
2.5
2.3
2.2
2.3
2.1
1.9
1.9
1.9
1.9
1.8
1.7
1.5
FY12
FY13
FY14
FY15
FY16
FY17E
FY18E
Source: Company, Angel Research
Exhibit 11: Comparable Cost/Income to peer banks
Cost to Income %
FY11
FY12
FY13
FY14
FY15
FY16
RBL Bank
83.1
54.8
59.2
70.3
62.5
58.3
Karur Vysya Bank
41.8
42.7
47.3
54.7
53.9
50.3
Federal Bank
36.9
39.4
44.7
47.6
50.0
56.7
IndusInd Bank
48.2
49.4
48.8
45.7
46.8
47.0
Yes Bank
36.3
37.7
38.4
39.4
41.3
40.9
Kotak Mahindra Bank
54.0
52.6
50.6
49.7
52.1
57.5
Source: Company, Angel Research
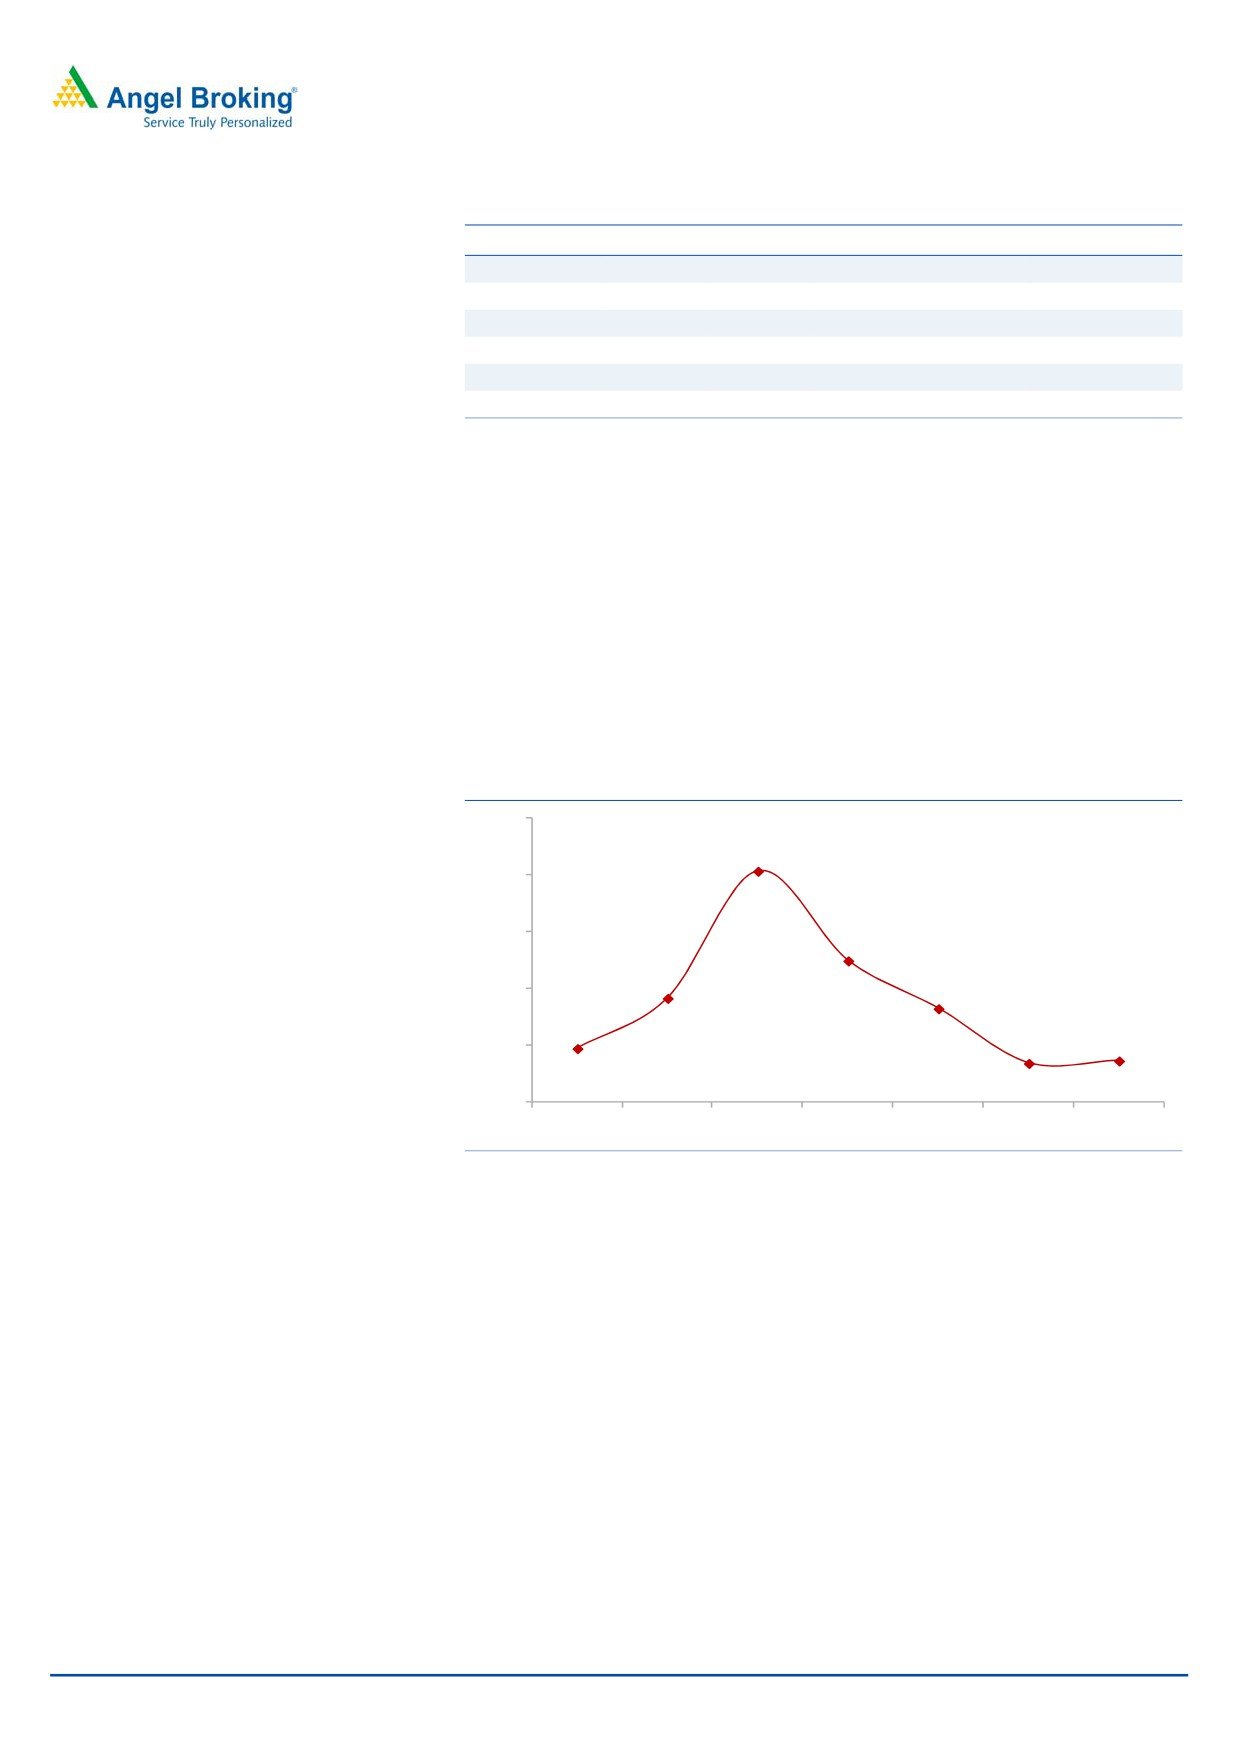
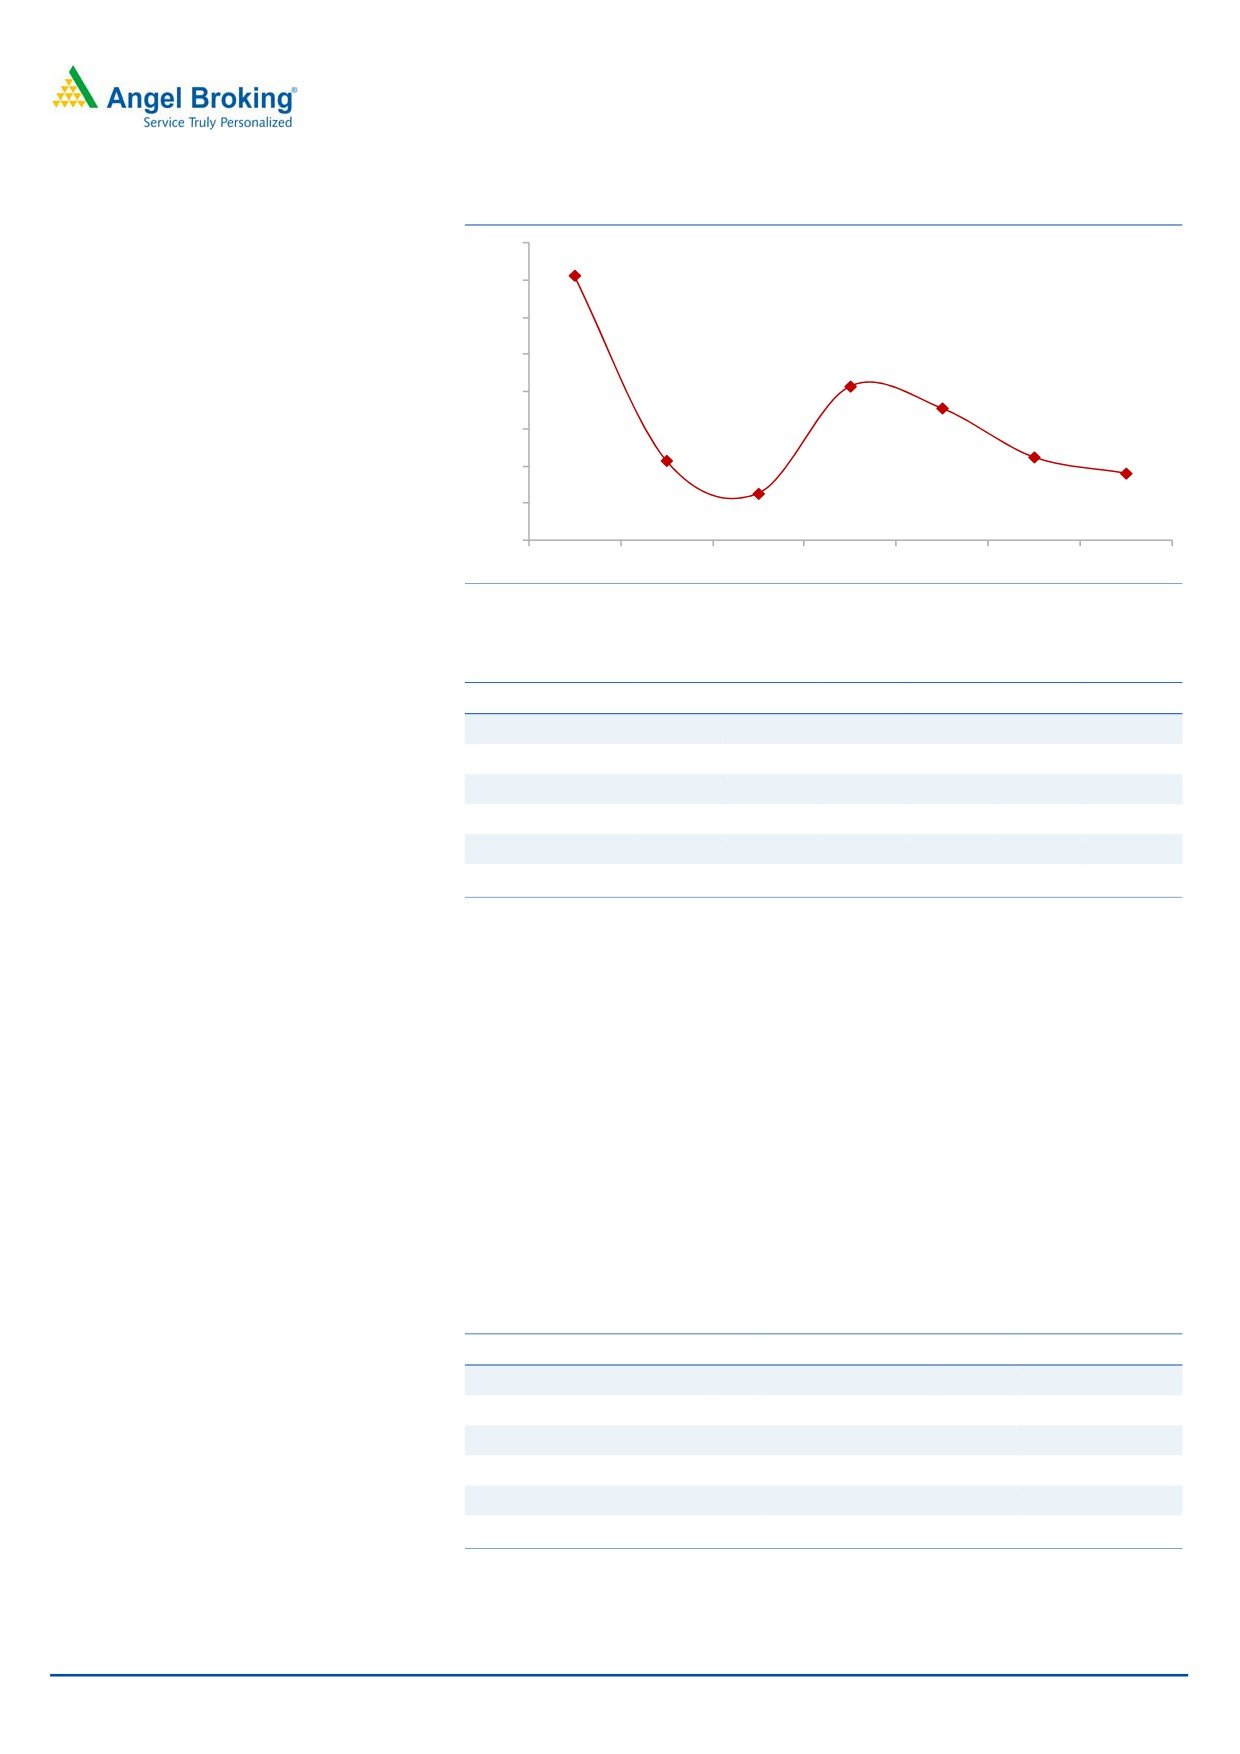
See scope for NIM improvement going ahead: RBL has reported a
strong 44.7% CAGR in NII over FY2012-16. The yield on advances for the bank at
10.95% is on the higher side compared to other small and mid-sized private
banks, partly due to its aggressive expansion in the retail and microfinance
segment. However, RBL’s cost of deposits is relatively high which could be
attributed to the low CASA base and hence the bank’s NIM has been lower than its
peers. Nevertheless, what gives comfort is the intention and ability of the bank to
gradually bring down the overall funding cost, which we feel should start adding to
the NIM over the next few quarters. While improvement in CASA will be an added
advantage, the banks intention to reduce dependence on bulk deposits also will
help in lowering of cost funds there by adding to NIM.
Exhibit 12: Comparative NIM
Bank
FY11
FY12
FY13
FY14
FY15
FY16
RBL Bank
3.7
3.7
2.6
2.3
2.5
2.5
Karur Vysya Bank
3.4
3.1
3.0
2.6
2.9
3.4
Federal Bank
4.0
3.6
3.1
3.6
3.3
3.3
IndusInd Bank
3.5
3.3
3.4
3.7
3.7
3.9
Yes Bank
2.9
2.8
2.9
2.9
3.2
3.4
Kotak Mahindra Bank
5.2
4.7
4.6
4.9
4.9
4.3
Source: Company, Angel Research
August 31, 2016
6
RBL Bank | Initiating Coverage
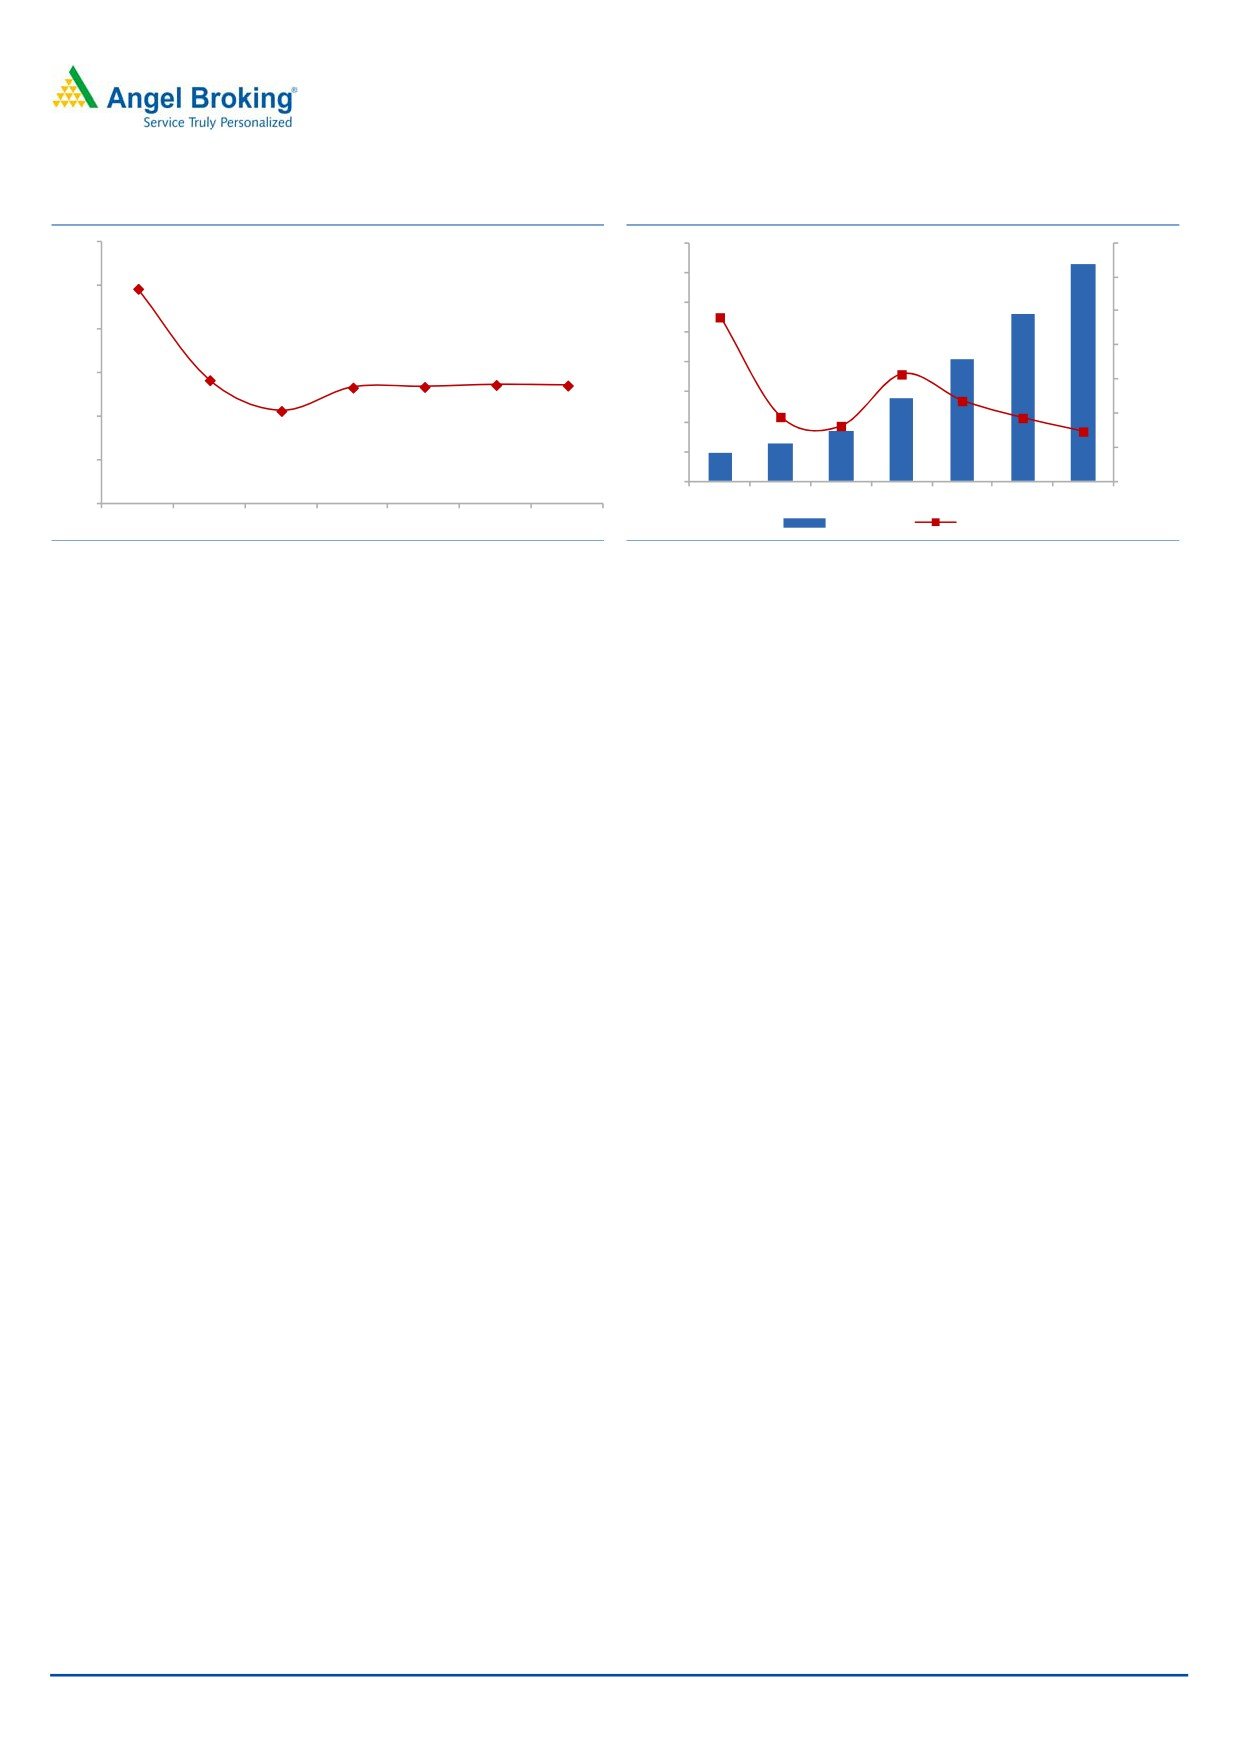
Exhibit 13: NIM likely to remain healthy
Exhibit 14: NII growth trend
4.2
1,600
140.0
1455
3.7
1,400
120.0
3.7
1125
1,200
100.0
96.3
3.2
1,000
819
80.0
2.6
62.9
2.5
2.5
2.6
2.6
800
2.7
60.0
2.3
600
556
37.9
47.2
2.2
342
40.0
400
32.6
37.3
258
187
29.4
200
20.0
1.7
0
-
1.2
FY12
FY13
FY14
FY15
FY16
FY17E FY18E
FY12
FY13
FY14
FY15
FY16
FY17E
FY18E
NII (` cr)
Growth (%)
Source: Company, Angel Research
Source: Company, Angel Research
Fee Income has been one of the key ROA driver for other private banks, RBL can
follow suit: Over the last 5 -8 years, the new generation private sector banks have
seen an improvement in their ROA and ROE profiles, partly on robust growth in
fee income. While RBL has been a late entrant, it too could follow suit to boost up
its return ratios. Fee income as a % of total income for RBL much lower than its
peers, due to the fact that it is still highly dependent on the corporate segment for
growth. However, increasing share of business from retail could push of the fee
income, which can be ROA accretive.
August 31, 2016
7
RBL Bank | Initiating Coverage
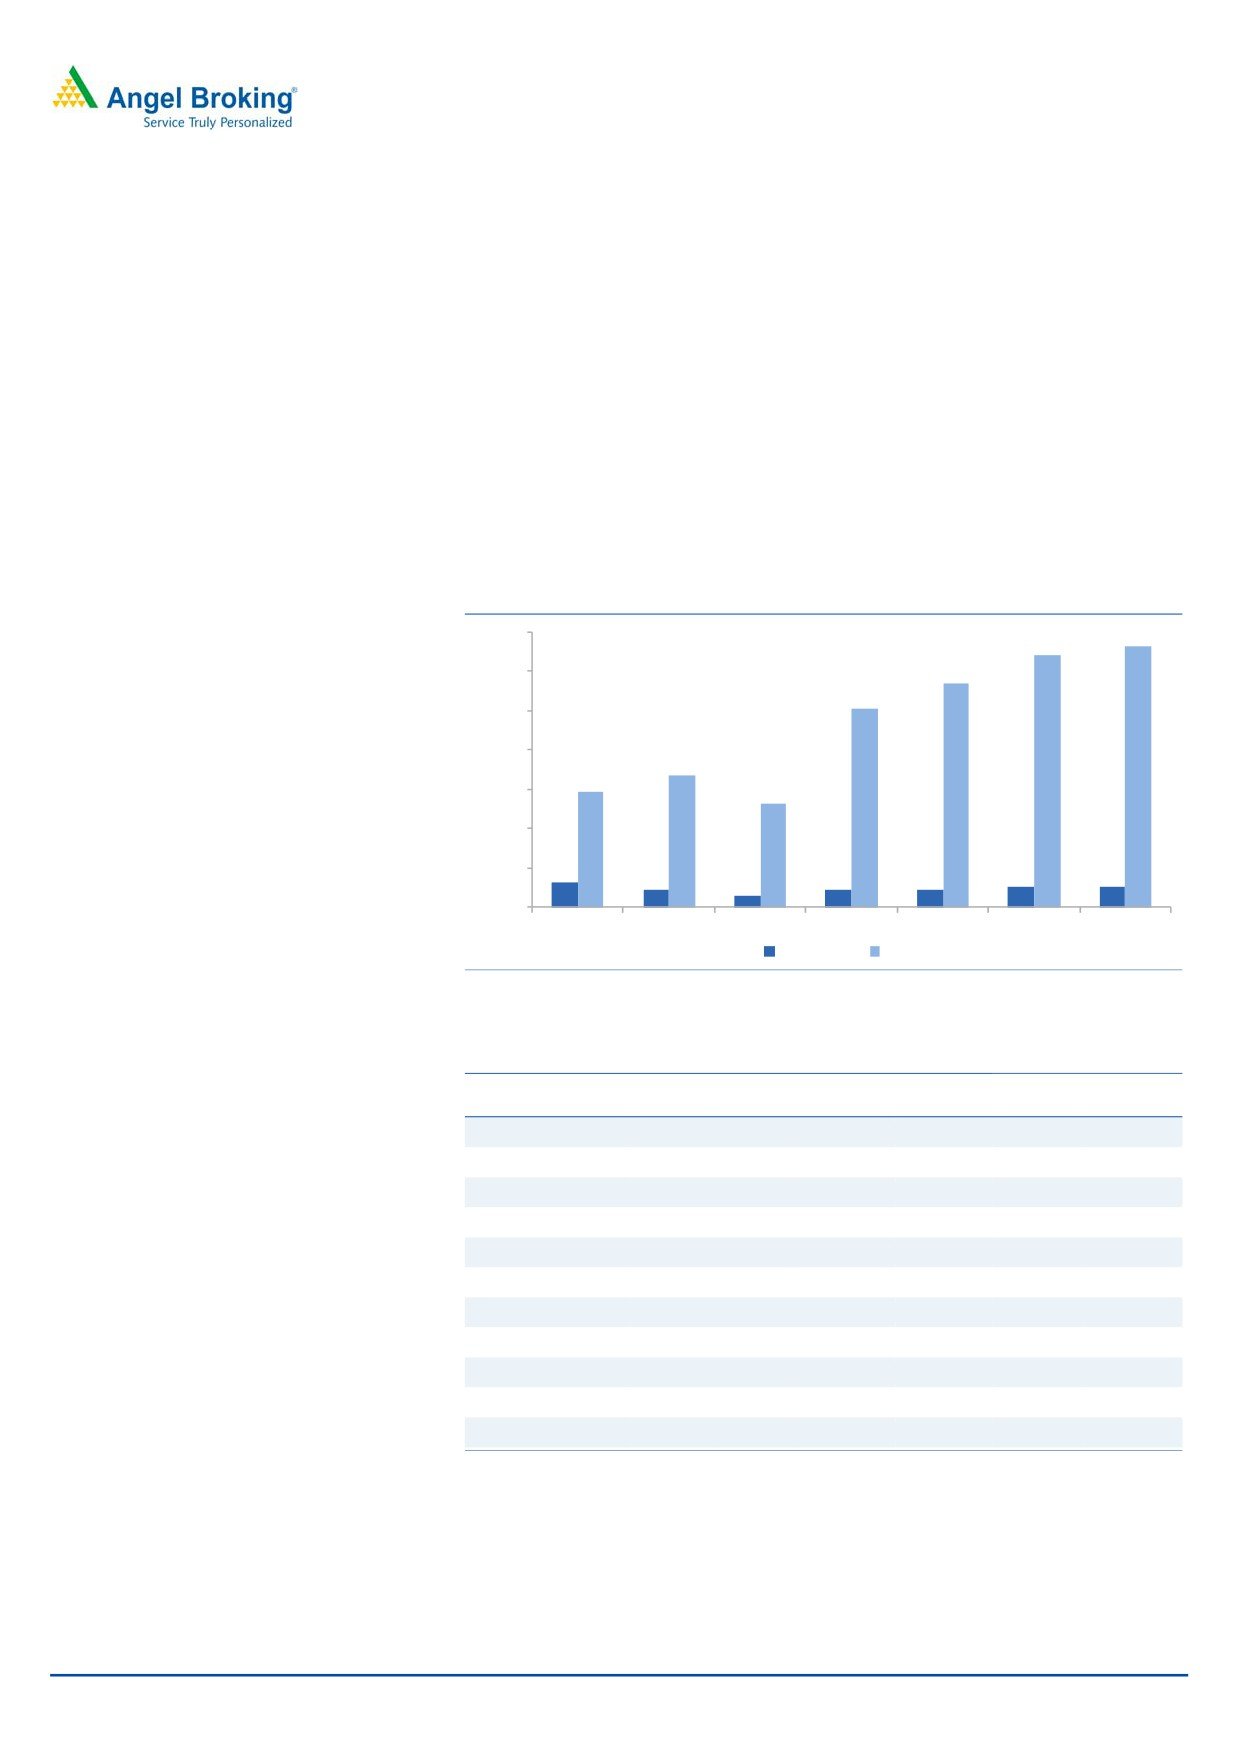
ROE & ROA still at lower end of the curve; there lies scope for improvement: Post
the new Management having taken charge, there has been an aggressive growth
in the bank’s balance sheet as well as earnings. However, large scale investments
in branches and manpower have resulted in subdued ROA and ROE. ROA has
remained below 1% for the last four years while ROE has also lagged business and
earnings growth due to front loading of investments. We believe, adoption of cost
rationalization measures will enable the bank to improve its ROA and ROE by
300bp each over the next two years. However, the ROE of the bank could still lag
behind other new generation private sector banks, as the bank will have to
continue with the legacy branches. Nevertheless, launch of new high yielding retail
loans and simultaneous cost reduction could take RBL’s ROE somewhere near to its
peers over the next four to five years.
Exhibit 15: ROA & ROE Trend
14.0
13.3
12.8
12.0
11.4
10.1
10.0
8.0
6.7
5.9
6.0
5.3
4.0
2.0
1.3
0.9
0.9
0.9
1.0
1.0
0.6
-
FY12
FY13
FY14
FY15
FY16
FY17E
FY18E
ROA (%)
ROE (%)
Source: Company, Angel Research
Exhibit 16: Comparative DuPont
Yes
Kotak
Year End FY15
RBL
KVB
Federal
IndusInd
Bank
Mahindra
Net Interest Income
2.5
3.3
2.9
3.6
3.0
4.6
Non Interest Income
1.5
1.3
0.9
2.6
1.8
1.8
Total Revenues
4.0
4.7
3.8
6.3
4.8
6.4
Operating Cost
2.3
2.3
2.1
2.9
2.0
3.7
PPP
1.7
2.3
1.6
3.3
2.9
2.7
Total Provisions
0.4
0.6
0.8
0.5
0.4
0.6
PBT
1.3
1.7
0.8
2.8
2.5
2.1
Tax
0.4
0.6
0.3
0.9
0.8
0.7
ROA
0.9
1.1
0.5
1.8
1.7
1.4
Leverage
12.7
13.1
10.8
8.8
11.8
7.8
RoE (%)
11.4
13.9
5.9
16.1
19.9
11.0
Source: Company, Angel Research
August 31, 2016
8
RBL Bank | Initiating Coverage
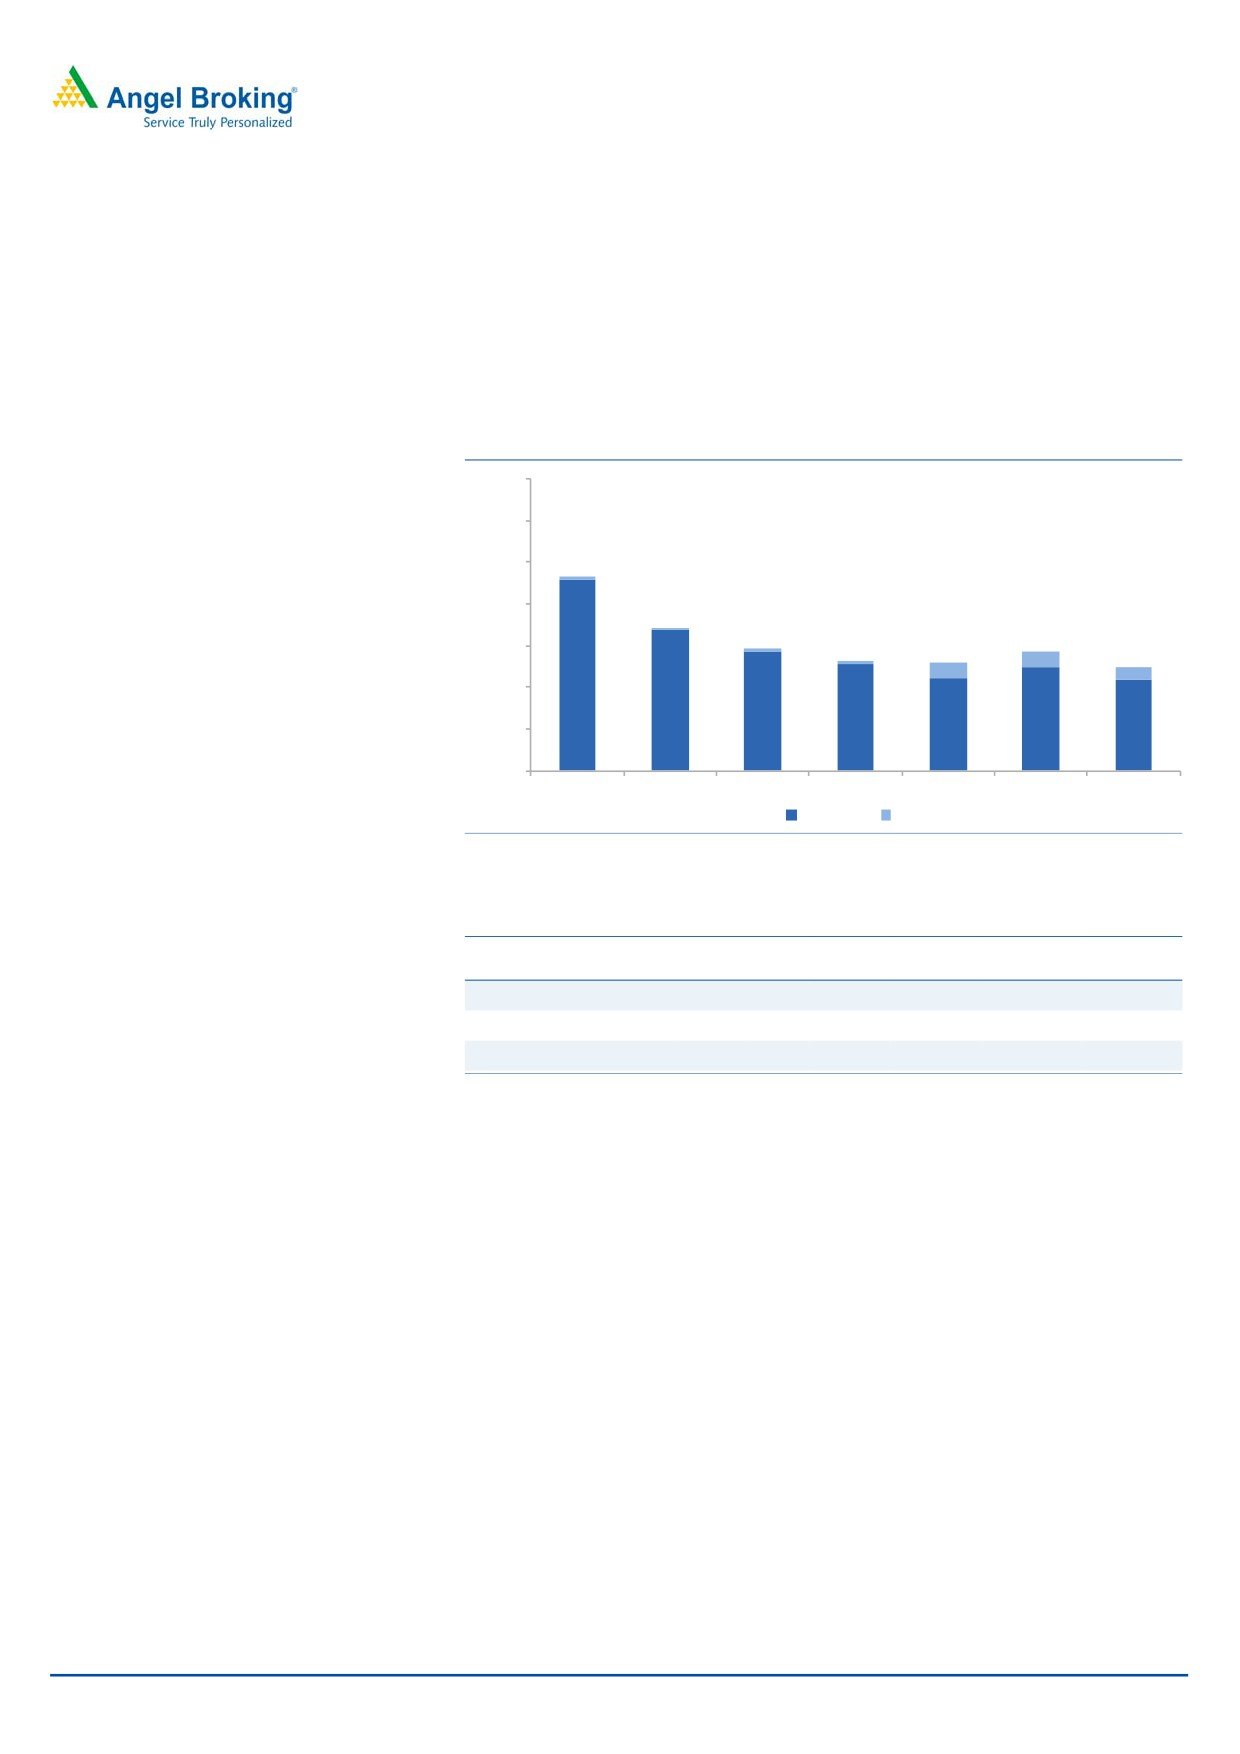
Bank well capitalized post IPO to feed growth: With the bank
aggressively growing its balance sheet in the past few years, the capital adequacy
has come down from 17.1% in FY2013 to 12.9% in FY2016. We believe, the
recent fund raising through the IPO should take care of the bank’s higher capital
requirements to maintain a similar growth rate as in the past few years on a now
higher base. We believe the bank will not need capital for next 18-24 months and
might get into capital raising post that.
Exhibit 17: Capital Adequacy Ratio
35.0
30.0
23.2
25.0
0.4
17.1
20.0
14.6
14.2
12.4
0.3
13.1
12.9
15.0
0.3
0.4
1.7
22.8
1.8
1.6
10.0
16.8
14.3
12.7
12.5
5.0
11.1
10.9
-
FY12
FY13
FY14
FY15
FY16
FY17E
FY18E
TIER1
TIER2
Source: Company, Angel Research
Exhibit 18: Exhibit 22: Comparative CAR
Kotak
(As on 31st March,2016)
RBL KVB Federal IndusInd Yes Bank
Mahindra
CAR %
12.9
12.2
13.9
15.5
16.5
16.3
Tier I
11.1
11.3
13.4
14.9
10.7
15.3
Tier II
1.8
0.9
0.5
0.6
5.8
1.0
Source: Company, Angel Research
Aggressive branch expansion in last five years; large part of the branches still in
Maharashtra alone: During the last five years, the new Management has nearly
doubled the bank’s branch network from 100 to 197. But even now, nearly half of
the bank’s total branches are still located in Maharashtra alone. The bank is
gradually increasing its footprint in other states, but in our opinion, it would be
prudent to continue to focus expansion in Maharashtra and neighboring states like
Karnataka and Gujarat.
August 31, 2016
9
RBL Bank | Initiating Coverage
Exhibit 19: Geographical Mix of Branches (%)
21%
37%
6%
7%
7%
11%
12%
Maharastra (ex-Mumbai)
Mumbai Karnataka
Gujarat
MP Tamil Nadu
Rest of India
Source: Company, Angel Research
Exhibit 20: Branches State Wise
Location
Number Of Branches
Maharastra (ex-Mumbai)
72
Mumbai
22
Karnataka
23
Gujarat
14
MP
13
Tamil Nadu
12
New Delhi
8
Goa
8
Rest of India
25
Source: Company, Angel Research
August 31, 2016
10
RBL Bank | Initiating Coverage
Outlook and valuation
Currently the stock is valued at 2.3x its FY2018E BV of `130; this we feel is quite
attractive given the growth prospects of the bank. Changing business mix & stable
credit cost are expected to lead to a predictable earnings growth. While the ROE
improvement could be gradual, we believe absolute growth in earnings could
accelerate going ahead. RBL in our view has all the ingredients to become a multi-
year growth story with a stable asset quality. Keeping this in mind we feel the stock
should be valued at 2.5x its FY2018E BV. We recommend ACCUMULATE on the
stock with a target price of `325.
Key risks & concerns
The stupendous growth of the bank has been achieved by the new Management
team led by Mr Vishwavir Ahuja. The ability of the bank’s future growth also
largely lies on the strategy laid out by the new Management. Any exit of the key
Management personnel can hamper future growth of the bank. However, the key
Management have been incentivized via ESOPs and hence we feel the risk of
losing them is low at least in the near term.
Company Background
RBL Bank Ltd, the erstwhile Ratnakar Bank Ltd, has a long history in India with
operations since 1943 when the bank was incorporated as a small regional bank
in Maharashtra with two branches in Kolhapur and Sangli. The bank has been in
existence for the last 73 years and it has transformed itself from a traditional bank
into a new age bank in the last six years. While the bank still has its presence
largely in the western part of India and ~50% of the branches are in Maharashtra
(including Mumbai), gradually it has started venturing to other geographies. As of
31st March, 2016 the bank had a network of 197 branches and 362 ATMs and
had a customer base of 1.9mn.
Key Management Personnel
Mr Vishwavir Ahuja-Managing Director & CEO- Mr Ahuja is a well recognized
personality in the banking field in India and he along with other management
team has been one of the prime driving force behind the aggressive growth of RBL.
Previously he was the MD & Country Executive Officer of Bank of America
Mr Rajeev Ahuja -Head- Strategy, Retail, Transaction Banking and Financial
Inclusion- Ahuja was previously associated with Citibank India, Bank of America,
India and Bankers Trust Company.
Mr Naresh Karia is the Chief Financial Officer. Previously he was the Country
Controller of Citibank.N.A, India
August 31, 2016
11
RBL Bank | Initiating Coverage
Comparative table
Within the listed space, we believe RBL Bank can be compared to the old
generation south based Pvt Banks. However, looking at the aggressive growth it
has embarked upon it can also be compared to the new generation small and
midsized pvt sector banks. We believe it will be able to attract valuations in
between the old generation and new generation small Pvt Banks. Further rerating
will be a function of ROE improvement going ahead.
Exhibit 21: Comparative Analysis:
RBL
Federal
IndusInd
Yes
Kotak
Parameters (` Cr)
KVB
Bank
Bank
Bank
Bank
Mahindra Bank
5 Yr NII CAGR %
54
18
7
27
30
25
NII March 2011
95
767
1747
1,376
1,247
2,245
NII March 2016
819
1,781
2,504
4,517
4,567
6,900
5 Yr PAT CAGR %
90
6
(4)
32
28
21
PAT March 2011
12
416
587
577
727
818
PAT March 2016
296
568
476
2,286
2,539
2,090
Source: Company, Angel Research
Exhibit 22: Comparative -Balance sheet
(` Cr)
Loan
Deposits
C/ D Ratio Retail Loans%
CASA%
RBL
21,229
24,349
87.2
17.0
19.0
KVB
39,471
50,079
78.8
15.0
23.3
Federal Bank
58,090
79,172
73.4
29.8
32.5
IndusInd
88,419
93,000
95.1
41.0
35.2
Yes bank
98,210
111,720
87.9
10.8
28.1
Kotak bank
118,665
138,643
85.6
44.3
38.0
Source: Company, Angel Research
Exhibit 23: Comparative - Valuations
P/BV
ROE% ROA% NIM%
Div Yield%
RBL Bank
3.3
11.4
0.9
2.5
0.4
Karur Vysya Bank
1.3
12.4
1.0
3.4
2.9
Federal Bank
1.4
6.0
0.6
3.1
3.4
IndusInd Bank
4.1
16.8
1.9
3.9
0.3
Yes Bank
4.2
19.9
1.7
3.4
0.7
Kotak Mahindra Bank
6.4
8.7
1.2
4.3
0.1
Source: Company, Angel Research; Net Worth Adj for NPAs, and all data has been taken for FY16
end for comparative purpose.
August 31, 2016
12
RBL Bank | Initiating Coverage
Income statement (standalone)
Y/E March (` cr)
FY2014
FY2015
FY2016
FY2017E
FY2018E
NII
342
556
819
1125
1455
- YoY Growth (%)
32.6
62.9
47.2
37.3
29.4
Other Income
261
403
491
659
854
- YoY Growth (%)
106.4
54.6
21.6
34.3
29.7
Operating Income
603
960
1310
1783
2309
- YoY Growth (%)
56.9
59.3
36.5
36.1
29.5
Operating Expenses
424
600
763
954
1240
- YoY Growth (%)
86.5
41.5
27.3
24.9
30.0
Pre - Provision Profit
179
360
546
829
1069
- YoY Growth (%)
14.0
101.5
51.7
51.8
28.9
Prov. & Cont.
46
60
114
172
224
- YoY Growth (%)
104.2
30.3
90.1
50.3
30.0
Profit Before Tax
133
300
432
658
845
- YoY Growth (%)
(1.2)
126.3
44.0
52.2
28.6
Prov. for Taxation
40
93
136
197
254
- as a % of PBT
(4.2)
132.8
46.1
45.6
28.6
PAT
93
207
296
460
592
- YoY Growth (%)
0
124
43
55
29
Balance sheet (standalone)
Y/E March (` cr)
FY2014
FY2015
FY2016
FY2017E
FY2018E
Share Capital
272
293
325
362
362
Reserve & Surplus
1,613
1,937
2,665
3,851
4,354
NetWorth
1,885
2,230
2,989
4,213
4,716
Deposits
11,599
17,099
24,349
32,871
42,732
- YoY Growth (%)
39.1
47.4
42.4
35.0
30.0
Borrowings
3,896
6,963
10,536
12,491
16,238
Other Liab & prov
689
812
1,287
1,644
2,137
Total Liabilities
18,198
27,105
39,161
51,218
65,823
Cash and Bal With RBI
981
1,456
1,340
1,808
2,350
Bal.with Banks
212
715
1,110
1,479
1,923
Investments
6,518
9,792
14,436
17,750
22,648
Advances
9,835
14,450
21,229
28,659
37,257
- Growth (%)
54.2
46.9
46.9
35.0
30.0
Fixed Assets
134
164
177
230
299
Other Assets
518
528
869
1291
1345
Total Assets
18,198
27,105
39,161
51,218
65,823
August 31, 2016
13
RBL Bank | Initiating Coverage
Ratio analysis (standalone)
Y/E March
FY2014
FY2015
FY2016
FY2017E
FY2018E
Profitability ratios (%)
NIMs
2.3
2.5
2.5
2.6
2.6
RoA
0.6
0.9
0.9
1.0
1.0
RoE
5.3
10.1
11.4
12.8
13.3
Asset Quality (%)
Gross NPAs
0.8
0.8
1.0
1.0
1.0
Net NPAs
0.3
0.3
0.6
0.6
0.6
Per Share Data (`)
EPS
3.4
7.1
9.1
12.7
16.4
BV
69.3
76.0
92.1
116.5
130.4
Adj BV
68.2
74.7
88.2
111.6
123.6
Valuation Ratios
PER (x)
32.9
23.6
18.3
P/BVPS (x)
3.3
2.6
2.3
P/ABVPS (x)
3.4
2.7
2.4
Dividend Yield (%)
0.4
1.4
2.4
DuPont Analysis
Net Interest Income
2.2
2.5
2.5
2.5
2.5
Non Interest Income
1.7
1.8
1.5
1.5
1.5
Total Revenues
3.9
4.2
4.0
3.9
3.9
Operating Cost
2.7
2.6
2.3
2.1
2.1
PPP
1.1
1.6
1.6
1.8
1.8
Total Provisions
0.3
0.3
0.3
0.4
0.4
PBT
0.9
1.3
1.3
1.5
1.4
Tax
0.3
0.4
0.4
0.4
0.4
ROA
0.6
0.9
0.9
1.0
1.0
Leverage
8.9
11.0
12.7
12.5
13.1
RoE (%)
5.3
10.1
11.4
12.8
13.3
August 31, 2016
14
RBL Bank | Initiating Coverage
Research Team Tel: 022 - 39357800
DISCLAIMER
Angel Broking Private Limited (hereinafter referred to as “Angel”) is a registered Member of National Stock Exchange of India Limited,
Bombay Stock Exchange Limited and Metropolitan Stock Exchange Limited. It is also registered as a Depository Participant with CDSL
and Portfolio Manager with SEBI. It also has registration with AMFI as a Mutual Fund Distributor. Angel Broking Private Limited is a
registered entity with SEBI for Research Analyst in terms of SEBI (Research Analyst) Regulations, 2014 vide registration number
INH000000164. Angel or its associates has not been debarred/ suspended by SEBI or any other regulatory authority for accessing
/dealing in securities Market. Angel or its associates/analyst has not received any compensation / managed or co-managed public
offering of securities of the company covered by Analyst during the past twelve months.
This document is solely for the personal information of the recipient, and must not be singularly used as the basis of any investment
decision. Nothing in this document should be construed as investment or financial advice. Each recipient of this document should
make such investigations as they deem necessary to arrive at an independent evaluation of an investment in the securities of the
companies referred to in this document (including the merits and risks involved), and should consult their own advisors to determine
the merits and risks of such an investment.
Reports based on technical and derivative analysis center on studying charts of a stock's price movement, outstanding positions and
trading volume, as opposed to focusing on a company's fundamentals and, as such, may not match with a report on a company's
fundamentals. Investors are advised to refer the Fundamental and Technical Research Reports available on our website to evaluate the
contrary view, if any.
The information in this document has been printed on the basis of publicly available information, internal data and other reliable
sources believed to be true, but we do not represent that it is accurate or complete and it should not be relied on as such, as this
document is for general guidance only. Angel Broking Pvt. Limited or any of its affiliates/ group companies shall not be in any way
responsible for any loss or damage that may arise to any person from any inadvertent error in the information contained in this report.
Angel Broking Pvt. Limited has not independently verified all the information contained within this document. Accordingly, we cannot
testify, nor make any representation or warranty, express or implied, to the accuracy, contents or data contained within this document.
While Angel Broking Pvt. Limited endeavors to update on a reasonable basis the information discussed in this material, there may be
regulatory, compliance, or other reasons that prevent us from doing so.
This document is being supplied to you solely for your information, and its contents, information or data may not be reproduced,
redistributed or passed on, directly or indirectly.
Neither Angel Broking Pvt. Limited, nor its directors, employees or affiliates shall be liable for any loss or damage that may arise from
or in connection with the use of this information.
Disclosure of Interest Statement
RBL Bank
1. Financial interest of research analyst or Angel or his Associate or his relative
No
2. Ownership of 1% or more of the stock by research analyst or Angel or associates or relatives
No
3. Served as an officer, director or employee of the company covered under Research
No
4. Broking relationship with company covered under Research
No
Ratings (Based on expected returns
Buy (> 15%)
Accumulate (5% to 15%)
Neutral (-5 to 5%)
over 12 months investment period):
Reduce (-5% to -15%)
Sell (< -15)
August 31, 2016
15