IPO Note | IT
February 6, 2016
Quick Heal Technologies
SUBSCRIBE
Issue Open: February 8, 2016
IPO Note
Issue Close: February 10, 2016
Quick Heal Technologies (QHTL) is a dominant player in the growing Retail IT Security
Issue Details
software market in India with a market share of 30% and an active license user base
of 7.13mn. ~87% of its customers are retail clients while the balance is made up of
Face Value: `10
enterprises and government institutions. The company has laid the foundation in terms
Present Eq. Paid up Capital: `62.2cr
of product development, creating infrastructure for distribution and built a brand to
further grow its overall business.
Fresh Issue**: 0.78cr Shares
Leadership position in growing Retail IT Security market: The Indian IT Security
Offer for sale: 0.63cr Shares
software market is estimated to be at `1,500-1,800cr in 2015, of which, the retail
Post Eq. Paid up Capital: `70cr
market accounts for ~`600-800cr. The retail market has grown from ~`400-600cr in
2013 and is expected to post a CAGR of 20-25% over 2015-17E on the back of
Market Lot: 45 Shares
growing number of internet users. QHTL is best placed to benefit from the growing
Fresh Issue (amount): `250cr
industry on the back of its brand visibility along with its wide distribution reach.
311-321
Price Band: `
Strong distribution network with good brand equity: Despite facing competition from
Post-issue implied mkt. cap `2,186cr*-
international as well as domestic players in India, QHTL has been able to successfully
2,248cr**
grow its business and establish a strong position across India on the back of its 19,000
Note:*at Lower price band and **Upper price band
retail channel partners. QHTL has also built support systems that include mobile,
enterprise and government channel partners. The company has historically spent ~10%
of its top-line on advertisement and is expected to allocate ~`111cr from the IPO
Book Building
proceeds (over three years) to further improve its visibility, which in turn, will aid growth.
QIBs
50%
Debt free with healthy Cash Flow generation for future R&D needs: QHTL has a debt-
Non-Institutional
15%
free balance sheet and cash balance of ~`107cr as of 1HFY2016. Over the past five
years, QHTL is generating strong operating cash flows which have grown from
Retail
35%
~`49cr in FY2012 to ~`77 in FY2015. We believe that the company generates
sufficient cash flows to cover for R&D and technology up-gradation related expenses.
Post Issue Shareholding Pattern(%)
Outlook Valuation: QHTL has shown significant growth over FY2012-15, posting a
revenue CAGR of 16.9% while its profitability has declined from `68cr in FY2012 to
Promoters Group
72.9
`54cr in FY2015 as the company was in an investment phase. Investments were
MF/Banks/Indian
incurred towards new product development for its Enterprise business and brand
FIs/FIIs/Public & Others
27.1
building.
On the valuation front, at the upper end of the price band, the pre-issue P/E works out
to 41.2x its 1HFY2016 annualized earnings which we consider decent taking into
account the company’s brand image. Further, the company is confident of it being
able to sustain its growth trajectory owing to its strong distribution network.
Additionally, there is a two-year lead-lag on product development for the Enterprise
business of which the company will reap benefits in future. Thus, we recommend a
Subscribe on the issue from a longer term perspective.
Key Financial
Y/E March (` cr)
FY2012
FY2013
FY2014
FY2015
1HFY2016
Net Sales
179
205
243
286
148
% chg
-
14.5
18.5
17.8
-
Net Profit
68
77
58
54
24
% chg
-
12.8
(24.1)
(7.8)
-
Amarjeet S Maurya
OPM (%)
53.5
51.3
43.0
32.1
29.7
+91 22 4000 3600 Ext: 6831
EPS (`)
11.0
12.4
9.4
8.6
3.9
P/E (x)
29.3
26.0
34.2
37.1
-
P/BV (x)
9.5
7.0
6.0
6.0
-
RoE (%)
32.4
27.0
17.6
16.2
-
Milan Desai
RoCE (%)
44.5
35.3
28.2
21.6
-
EV/Sales (x)
10.6
9.0
7.6
6.5
-
+91 22 4000 3600 Ext: 6846
EV/EBITDA (x)
19.8
17.6
17.8
20.2
-
Source: Company, Angel Research; Note: Valuation ratios based on pre-issue outstanding shares and at upper end of the price band
Please refer to important disclosures at the end of this report
1
Quick Heal Technologies | IPO Note
Company background
QHTL is one of the leading providers of security software products (antivirus) and
solutions in India with a market share of over 30% in the retail space. Its end
customers are home users, small offices and home offices, small and medium size
Business units (SMB), enterprises, educational institutions, as well as government
institutions. Its products are built for use across all platforms as well as devices
(laptops, mobile, etc). It meets diverse user requirements which are spread across
multiple price points. Its brand “Quick Heal” is well recognized (mainly for home
users) and it has recently launched “Seqrite” range of solution for its Enterprise
customers. As on December 31, 2015, the company had over 7.13mn active
licenses spread across more than 80 countries and has installed more than
24.5mn licenses of its products. Till now, ~97% of its revenue comes from India.
Retail sales account for ~87% of its overall sales, enterprises account for ~8%
while government enterprises account for the balance 5% of sales. As of December
31, 2015, it has a network of over 19,000 retail channel partners, 349 enterprise
channel partners, 319 government partners and 944 mobile channel partners.
Exhibit 1: Products Range
Home Users
Enterprises
Desktops, Laptops and Tablets
Smartphones/ Mobiles
SMB, Enterprises, Educational and Government
Quick Heal Total Security
Quick Heal Mobile Security for Android
Endpoint Security
Quick Heal Internet Security
Fonetastic Free
Gateway security
Quick Heal AntiVirus Pro
Fonetastic Pro
Server security
Quick Heal Total Security for Mac
Quick Heal Gadget Securance
Quick Heal Tablet Security for Android
Quick Heal Total Security for Android
Quick Heal PCTuner 3.0
Guardian NetSecure (basic antivirus solution)
Source: RHP, Angel Research
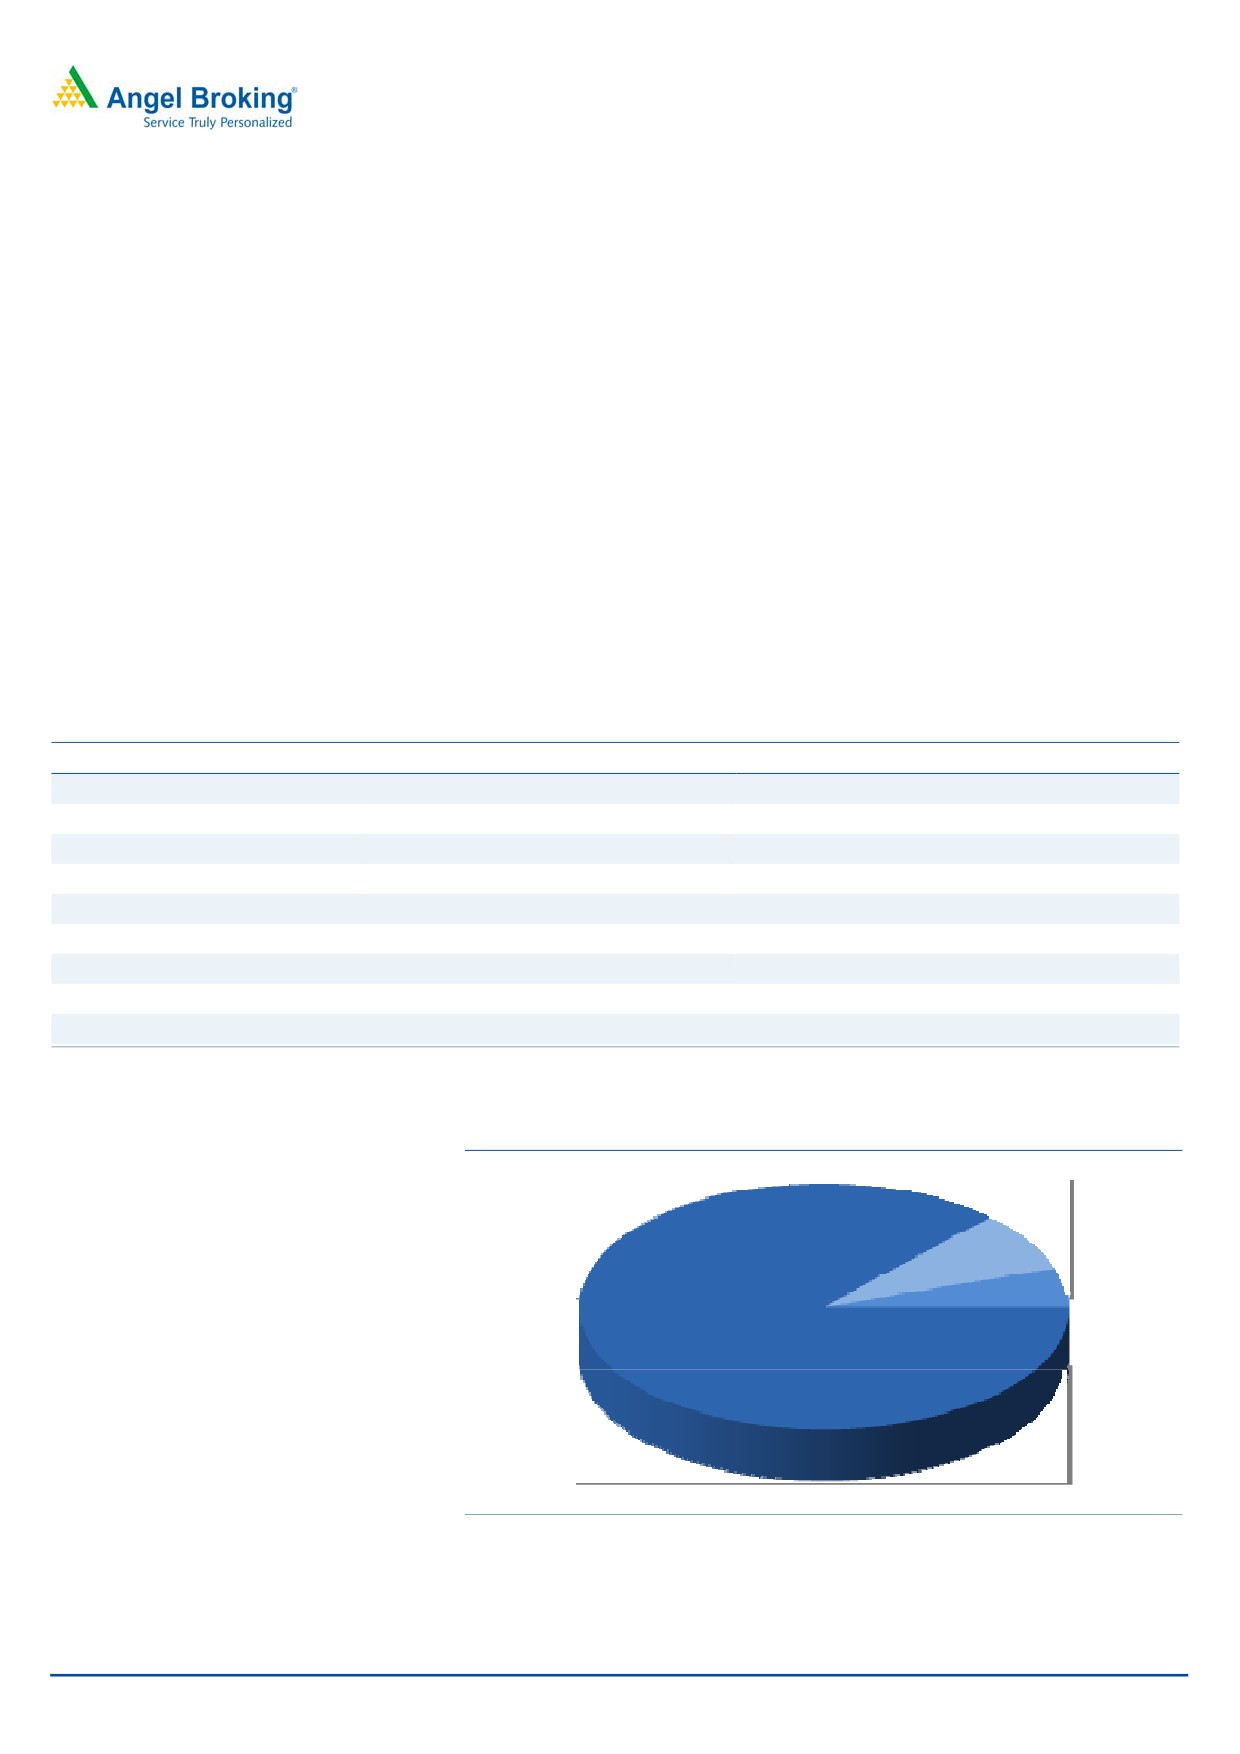
Exhibit 2: Revenue break up (1HFY2016)
Enterprises, 8%
Government, 5%
Retail, 87%
Source: Company, Angel Research
February 6, 2016
2
Quick Heal Technologies | IPO Note
Issue details
The company is raising `250cr through fresh issue of equity shares in the price
band of `311-321. In addition, the issue also consists of offer for sale of 62.7 lakh
shares of which 36.8 lakh shares will be offered by the promoter entities and 25.9
lakh shares by Sequoia Capital. The fresh issue will constitute 11.1% of the post-
issue paid-up equity share capital of the company assuming the issue is subscribed
at the upper end of the price band.
Exhibit 3: Shareholding pattern
Particulars
Pre-Issue
Post-Issue
No. of shares
(%)
No. of shares
(%)
Promoters
5,47,10,720
87.9
5,10,30,720
72.9
Others
75,31,147
12.1
1,89,99,309
27.1
Total
6,22,41,867
100.0
7,00,30,029
100.0
Source: Company, Angel Research
Objects of the offer
The company estimates to use up to `111cr of the IPO proceeds towards
advertising and sales promotion.
It would incur capital expenditure for R&D related expenses amounting to
`42cr.
The company intends on utilize upto `28cr for purchase, development and
renovation of office premises in Kolkata, Pune and New Delhi.
The balance will be utilized for general corporate purposes.
February 6, 2016
3
Quick Heal Technologies | IPO Note
Industry story in charts
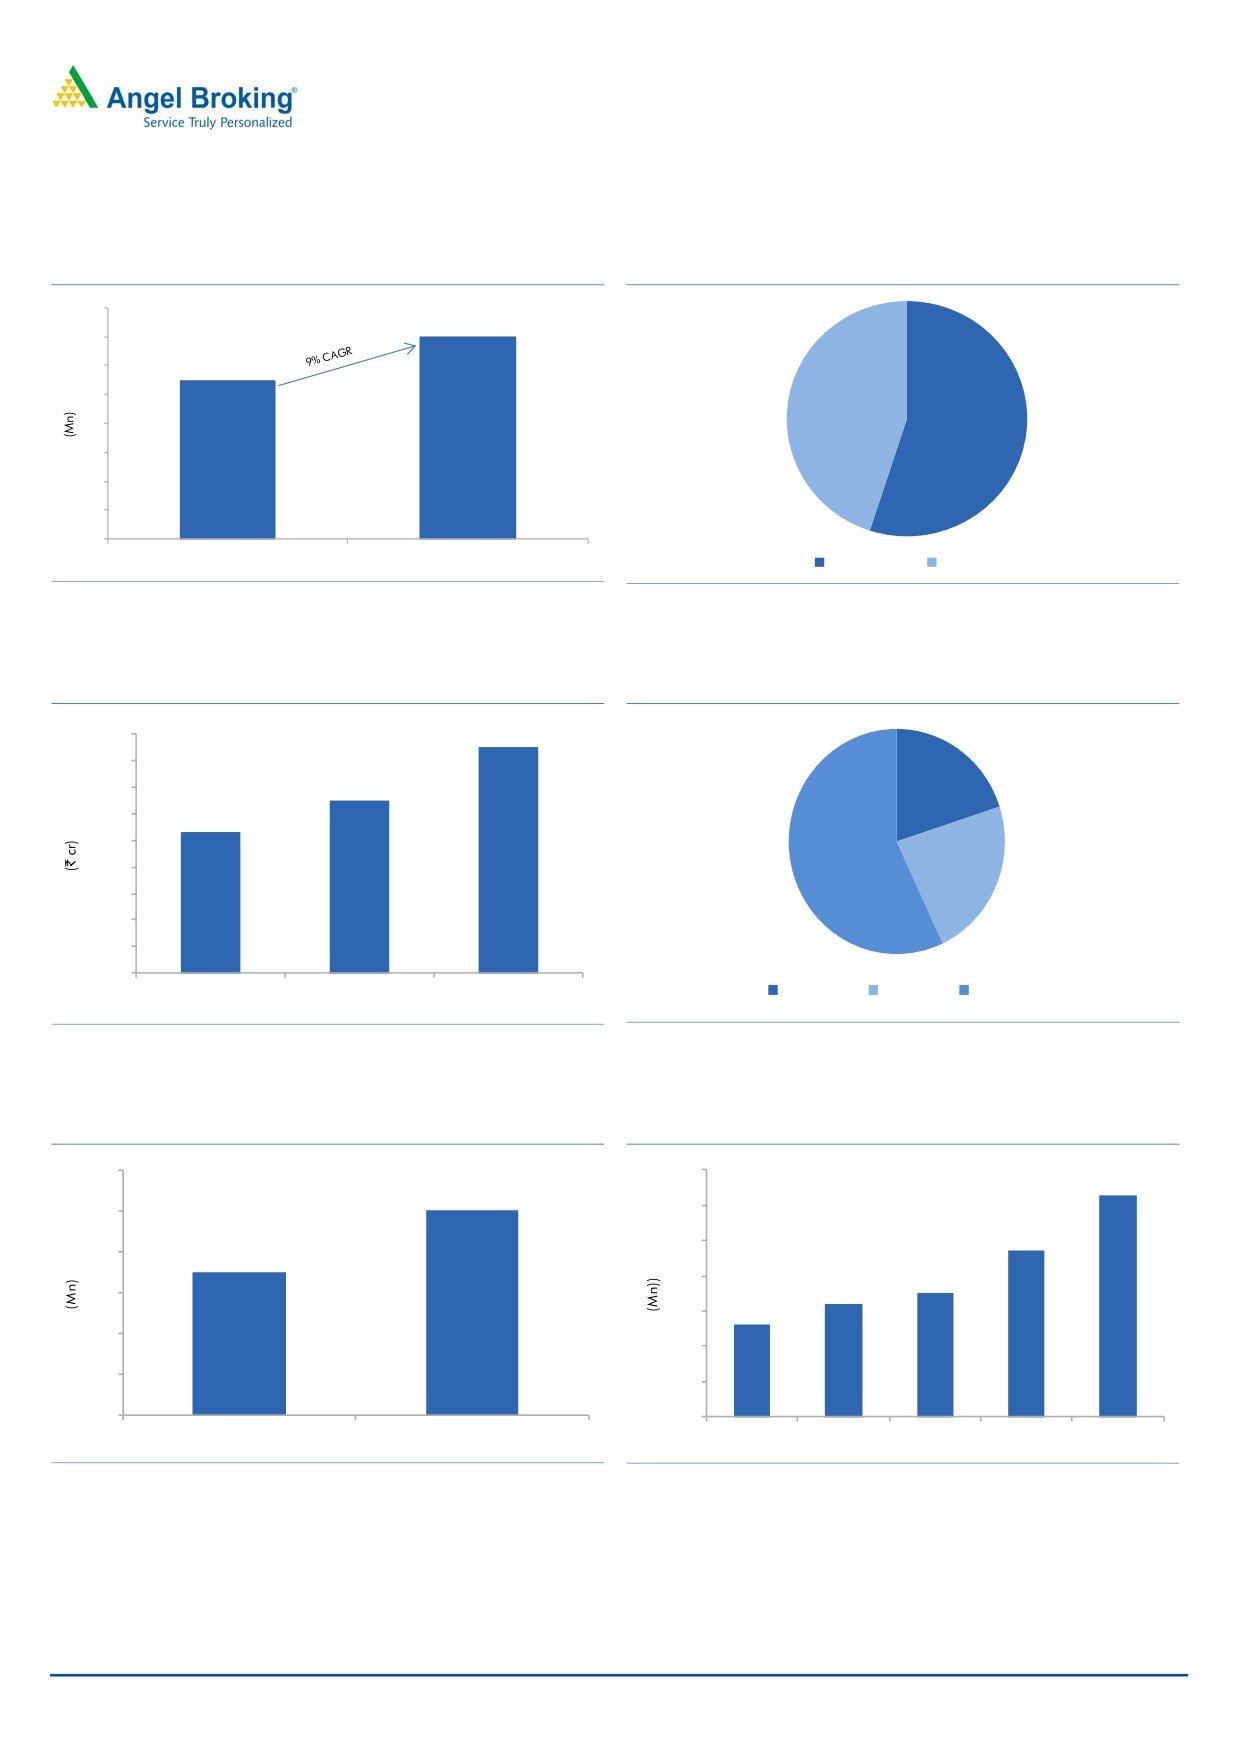
Exhibit 4: Growth in PCs installed
Exhibit 5: Segmental break-up
80
70
70
60
55
50
45%
40
55%
30
20
10
0
Current
2017E
Individual
Business
Source: Company, Angel Research
Source: Company, Angel Research
Exhibit 6: IT Security industry market size and its
Exhibit 7:
Split by segment
9,000
8,500
8,000
20%
7,000
6,500
6,000
5,300
5,000
4,000
57%
23%
3,000
2,000
1,000
-
2,013.0
2,015.0
2017E
Hadware
Software
Services
Source: RHP, Angel Research
Source: RHP, Angel Research
Exhibit 8: Expected growth in no. of internet users
Exhibit 9: No. of mobile internet users in India
350
600
314
500
500
300
236
250
400
350
200
175
159
300
150
130
200
100
100
50
0
0
Jun-15
2017E
2013
2014
2015
2016E
2017E
Source: Company, Angel Research
Source: Company, Angel Research
February 6, 2016
4
Quick Heal Technologies | IPO Note
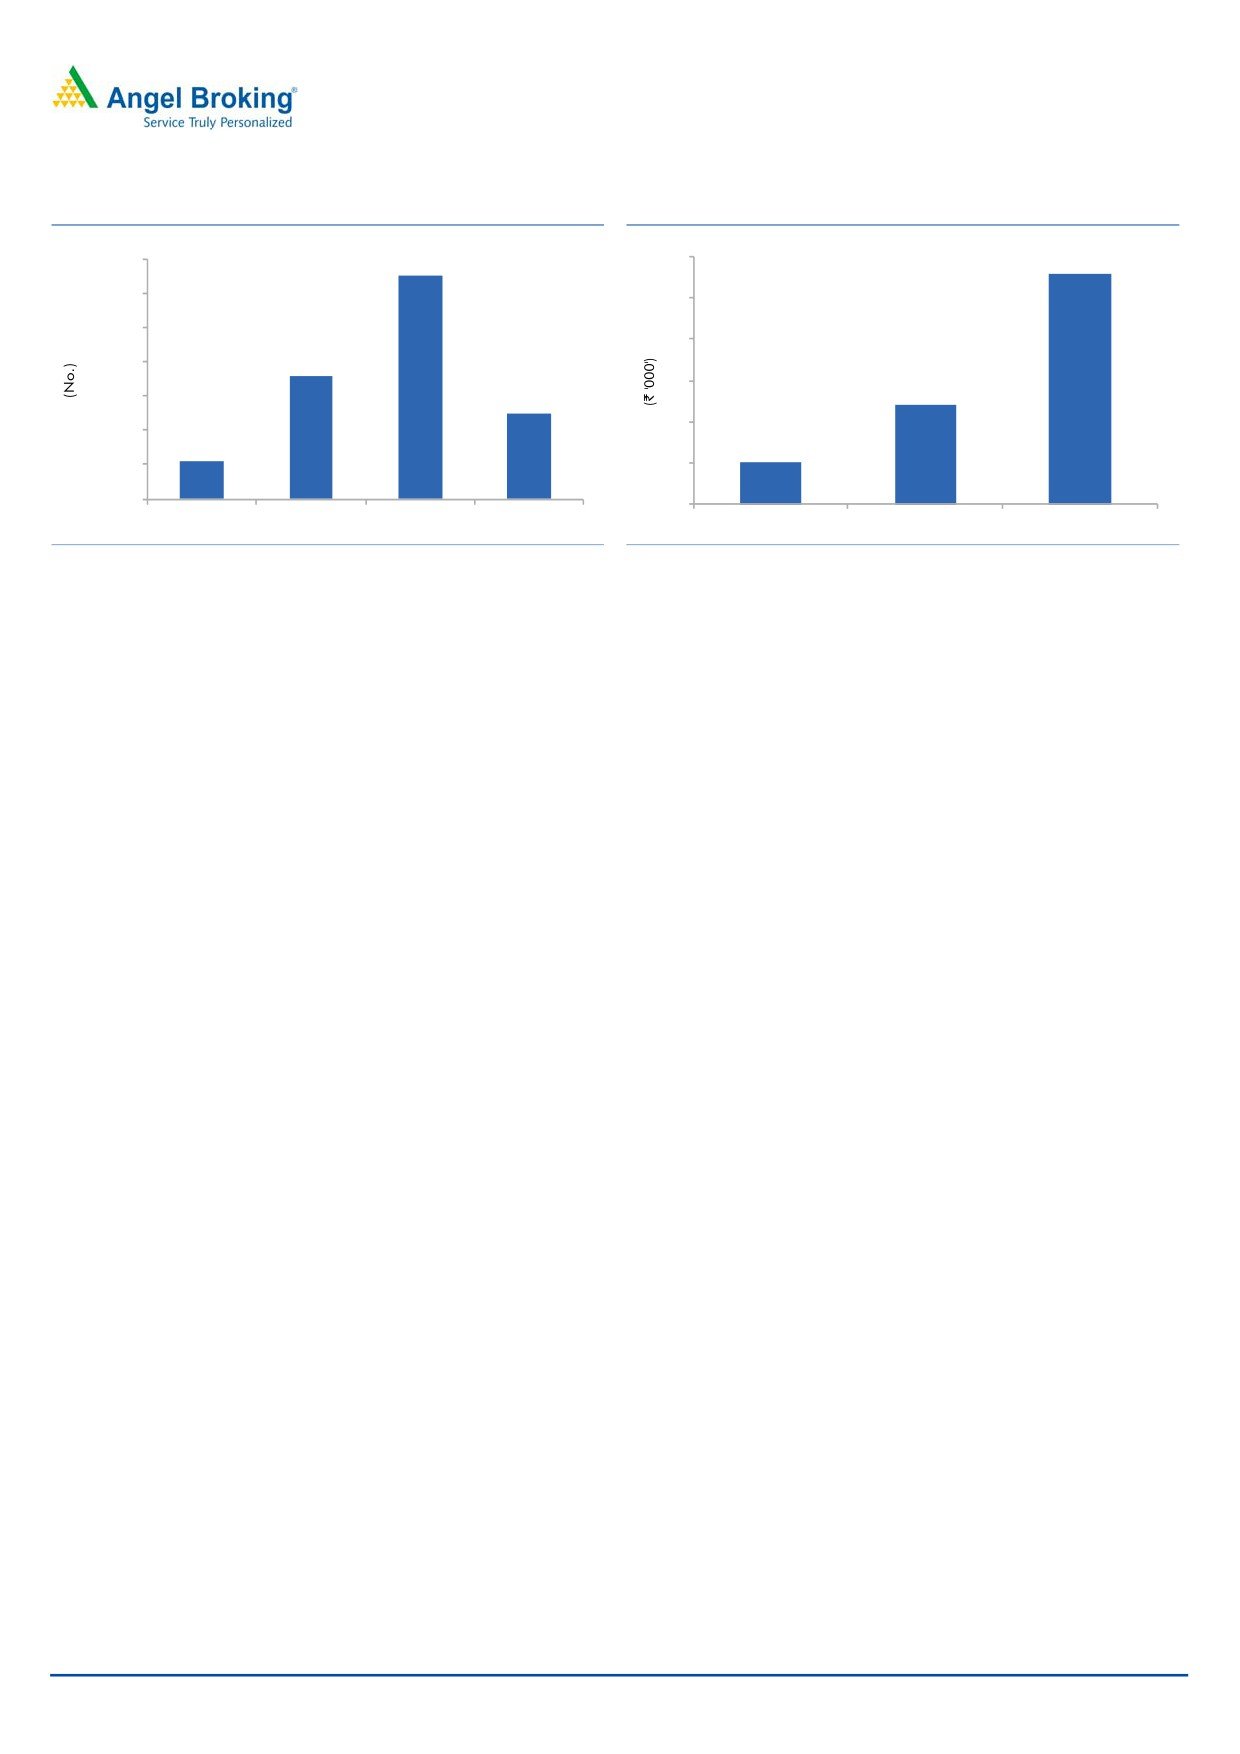
Exhibit 10: Historical data of Cyber attacks in India
Exhibit 11: Avg. Cost suffered per attack in India
1,40,000
1,30,338
60
1,20,000
50
1,00,000
40
80,000
71,780
30
60,000
49,504
20
40,000
22,060
20,000
10
10-12
24-26
56-58
0
0
2012
2013
2014
2015 (5month)
2013
2014
2015E
Source: Company, Angel Research
Source: Company, Angel Research
February 6, 2016
5
Quick Heal Technologies | IPO Note
Investment rationale
Leadership position in a growing IT Security market
Currently, the IT Security software market in India is estimated to be at ~`1500-
1800cr which comprises of Retail, End Point Security (EPS), Unified Threat
Mangement (UTM) and Mobile Device Management (MDM). Going forward, the
overall industry is expected to grow to ~`2,000-2,500cr by 2017E. Of the overall
market, the retail segment forms the major portion and is currently estimated to be
at ~`600-800cr and is expected to post a CAGR of 20-25% over 2015-17E on the
back of growing number of internet users.
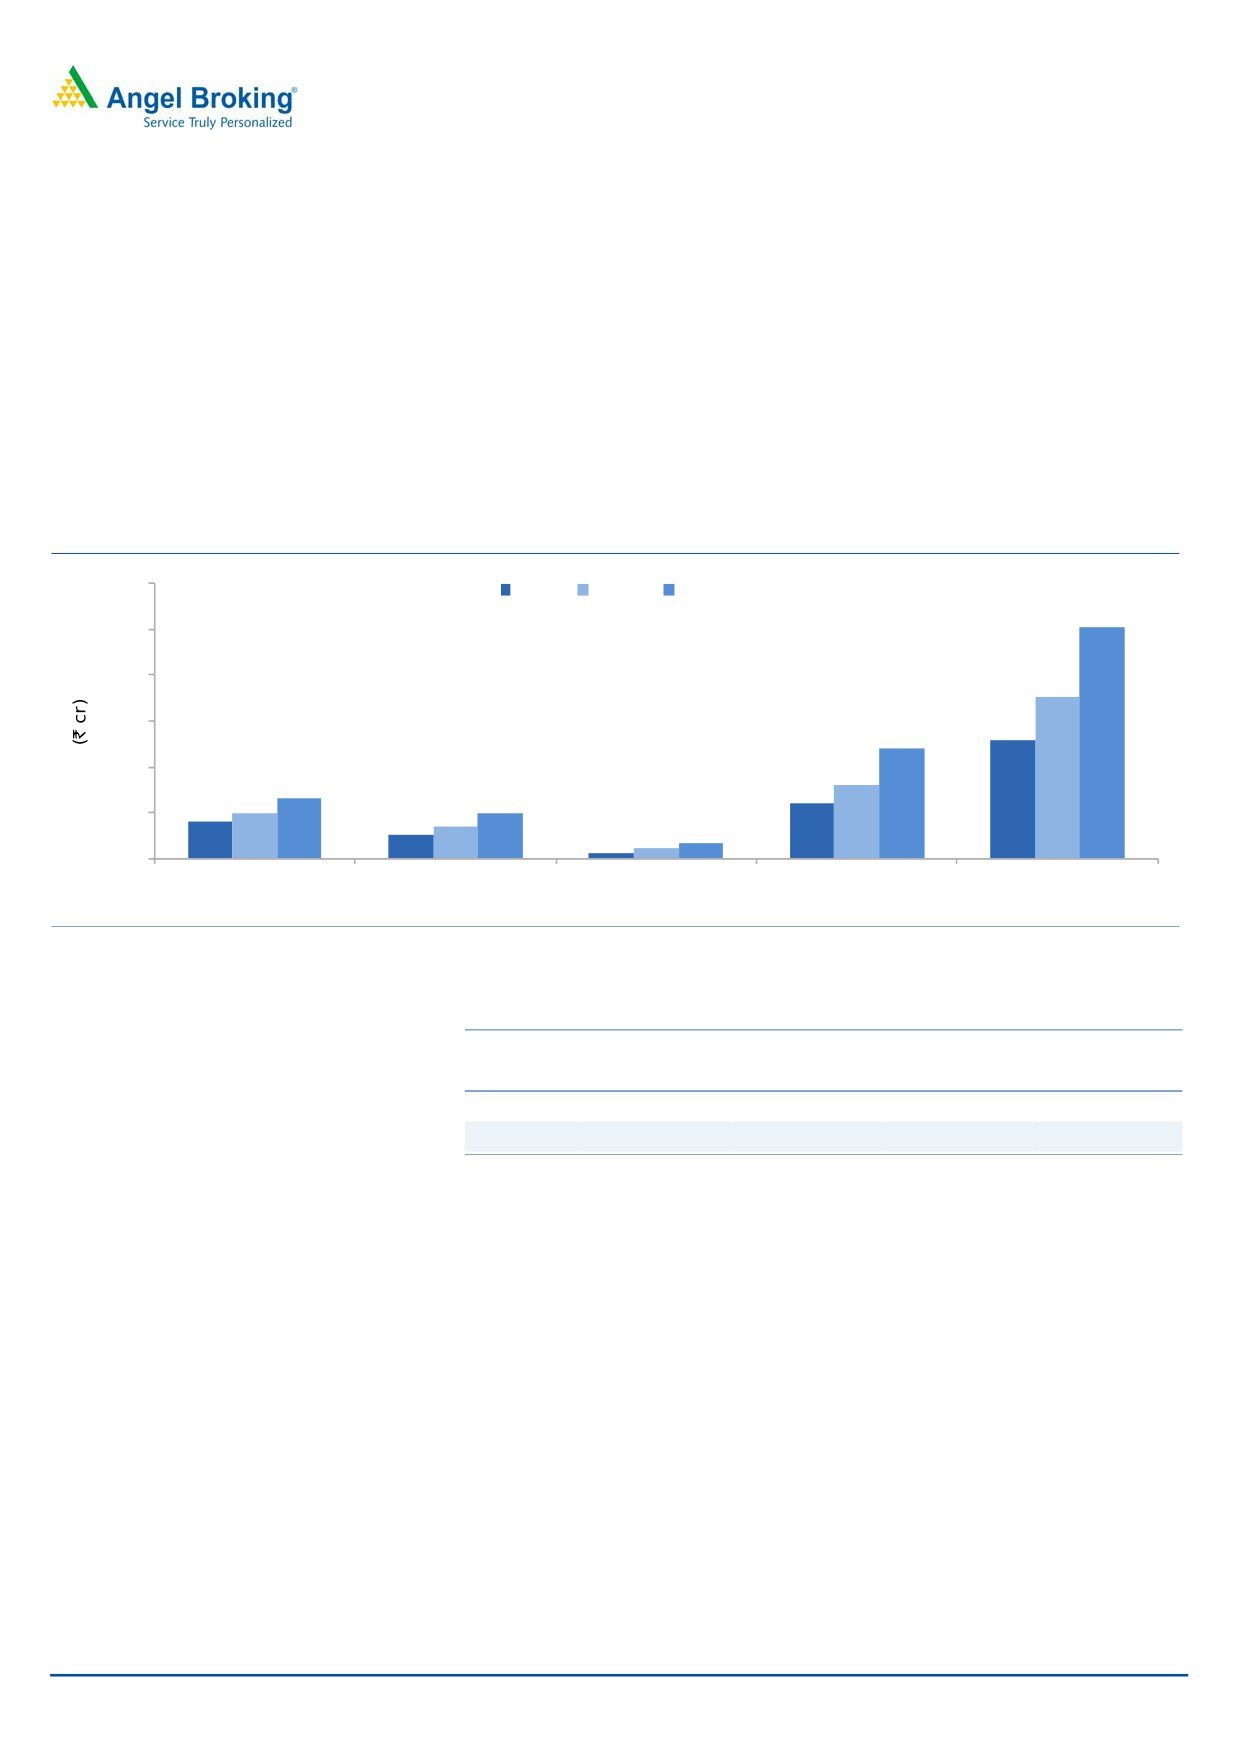
Exhibit 12: Product Segments - IT Security market
3,000
F2013
FY2015
FY2017E
2,520
2,500
2,000
1,760
1,300
1,500
1,200
800
1,000
650
600
500
500
400
500
350
250
170
110
50
0
End Point Security (EPS)
Unified Threat
Mobile Device
Retail
Total
Management (UTM)
Management (MDM)
Source: Company, Angel Research
Exhibit 13: IT Security Market (Product Segments) expected growth
CAGR
EPS
UTM
MDM
Retail
FY2013-15
10-15%
15-20%
45-50%
10-15%
FY2015-17E
10-15%
15-20%
25-30%
20-25%
Source: Company, Angel Research
Quick Heal had over 7.13mn active
Currently the company is one of the leading providers of security software solutions
licenses as on December
31,
2015
in India with a market share of ~30% in the retail segment. It has over 7.13mn
spread across India as well as outside
active licenses as of December 31, 2015 spread across India as well as outside
of India
India. Over the last four years the company has reported a ~26% CAGR in terms
of active users. Going forward, we expect the growth momentum to continue as
QHTL is best placed to benefit from the growing industry on the back of its brand
visibility and its wide distribution reach.
Further, other segments like EPS, UTM and MDM are also growing at a healthy
pace and we expect QHTL to benefit from its growing presence in the above
mentioned categories.
February 6, 2016
6
Quick Heal Technologies | IPO Note
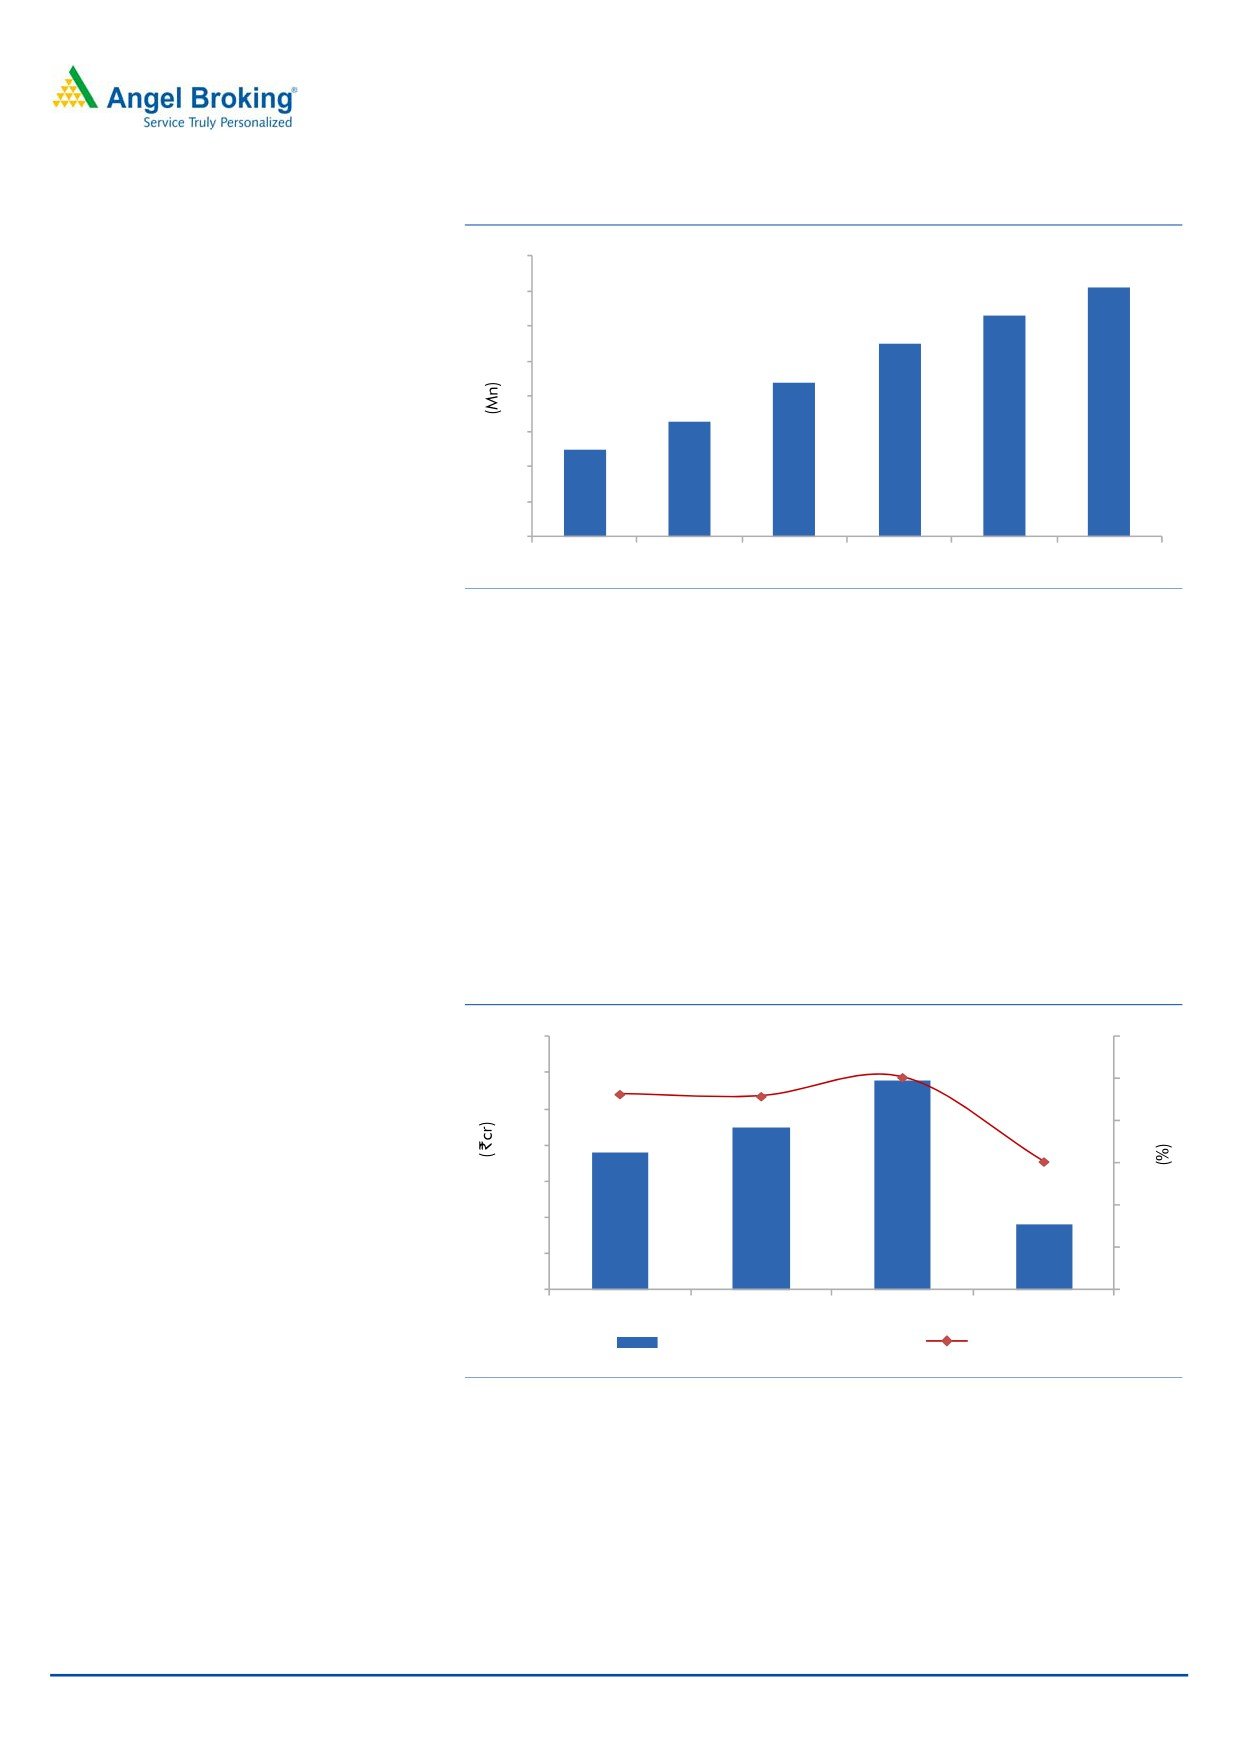
Exhibit 14: Active license user trend
8
7.1
7
6.3
6
5.5
5
4.4
4
3.3
3
2.5
2
1
0
FY2011
FY2012
FY2013
FY2014
FY2015
1HFY2016
Source: Company, Angel Research
Strong distribution network with good brand equity
Despite facing competition from international as well as domestic players in India,
QHTL has been able to successfully grow its business and establish a strong position
across India on the back of its 19,000 retail channel partners, 349 enterprise
channel partners, 319 government partners and 944 mobile channel partners,
who act as distributors and resellers of it solutions. Further, QHTL conducts sales
and marketing activities out of 64 offices and warehouses across 36 cities in India.
As of December 31, 2015, the company had a sales & marketing team comprised
of 400 employees who work closely with the company’s channel partners.
Exhibit 15: Historical ad spend by QHTL
35
12
10.1
30
9.3
9.2
10
25
8
6.1
20
6
15
4
10
2
5
19
22
29
9
0
0
FY2013
FY2014
FY2015
1HFY2016
Advertising and sales promotion
% to sales
Source: Company, Angel Research
QHTL continuously does major marketing exercises for expanding dealer and
retailer network. The company’s media presence spans newspapers, magazines,
news and entertainment TV channels, and FM radio channels in India. The
company has historically spent ~10% of its top-line on advertisement and is expected
to further spend ~`111cr from IPO proceeds (over three years) to further improve its
visibility which will aid growth.
February 6, 2016
7
Quick Heal Technologies | IPO Note
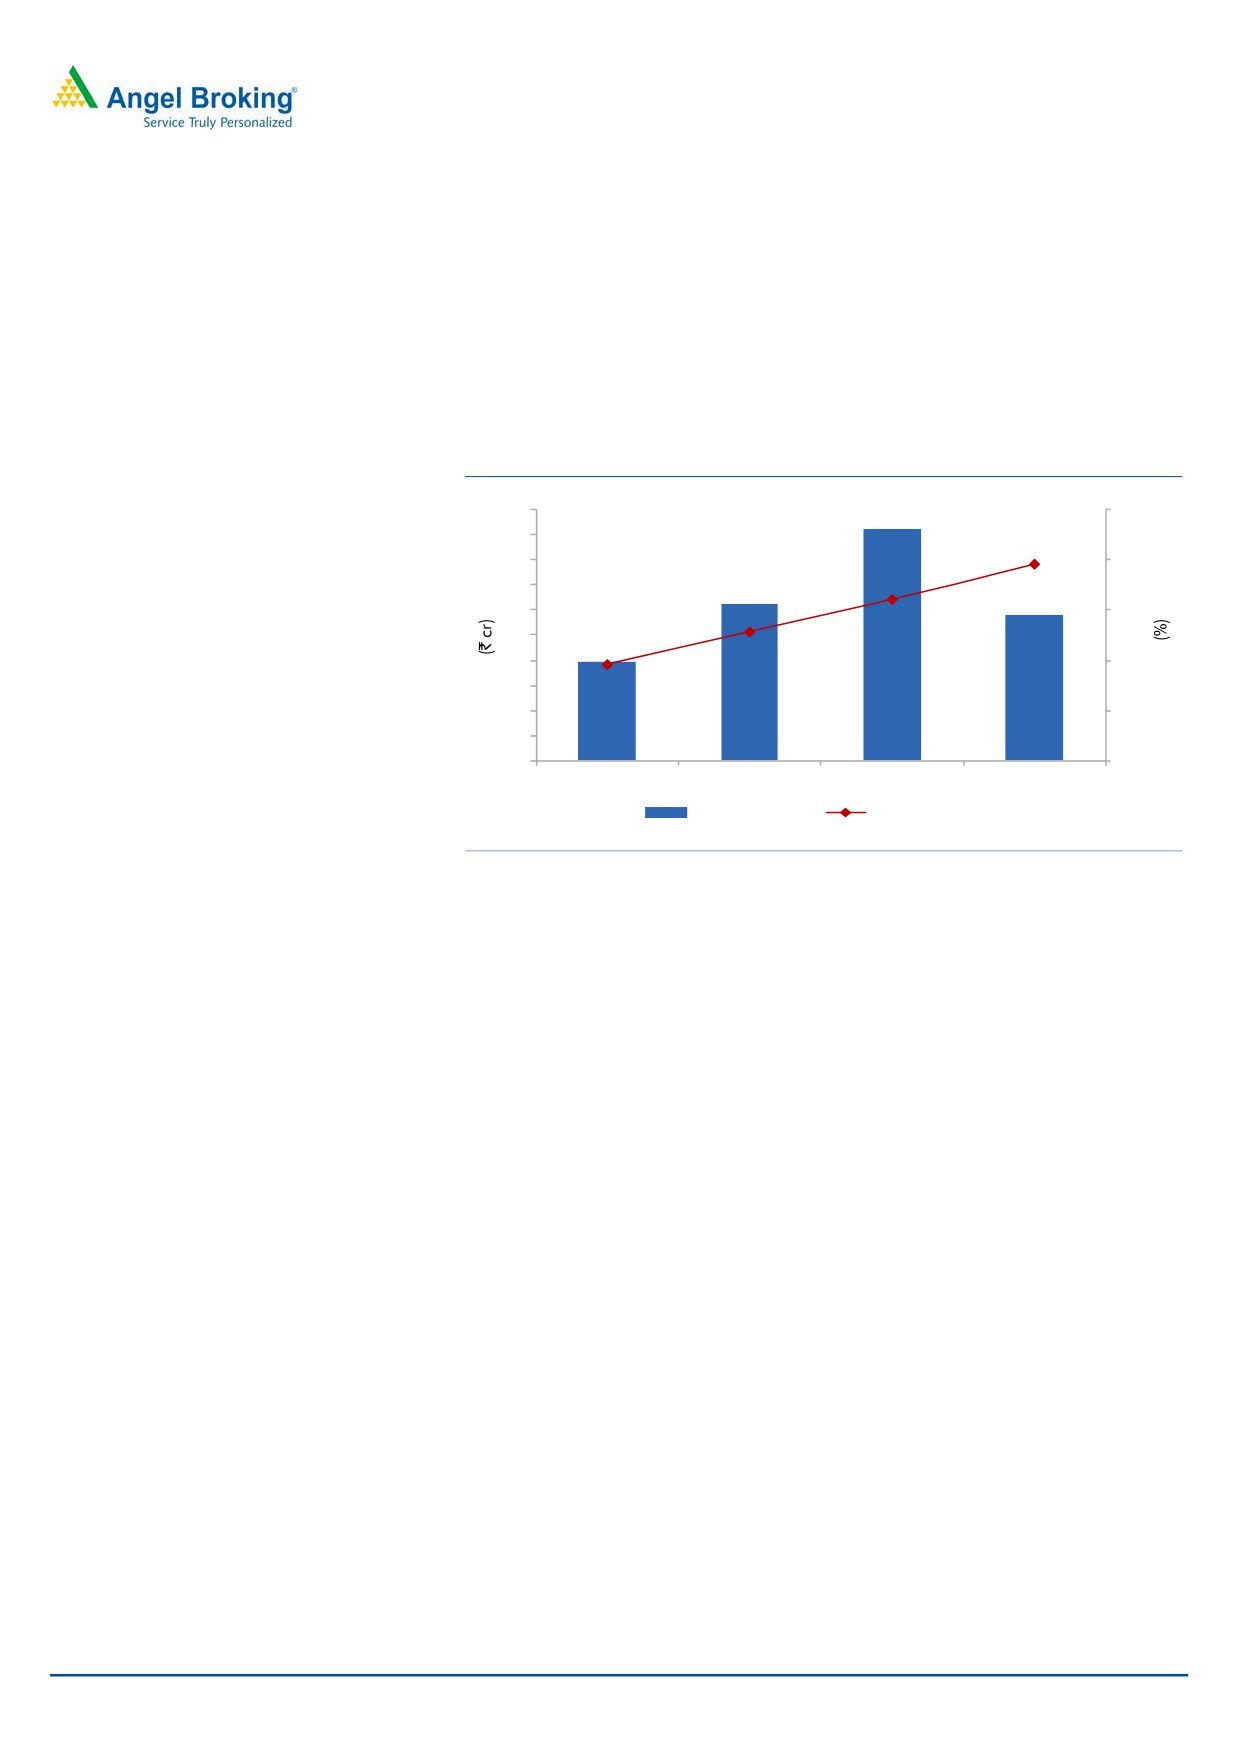
Significant R&D and technology capabilities
As of December
31,
2015, the
QHTL has strong R&D capability that enables it to be competitive in an industry
company had
1,396 employees,
where technology forms the core competency. It has steadily increased its R&D
including 547 employees who comprise
expense from 9.6% of sales in FY2013 to 19.6% of sales as of 1HFY2016 and
the R&D team.
would be utilizing `42cr of the IPO proceeds to further invest in R&D. As of
December 31, 2015, QHTL had 1,396 employees, of which 547 employees were
part of its R&D team.
Exhibit 16: Historical R&D spend by QHTL
50
25
45
19.6
40
20
16.1
35
12.9
30
15
25
9.6
20
10
15
10
5
5
20
31
46
29
0
0
FY2013
FY2014
FY2015
1HFY2016
R & D expenses
% to sales
Source: Company, Angel Research
Debt free with healthy Cash Flow generation
QHTL has a debt free balance sheet and cash balance of ~`107cr as on
1HFY2016. Over the past 5 years, QHTL is generating strong operating cash flows
which have grown from ~`49cr in FY2012 to ~`77cr in FY2015. We believe that
the company generates sufficient cash flows to cover for technology upgradation
related expenses.
February 6, 2016
8
Quick Heal Technologies | IPO Note
Valuation
Outlook Valuation: QHTL has shown significant growth over FY2012-15, posting a
revenue CAGR of 16.9% while its profitability has declined from `68cr in FY2012
to `54cr in FY2015 as the company was in an investment phase. Investments were
incurred towards new product development for its Enterprise business and brand
building.
On the valuation front, at the upper end of the price band, the pre-issue P/E works
out to 41.2x its 1HFY2016 annualized earnings which we consider decent taking
into account the company’s brand image. Further, the company is confident of it
being able to sustain its growth trajectory owing to its strong distribution network.
Additionally, there is a two-year lead-lag on product development for the
Enterprise business of which the company will reap benefits in future. Thus, we
recommend a Subscribe on the issue from a longer term perspective.
Exhibit 17: Comparative Valuation
P/E P/BV
ROE EV/Sales EV/EBITDA
Pre issue valuation^
(x)
(x)
(%)
(x)
(x)
QHTL*
FY2016
41.2
5.1
12.7%
6.4
21.5
Symantec Corporation*
FY2016
23.8
2.1
8.9%
1.9
12.3
Source: RHP, Note: *based on 1HFY16 annualised numbers; ^based on price at upper band
Risks
Intense competition and lack of pricing power: QHTL faces stiff competition from
both international and Indian companies like Symantec, Trend, Micro, Kaspersky,
McAfee and others. This could levy pressure on the company’s operating margin
and lead to lower profitability.
Changes in technology: The IT security industry is subject to rapid changes in
technology. Any change in technology or better technology adoption by other
competitors could negatively affect the company’s revenue.
February 6, 2016
9
Quick Heal Technologies | IPO Note
Profit & Loss (consolidated)
Y/E March (` cr)
FY2012
FY2013
FY2014
FY2015
1HFY16
Total operating income
179
205
243
286
148
% chg
14.5
18.5
17.8
-
Total Expenditure
83
100
138
194
104
Raw Material
9
10
11
16
8
Employee Cost
21
29
43
64
42
Other Expenses
54
62
84
114
55
EBITDA
96
105
104
92
44
% chg
9.9
(0.7)
(12.0)
(% of Net Sales)
53.5
51.3
43.0
32.1
29.7
Depreciation& Amortisation
2
4
11
20
11
EBIT
94
101
94
72
33
% chg
7.7
(7.1)
(23.5)
(% of Net Sales)
52.3
49.1
38.5
25.0
22.0
Interest & other Charges
-
-
-
-
-
Other Income
6
10
10
8
4
(% of PBT)
5.7
8.8
9.5
10.3
11.1
Recurring PBT
99
110
103
80
37
% chg
11.3
(6.4)
(22.8)
Exceptional Exp/(inc)
-
-
17
-
-
PBT (reported)
99
110
86
80
37
Tax
31
34
28
26
13
(% of PBT)
31.3
30.4
32.1
32.6
34.1
PAT Reported
68
77
58
54
24
% chg
12.8
(24.1)
(7.8)
(% of Net Sales)
38.1
37.5
24.0
18.8
16.3
Basic EPS (`)
11.0
12.4
9.4
8.6
3.9
Fully Diluted EPS (`)
11.0
12.4
9.4
8.6
3.9
% chg
12.8
(24.1)
(7.8)
(55.0)
February 6, 2016
10
Quick Heal Technologies | IPO Note
Balance Sheet (consolidated)
Y/E March (` cr)
FY2012
FY2013
FY2014
FY2015
1HFY16
SOURCES OF FUNDS
Equity Share Capital
8
8
61
61
61
Reserves& Surplus
203
277
271
270
295
Shareholders’ Funds
210
285
332
331
356
Minority Interest
-
-
-
-
-
Total Loans
-
-
-
-
-
Long-term provisions
0.4
-
-
-
-
Deferred Tax Liability
0
1
-
-
-
Total Liabilities
211
285
332
331
356
APPLICATION OF FUNDS
Gross Block
19
38
82
111
150
Less: Acc. Depreciation
-
-
-
-
-
Net Block
19
38
82
111
150
Capital Work in Progress
24
29
55
74
49
Investments
100
139
131
130
96
Current Assets
78
97
92
91
87
Inventories
1
2
6
8
7
Sundry Debtors
66
77
69
65
58
Cash
8
10
10
13
11
Loans & Advances
4
7
6
6
8
Other Assets
0
0
0
0
4
Current liabilities
19
29
47
97
47
Net Current Assets
59
68
44
(6)
40
Long term loans and adv.
9
11
16
17
15
Other Non Current Assets
0
0
0
0
0
Deferred Tax Asset
-
-
4
5
5
Mis. Exp. not written off
-
-
-
-
-
Total Assets
211
285
332
331
356
February 6, 2016
11
Quick Heal Technologies | IPO Note
Cash flow statement (consolidated)
Y/E March (` cr)
FY2012
FY2013
FY2014
FY2015
1HFY16
Profit before tax
99
110
86
80
37
Depreciation
2
4
11
20
11
Change in Working Capital
(19)
(10)
(5)
13
(1)
Interest / Dividend (Net)
(5)
(7)
(8)
(7)
(3)
Direct taxes paid
(29)
(30)
(41)
(30)
(10)
Others
1
0
17
1
(0)
Cash Flow from Operations
49
68
61
77
34
(Inc.)/ Dec. in Fixed Assets
(9)
(33)
(77)
(66)
(25)
(Inc.)/ Dec. in Investments
(44)
(29)
18
13
37
Cash Flow from Investing
(53)
(63)
(59)
(53)
12
Issue of Equity
-
-
-
-
-
Inc./(Dec.) in loans
-
-
-
-
-
Dividend Paid (Incl. Tax)
-
(1)
(2)
(17)
(49)
Interest / Dividend (Net)
-
-
-
-
-
Cash Flow from Financing
-
(1)
(2)
(17)
(49)
Inc./(Dec.) in Cash
(4)
4
(1)
7
(2)
Opening Cash balances
6
3
6
5
13
Effect of Foreign exchange diff.
-
-
(0)
-
-
Closing Cash balances
3
6
5
13
10
February 6, 2016
12
Quick Heal Technologies | IPO Note
Key Ratios
Y/E March
FY2012
FY2013
FY2014
FY2015
Valuation Ratio (x)
P/E (on FDEPS)
29.3
26.0
34.2
37.1
P/CEPS
28.4
24.6
28.9
27.0
P/BV
9.5
7.0
6.0
6.0
Dividend yield (%)
0.1
0.1
0.5
2.3
EV/Sales
10.6
9.0
7.6
6.5
EV/EBITDA
19.8
17.6
17.8
20.2
EV / Total Assets
8.2
5.9
4.9
4.3
Per Share Data (`)
EPS (Basic)
11.0
12.4
9.4
8.6
EPS (fully diluted)
11.0
12.4
9.4
8.6
Cash EPS
11.3
13.1
11.1
11.9
DPS
0.2
0.3
1.5
7.4
Book Value
33.8
45.8
53.4
53.3
Returns (%)
ROCE
44.5
35.3
28.2
21.6
Angel ROIC (Pre-tax)
91.1
74.5
48.9
37.9
ROE
32.4
27.0
17.6
16.2
Turnover ratios (x)
Asset Turnover (Gross Block)
9.5
5.3
3.0
2.6
Inventory / Sales (days)
1
4
9
10
Receivables (days)
134
138
104
83
Payables (days)
29
37
44
48
WC cycle (ex-cash) (days)
106
105
70
45
Note: Valuation ratios based on pre-issue outstanding shares and at upper end of the price band
February 6, 2016
13
Quick Heal Technologies | IPO Note
Research Team Tel: 022 - 39357800
DISCLAIMER
Angel Broking Private Limited (hereinafter referred to as “Angel”) is a registered Member of National Stock Exchange of India Limited,
Bombay Stock Exchange Limited and Metropolitan Stock Exchange of India Limited. It is also registered as a Depository Participant with
CDSL and Portfolio Manager with SEBI. It also has registration with AMFI as a Mutual Fund Distributor. Angel Broking Private Limited is
a registered entity with SEBI for Research Analyst in terms of SEBI (Research Analyst) Regulations, 2014 vide registration number
INH000000164. Angel or its associates has not been debarred/ suspended by SEBI or any other regulatory authority for accessing
/dealing in securities Market. Angel or its associates including its relatives/analyst do not hold any financial interest/beneficial
ownership of more than 1% in the company covered by Analyst. Angel or its associates/analyst has not received any compensation /
managed or co-managed public offering of securities of the company covered by Analyst during the past twelve months. Angel/analyst
has not served as an officer, director or employee of company covered by Analyst and has not been engaged in market making activity
of the company covered by Analyst.
This document is solely for the personal information of the recipient, and must not be singularly used as the basis of any investment
decision. Nothing in this document should be construed as investment or financial advice. Each recipient of this document should
make such investigations as they deem necessary to arrive at an independent evaluation of an investment in the securities of the
companies referred to in this document (including the merits and risks involved), and should consult their own advisors to determine
the merits and risks of such an investment.
Reports based on technical and derivative analysis center on studying charts of a stock's price movement, outstanding positions and
trading volume, as opposed to focusing on a company's fundamentals and, as such, may not match with a report on a company's
fundamentals.
The information in this document has been printed on the basis of publicly available information, internal data and other reliable
sources believed to be true, but we do not represent that it is accurate or complete and it should not be relied on as such, as this
document is for general guidance only. Angel Broking Pvt. Limited or any of its affiliates/ group companies shall not be in any way
responsible for any loss or damage that may arise to any person from any inadvertent error in the information contained in this report.
Angel Broking Pvt. Limited has not independently verified all the information contained within this document. Accordingly, we cannot
testify, nor make any representation or warranty, express or implied, to the accuracy, contents or data contained within this document.
While Angel Broking Pvt. Limited endeavors to update on a reasonable basis the information discussed in this material, there may be
regulatory, compliance, or other reasons that prevent us from doing so.
This document is being supplied to you solely for your information, and its contents, information or data may not be reproduced,
redistributed or passed on, directly or indirectly.
Neither Angel Broking Pvt. Limited, nor its directors, employees or affiliates shall be liable for any loss or damage that may arise from
or in connection with the use of this information.
Note: Please refer to the important ‘Stock Holding Disclosure' report on the Angel website (Research Section). Also, please refer to the
latest update on respective stocks for the disclosure status in respect of those stocks. Angel Broking Pvt. Limited and its affiliates may
have investment positions in the stocks recommended in this report.
February 6, 2016
14