2QFY2016 Result Update | Banking
November 13, 2015
Punjab National Bank
NEUTRAL
CMP
`134
Performance Highlights
Target Price
-
Particulars (` cr)
2QFY16 1QFY16
% chg (qoq) 2QFY15
% chg (yoy)
Investment Period
-
NII
4,322
4,102
5.4
4,151
4.1
Pre-prov. profit
2,939
3,132
(6.2)
2,876
2.2
PAT
621
721
(13.8)
575
7.9
Stock Info
Source: Company, Angel Research
Sector
Banking
Punjab National Bank (PNB) reported a mixed set of numbers for 2QFY2016 with
Market Cap (` cr)
28,263
subdued operating performance, while its asset quality improved marginally.
Beta
1.3
Loan growth remains modest; NIM improves qoq
52 Week High / Low
232/123
During 2QFY2016, advances and deposits grew by 6.7% and 14.0% yoy,
Avg. Daily Volume
5,003,957
respectively, with the CD ratio at 70.6%. Domestic advances growth was sluggish
Face Value (`)
2
at 6.3% yoy, while international advances saw a modest growth of 9.5% yoy. In
BSE Sensex
25,743
domestic advances, the retail loan book grew by 23.0% yoy, aided by 27.6% yoy
Nifty
7,783
growth in housing segment. Industry loans growth was modest at 7.6% yoy as the
Reuters Code
PNBK.NS
bank was cautious lending to the large industry segment.
Bloomberg Code
PNB@IN
CASA deposits grew by 13.4% yoy with Current deposits growing by 25.0% yoy.
The NIM improved by 7bp qoq to 2.97%, due to higher yields. Other income
Shareholding Pattern (%)
(excl. treasury) was weak witnessing a decline of 12.9% yoy due to a decline seen
Promoters
62.1
in both fee income and recoveries.
MF / Banks / Indian Fls
19.7
Asset quality improved for the second consecutive quarter as the Gross NPA ratio
FII / NRIs / OCBs
13.0
decreased by 11bp qoq to 6.36%, while the Net NPA also drifted downwards by
Indian Public / Others
5.3
6bp qoq to 3.99%. The bank reported the second quarter of consecutive
significant decline in slippages on a qoq basis to `2,613cr (annualized slippage
ratio stood at 2.8%) as compared to `3,382cr in 1QFY2016. Out of the total
Abs. (%)
3m 1yr
3yr
slippages, fresh slippage for the quarter was to the tune of `2,388cr while fresh
Sensex
(8.4)
(7.6)
37.9
restructuring during the quarter was lower at `216cr as against `676cr in 1QFY2016.
PNB
(16.0)
(27.5)
(13.4)
The outstanding restructured book stood at `38,261cr, 10.3% of the loan book.
Outlook and valuation: PNB has been witnessing improvement in asset quality
3-year price chart
since the past 2 quarters after severe asset quality pain over the previous several
250
quarters. In our view, we expect asset quality pressure to ease from here on given
200
the bank’s seasoned loan book and conservative lending approach followed by
150
the bank as compared to its peers. At the current market price, the stock trades at 0.6x
100
FY2017E ABV. However, given the stress in certain sectors of the economy and with PNB
50
having a meaningful exposure to these stressed sectors, we would follow a cautious
0
stance in the near-term. Hence, we recommend a Neutral rating on the stock.
Key financials
Y/E March (` cr)
FY2014
FY2015
FY2016E
FY2017E
Source: Company, Angel Research
NII
16,146
16,556
17,101
19,343
% chg
8.7
2.5
3.3
13.1
Net profit
3,343
3,061
3,316
5,052
Vaibhav Agrawal
% chg
(29.6)
(8.4)
8.3
52.3
NIM (%)
3.2
2.9
2.8
2.8
022 - 3935 7800 Ext: 6808
EPS (`)
18.5
16.5
17.9
27.2
P/E (x)
7.4
8.3
7.7
5.0
P/ABV (x)
0.8
0.8
0.8
0.6
Chintan Shah
RoA (%)
0.6
0.5
0.5
0.7
022 - 3935 7800 Ext: 6839
RoE (%)
10.2
8.5
8.5
12.0
Source: Company, Angel Research; Note: CMP as of November10, 2015
Please refer to important disclosures at the end of this report
1
Punjab National Bank | 2QFY2016 Result Update
Exhibit 1: 2QFY2016 performance
Particulars (` cr)
2QFY16
1QFY16
% chg (qoq)
2QFY15
% chg (yoy)
FY2015
FY2014
% chg
Interest earned
12,345
12,035
2.6
11,462
7.7
46,315
43,223
7.2
- on Advances / Bills
9,064
8,908
1.7
8,654
4.7
34,794
32,393
7.4
- on investments
3,029
2,906
4.2
2,609
16.1
10,600
10,266
3.3
- on balance with RBI & others
218
169
29.0
137
58.9
632
362
74.5
- on others
35
52
(33.0)
61
(43.6)
289
202
42.9
Interest Expended
8,023
7,932
1.1
7,311
9.7
29,760
27,077
9.9
Net Interest Income
4,322
4,102
5.4
4,151
4.1
16,556
16,146
2.5
Other income
1,357
1,397
(2.9)
1,558
(12.9)
5,891
4,577
28.7
Other income excl. treasury
1,019
1,159
(12.1)
1,330
(23.4)
4,529
3,843
17.9
- Fee Income
784
721
9
591
32.7
2,526
2,380
6.1
- Treasury Income incl. MF Div.
338
238
42.0
228
48.2
1,362
734
85.6
- Recov. from written off a/cs
236
217
8.8
483
(51.1)
1,018
514
98.1
- Others
(1)
221
(100.5)
256
(100.4)
985
949
3.8
Operating income
5,679
5,500
3.3
5,710
(0.5)
22,446
20,723
8.3
Operating expenses
2,740
2,368
15.7
2,834
(3.3)
10,492
9,338
12.4
- Employee expenses
1,878
1,550
21.2
2,034
(7.7)
7,337
6,510
12.7
- Other Opex
863
818
5.5
799
7.9
3,155
2,828
11.6
Pre-provision Profit
2,939
3,132
(6.2)
2,876
2.2
11,955
11,384
5.0
Provisions & contingencies
1,882
1,811
3.9
1,768
6.5
7,998
6,694
19.5
- Provisions for NPAs
2,031
1,291
57.3
1,638
24.0
7,978
4,518
76.6
- Other Provisions
(149)
520
(128.6)
130
(214.6)
20
1,394
(98.6)
PBT
1,056
1,321
(20.0)
1,108
(4.7)
3,957
4,691
(15.6)
Provision for Tax
435
600
(27.4)
533
(18.3)
896
1,348
(33.6)
PAT
621
721
(13.8)
575
7.9
3,062
3,343
(8.4)
Effective Tax Rate (%)
41.2
45.4
(421)bp
48.1
(686)bp
22.6
28.7
(610)bp
Source: Company, Angel Research
November 13, 2015
2
Punjab National Bank | 2QFY2016 Result Update
Exhibit 2: 2QFY2016 performance analysis
Particulars
2QFY16 1QFY16
% chg (qoq) 2QFY15
% chg (yoy)
Advances (` cr)
3,80,958
3,80,880
0.0
3,57,093
6.7
Deposits (` cr)
5,39,924
5,17,733
4.3
4,73,511
14.0
Credit-to-Deposit Ratio (%)
70.6
73.6
(301)bp
75.4
(486)bp
Current deposits (` cr)
36,863
31,938
15.4
29,497
25.0
Saving deposits (` cr)
1,57,683
1,49,555
5.4
1,42,079
11.0
CASA deposits (` cr)
1,94,546
1,81,493
7.2
1,71,576
13.4
Reported CASA ratio (%)
40.2
38.9
129bp
39.9
34bp
CAR (%)
12.2
12.1
12bp
11.8
41bp
Tier 1 CAR (%)
9.4
9.2
18bp
8.7
66bp
Profitability Ratios (%)
Cost of deposits
5.97
6.0
(2)bp
6.1
(17)bp
Yield on advances
9.66
9.56
10bp
9.9
(24)bp
Yield on investments
8.0
7.9
1bp
8.0
(4)bp
Yield on funds
7.68
7.69
(1)bp
8.0
(32)bp
Cost of funds
5.0
5.1
(4)bp
5.1
(7)bp
Reported NIM
2.97
2.9
7bp
3.2
(21)bp
Cost-to-income ratio
48.3
43.1
520bp
49.6
(137)bp
Asset quality
Gross NPAs (` cr)
24,945
25,397
(1.8)
20,752
20.2
Gross NPAs (%)
6.36
6.47
(11)bp
5.7
71bp
Net NPAs (` cr)
15,187
15,394
(1.3)
11,618
30.7
Net NPAs (%)
3.99
4.1
(6)bp
3.3
73bp
Provision Coverage Ratio (%)
61.4
59.3
203bp
59.1
225bp
Slippage ratio (%)
2.7
3.9
(113)bp
4.1
(134)bp
Credit cost (%)
1.4
0.9
47bp
1.2
13bp
Source: Company, Angel Research
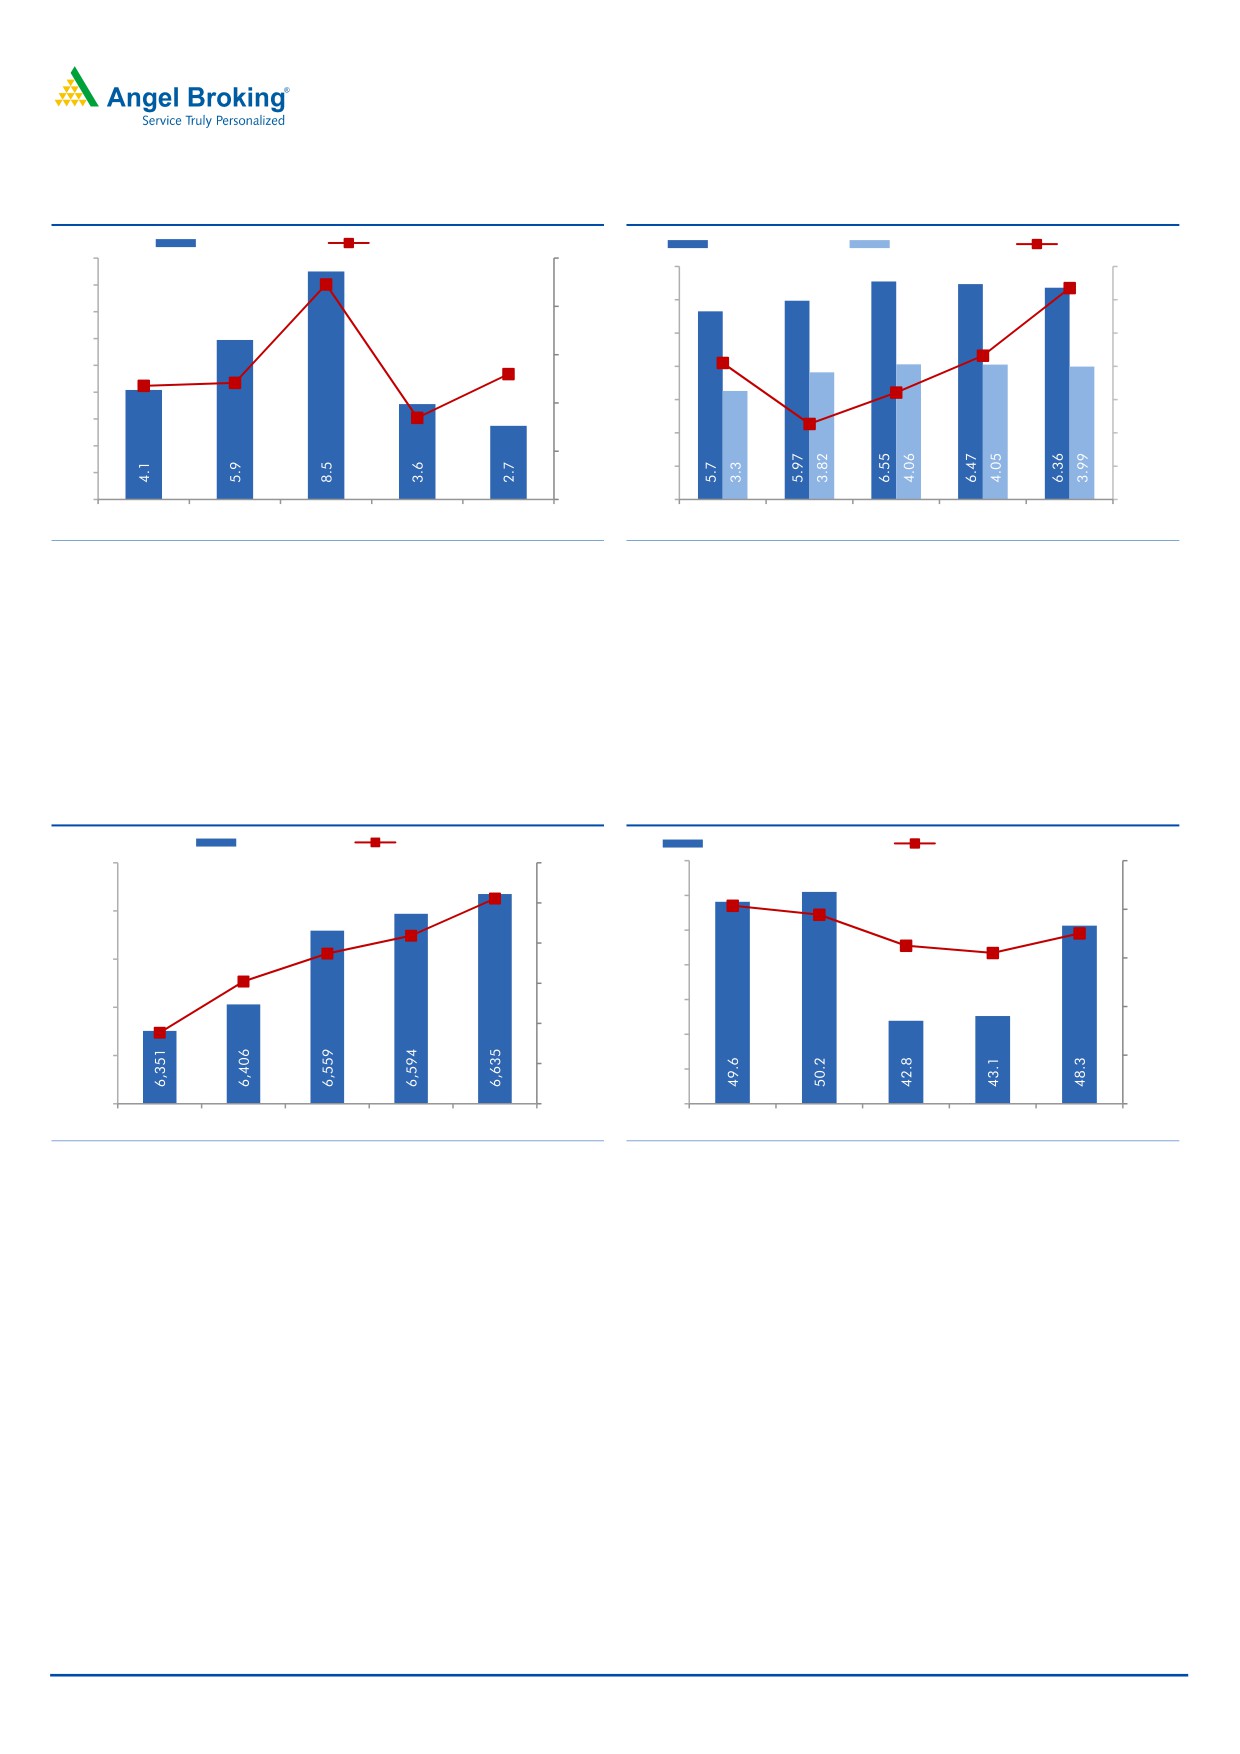
Loan book grows at modest pace; NIM improves qoq
During 2QFY2016, advances and deposits grew by
6.7% and
14.0% yoy,
respectively, with the CD ratio at 70.6%. Domestic advances growth was sluggish
at 6.3% yoy, while international advances saw a modest growth of 9.5% yoy. The
share of overseas advances to total advances constituted 14.1% as against 13.8%
in 2QFY2015. In domestic advances, the retail loan book grew by 23.0% yoy,
aided by 27.6% yoy growth in the housing segment. Growth in industry loans was
modest at 7.6% yoy yoy as the bank was cautious lending to the large industry
segment. CASA deposits grew by 13.4% yoy with Current deposits growing by
25.0% yoy. The Domestic CASA ratio jumped by 129bp qoq to 40.2%, due to the
spurt seen in term deposits. The NIM improved by 7bp qoq to 2.97%, due to
higher yields.
November 13, 2015
3
Punjab National Bank | 2QFY2016 Result Update
Exhibit 3: Cost of funds down by 4bp qoq; 7bp yoy
Exhibit 4: NIM increases by 7bp qoq; dips 21bp yoy
5.25
5.22
(%)
3.30
5.20
3.21
3.18
3.20
5.15
3.10
5.10
5.09
2.97
5.10
5.07
3.00
2.90
5.05
5.03
2.90
2.79
2.80
5.00
2.70
4.95
2.60
2.50
4.90
2QFY15
3QFY15
4QFY15
1QFY16
2QFY16
2QFY15
3QFY15
4QFY15
1QFY16
2QFY16
Source: Company, Angel Research
Source: Company, Angel Research
Weak Non-interest income (excluding treasury)
Other income (excl. treasury) was weak witnessing a decline of 12.8% yoy due to a
decline seen in both fee income and recoveries. Treasury income surged by
33.7% yoy which provided a cushion to the other income to an extent.
Exhibit 5: Treasury aid non-interest income performance to an extent
Particulars (` cr)
2QFY16 1QFY16
% chg (qoq) 2QFY15
% chg (yoy)
Fee based Income
784
943
(16.9)
822
(4.6)
Treasury
337
237
42.2
252
33.7
Recoveries
236
217
8.8
483
(51.1)
Other income
1,357
1,397
(2.9)
1,557
(12.8)
Other income excl. treasury
1,020
1,160
(12.1)
1,305
(21.8)
Source: Company, Angel Research
Asset quality improves for second consecutive quarter
Asset quality improved consecutively for the second quarter as the Gross NPA ratio
decreased by 11bp to 6.36%, while the Net NPA also drifted downwards by 6bp to
3.99%. The bank reported a second consecutive quarter of significant decline in
slippages on a qoq basis to `2,613cr (annualized slippage ratio stood at 2.8%) as
compared to `3,382cr in 1QFY2016. Out of the total slippages, fresh slippage for
the quarter was to the tune of `2,388cr while fresh restructuring during the quarter
was lower at
`216cr as against
`676cr in 1QFY2016. The outstanding
restructured book stood at `38,261cr, 10.3% of the loan book.
November 13, 2015
4
Punjab National Bank | 2QFY2016 Result Update
Exhibit 6: Slippages ratio falls sharply qoq
Exhibit 7: ...resulting in lower Gross NPA ratio qoq
Slippages (%)
Credit cost (%, RHS)
Gross NPAs (%)
Net NPAs (%)
PCR (%, RHS)
9.0
2.2
2.5
7.0
61.4
62.0
8.0
6.0
61.0
7.0
2.0
5.0
59.3
60.0
6.0
59.1
1.3
1.5
1.2
1.2
5.0
4.0
58.2
59.0
4.0
0.8
1.0
3.0
57.3
58.0
3.0
2.0
57.0
2.0
0.5
1.0
56.0
1.0
-
-
-
55.0
2QFY15
3QFY15
4QFY15
1QFY16
2QFY16
2QFY15
3QFY15
4QFY15
1QFY16
2QFY16
Source: Company, Angel Research
Source: Company, Angel Research;
Cost-to-income ratio improves
Operating expense was under control which declined 3.3% yoy marked by a
7.7% yoy decline in staff expenses. A lower opex and an improvement in NIM of
7bp enabled the bank to reduce cost/income ratio by 137bp yoy to 48.3% given
the fact that the bank also opened 41 new branches during the quarter.
Exhibit 8: Steady branch expansion continues
Exhibit 9: Cost to income ratio decreases yoy
Branches
ATMs (RHS)
Cost-to-income ratio (%)
Opex to average assets (%, RHS)
6,700
8,622
8,800
52.0
2.5
2.0
50.0
1.9
8,437
8,600
6,600
8,348
1.8
2.0
1.6
48.0
1.6
8,400
8,209
6,500
1.5
46.0
8,200
44.0
6,400
7,954
1.0
8,000
42.0
6,300
0.5
7,800
40.0
6,200
7,600
38.0
-
2QFY15
3QFY15
4QFY15
1QFY16
2QFY16
2QFY15
3QFY15
4QFY15
1QFY16
2QFY16
Source: Company, Angel Research
Source: Company, Angel Research
Outlook and valuation
PNB has been witnessing improvement in asset quality since the past 2 quarters
after severe asset quality pain over the previous several quarters. In our view, we
expect asset quality pressure to ease from here on given the bank’s seasoned loan
book and conservative lending approach followed by the bank as compared to its
peers. At the current market price, the stock trades at 0.6x FY2017E ABV.
However, given the stress in certain sectors of the economy and with PNB having a
meaningful exposure to these stressed sectors, we would follow a cautious stance
in the near-term. Hence, we recommend a Neutral rating on the stock.
November 13, 2015
5
Punjab National Bank | 2QFY2016 Result Update
Exhibit 10: Recommendation summary
CMP
Tgt. Price
Upside
FY2017E
FY2017E
FY2017E
FY15-17E
FY2017E
FY2017E
Company
Reco.
(`)
(`)
(%)
P/ABV (x)
Tgt. P/ABV (x)
P/E (x)
EPS CAGR (%)
RoA (%)
RoE (%)
HDFCBk
Buy
1,054
1,262
19.7
3.2
3.8
17.3
22.4
1.9
19.7
ICICIBk*
Buy
262
348
32.5
1.8
2.0
10.4
15.3
1.6
15.2
YesBk
Buy
740
914
23.5
1.9
2.4
10.7
20.2
1.6
19.6
AxisBk
Buy
469
630
34.4
1.9
2.6
10.8
18.4
1.8
18.9
SBI*
Buy
241
283
17.3
1.2
1.2
9.9
17.8
0.7
12.8
FedBk
Neutral
54
-
-
1.0
1.0
8.6
3.1
1.0
11.9
SIB
Neutral
20
-
-
0.7
0.8
6.2
21.6
0.7
11.6
BOB
Neutral
173
-
-
0.9
0.9
8.2
17.5
0.6
10.6
PNB
Neutral
134
-
-
0.6
0.6
4.9
28.5
0.7
12.0
BOI
Neutral
132
-
-
0.3
0.8
4.0
14.0
0.3
7.6
IndBk
Neutral
127
-
-
0.4
0.4
4.2
19.4
0.7
9.3
Vijaya Bank
Neutral
34
-
-
0.5
0.5
5.1
14.1
0.4
8.8
OBC
Neutral
148
-
-
0.3
0.5
3.3
65.5
0.5
9.4
Allahabad Bank Neutral
77
-
-
0.3
0.3
3.0
53.5
0.6
10.9
UnionBk
Neutral
161
-
-
0.5
0.4
4.1
18.1
0.6
11.4
CanBk
Neutral
273
-
-
0.4
0.3
4.0
9.8
0.5
10.7
IDBI#
Neutral
77
-
-
0.3
0.4
3.0
53.5
0.6
10.9
DenaBk
Neutral
88
-
-
0.6
0.6
6.2
61.6
0.6
9.3
Source: Company, Angel Research; Note:*Target multiples=SOTP Target Price/ABV (including subsidiaries), #Without adjusting for SASF
November 13, 2015
6
Punjab National Bank | 2QFY2016 Result Update
Company Background
Punjab National Bank is the country's third-largest PSU bank, with a balance sheet
size of around `6.34lakh cr and a pan-India network of around 6,635 branches.
The bank's network is primarily spread across north India, ie in Punjab, Haryana
and Uttar Pradesh. Almost 64% of its branches are based in rural and semi-urban
hinterland, which results in a large legacy of low-cost CASA deposits.
November 13, 2015
7
Punjab National Bank | 2QFY2016 Result Update
Income statement
Y/E March (` cr)
FY12
FY13
FY14
FY15
FY16E
FY17E
Net Interest Income
13,414
14,857
16,146
16,556
17,101
19,343
- YoY Growth (%)
13.6
10.8
8.7
2.5
3.3
13.1
Other Income
4,203
4,216
4,577
5,891
6,537
7,213
- YoY Growth (%)
16.3
0.3
8.6
28.7
11.0
10.3
Operating Income
17,617
19,073
20,723
22,446
23,638
26,557
- YoY Growth (%)
14.2
8.3
8.7
8.3
5.3
12.3
Operating Expenses
7,003
8,165
9,338
10,492
10,544
11,598
- YoY Growth (%)
10.0
16.6
14.4
12.3
0.5
10.0
Pre - Provision Profit
10,614
10,908
11,384
11,955
13,094
14,958
- YoY Growth (%)
17.2
2.8
4.4
5.0
9.5
14.2
Prov. & Cont.
3,577
4,386
6,694
7,998
8,217
7,529
- YoY Growth (%)
43.6
22.6
52.6
19.5
2.7
(8.4)
Profit Before Tax
7,037
6,522
4,691
3,957
4,877
7,430
- YoY Growth (%)
7.2
(7.3)
(28.1)
(15.6)
23.3
52.3
Prov. for Taxation
2,153
1,774
1,348
895
1,561
2,378
- as a % of PBT
30.6
27.2
28.7
22.6
32.0
32.0
PAT
4,884
4,748
3,343
3,061
3,316
5,052
- YoY Growth (%)
10.2
(2.8)
(29.6)
(8.4)
8.3
52.3
Balance sheet
Y/E March (` cr)
FY12
FY13
FY14
FY15
FY16E
FY17E
Share Capital
339
354
362
371
371
371
Reserve & Surplus
27,476
32,323
35,533
38,707
41,286
45,231
Deposits
3,79,588
3,91,560
4,51,397
5,01,379
5,56,530
6,28,879
- Growth (%)
21.3
3.2
15.3
11.1
11.0
13.0
Borrowings
26,074
28,726
36,404
34,331
36,570
41,128
Tier 2 Capital
11,190
10,895
11,630
11,340
11,056
10,780
Other Liab. & Prov.
13,524
15,019
15,093
17,206
19,098
21,387
Total Liabilities
4,58,192
4,78,877
5,50,420
6,03,334
6,64,911
7,47,775
Cash Balances
18,493
17,886
22,246
24,225
27,827
31,444
Bank Balances
10,335
9,249
22,973
31,709
34,945
39,301
Investments
1,22,703
1,29,896
1,43,786
1,51,282
1,70,301
1,89,274
Advances
2,93,775
3,08,725
3,49,269
3,80,534
4,14,782
4,68,704
- Growth (%)
21.3
5.1
13.1
9.0
9.0
13.0
Fixed Assets
3,169
3,358
3,420
3,552
3,797
4,142
Other Assets
9,718
9,763
8,727
12,031
13,259
14,912
Total Assets
4,58,192
4,78,877
5,50,420
6,03,334
6,64,911
7,47,775
- Growth (%)
21.1
4.5
14.9
9.6
10.2
12.5
November 13, 2015
8
Punjab National Bank | 2QFY2016 Result Update
Ratio analysis
Y/E March
FY12
FY13
FY14
FY15
FY16E
FY17E
Profitability ratios (%)
NIMs
3.3
3.3
3.2
2.9
2.8
2.8
Cost to Income Ratio
39.8
42.8
45.1
46.7
44.6
43.7
RoA
1.2
1.0
0.6
0.5
0.5
0.7
RoE
21.1
16.5
10.2
8.5
8.5
12.0
B/S ratios (%)
CASA Ratio
35.3
39.2
38.3
36.7
37.0
37.3
Credit/Deposit Ratio
77.4
78.8
77.4
75.9
74.5
74.5
CAR
12.6
12.3
12.1
11.9
11.3
10.9
- Tier I
9.3
9.4
9.3
9.3
9.0
8.8
Asset Quality (%)
Gross NPAs
2.9
4.3
5.3
6.6
8.5
8.4
Net NPAs
1.5
2.3
2.8
4.0
4.5
3.5
Slippages
2.7
2.9
3.4
5.3
4.9
3.7
Loan Loss Prov. /Avg. Assets
0.6
0.7
0.9
1.4
1.3
1.0
Provision Coverage
62.7
58.8
59.1
57.5
60.0
67.5
Per Share Data (`)
EPS
28.8
26.9
18.5
16.5
17.9
27.2
ABVPS (75% cover.)
146.7
160.4
168.7
168.9
179.6
218.0
DPS
22.0
27.0
10.0
17.3
17.0
25.5
Valuation Ratios
PER (x)
4.8
5.1
7.4
8.3
7.7
5.0
P/ABVPS (x)
0.9
0.9
0.8
0.8
0.8
0.6
Dividend Yield
16.0
19.7
7.3
12.6
12.4
18.6
DuPont Analysis
NII
3.2
3.2
3.1
2.9
2.7
2.7
(-) Prov. Exp.
0.9
0.9
1.3
1.4
1.3
1.1
Adj. NII
2.4
2.2
1.8
1.5
1.4
1.7
Treasury
0.1
0.1
0.1
0.2
0.2
0.2
Int. Sens. Inc.
2.4
2.3
1.9
1.6
1.6
1.9
Other Inc.
0.9
0.8
0.8
0.9
0.8
0.8
Op. Inc.
3.4
3.1
2.7
2.5
2.4
2.7
Opex
1.7
1.7
1.8
1.8
1.7
1.6
PBT
1.7
1.4
0.9
0.7
0.8
1.1
Taxes
0.5
0.4
0.3
0.2
0.2
0.3
RoA
1.2
1.0
0.6
0.5
0.5
0.7
Leverage
18.0
16.3
15.7
16.0
16.3
16.7
RoE
21.1
16.5
10.2
8.5
8.5
12.0
November 13, 2015
9
Punjab National Bank | 2QFY2016 Result Update
Research Team Tel: 022 - 39357800
DISCLAIMER
Angel Broking Private Limited (hereinafter referred to as “Angel”) is a registered Member of National Stock Exchange of India Limited,
Bombay Stock Exchange Limited and Metropolitan Stock Exchange of India Limited. It is also registered as a Depository Participant with
CDSL and Portfolio Manager with SEBI. It also has registration with AMFI as a Mutual Fund Distributor. Angel Broking Private Limited is
a registered entity with SEBI for Research Analyst in terms of SEBI (Research Analyst) Regulations, 2014 vide registration number
INH000000164. Angel or its associates has not been debarred/ suspended by SEBI or any other regulatory authority for accessing
/dealing in securities Market. Angel or its associates including its relatives/analyst do not hold any financial interest/beneficial
ownership of more than 1% in the company covered by Analyst. Angel or its associates/analyst has not received any compensation /
managed or co-managed public offering of securities of the company covered by Analyst during the past twelve months. Angel/analyst
has not served as an officer, director or employee of company covered by Analyst and has not been engaged in market making activity
of the company covered by Analyst.
This document is solely for the personal information of the recipient, and must not be singularly used as the basis of any investment
decision. Nothing in this document should be construed as investment or financial advice. Each recipient of this document should
make such investigations as they deem necessary to arrive at an independent evaluation of an investment in the securities of the
companies referred to in this document (including the merits and risks involved), and should consult their own advisors to determine
the merits and risks of such an investment.
Reports based on technical and derivative analysis center on studying charts of a stock's price movement, outstanding positions and
trading volume, as opposed to focusing on a company's fundamentals and, as such, may not match with a report on a company's
fundamentals.
The information in this document has been printed on the basis of publicly available information, internal data and other reliable
sources believed to be true, but we do not represent that it is accurate or complete and it should not be relied on as such, as this
document is for general guidance only. Angel Broking Pvt. Limited or any of its affiliates/ group companies shall not be in any way
responsible for any loss or damage that may arise to any person from any inadvertent error in the information contained in this report.
Angel Broking Pvt. Limited has not independently verified all the information contained within this document. Accordingly, we cannot
testify, nor make any representation or warranty, express or implied, to the accuracy, contents or data contained within this document.
While Angel Broking Pvt. Limited endeavors to update on a reasonable basis the information discussed in this material, there may be
regulatory, compliance, or other reasons that prevent us from doing so.
This document is being supplied to you solely for your information, and its contents, information or data may not be reproduced,
redistributed or passed on, directly or indirectly.
Neither Angel Broking Pvt. Limited, nor its directors, employees or affiliates shall be liable for any loss or damage that may arise from
or in connection with the use of this information.
Note: Please refer to the important ‘Stock Holding Disclosure' report on the Angel website (Research Section). Also, please refer to the
latest update on respective stocks for the disclosure status in respect of those stocks. Angel Broking Pvt. Limited and its affiliates may
have investment positions in the stocks recommended in this report.
Disclosure of Interest Statement
Punjab National Bank
1. Analyst ownership of the stock
No
2. Angel and its Group companies ownership of the stock
No
3. Angel and its Group companies' Directors ownership of the stock
No
4. Broking relationship with company covered
No
Note: We have not considered any Exposure below ` 1 lakh for Angel, its Group companies and Directors
Ratings (Based on expected returns
Buy (> 15%)
Accumulate (5% to 15%)
Neutral (-5 to 5%)
over 12 months investment period):
Reduce (-5% to -15%)
Sell (< -15%)
November 13, 2015
10