2QFY2016 Result Update | Capital Goods
November 16, 2015
Power Mech Projects
NEUTRAL
CMP
`606
Performance Highlights
Target Price
-
Quarterly highlights - Standalone
Investment Period
-
Y/E March (` cr)
2QFY16 1QFY15 2QFY15
% chg (yoy)
% chg (qoq)
Stock Info
Net sales
317
301
316
0.3
5.2
Sector
Capital Goods
EBITDA
43
40
38
13.0
7.4
Market Cap (` cr)
891
Reported PAT
18
16
15
23.3
12.7
Net debt (` cr)
160
Source: Company, Angel Research
Beta
Power Mech Projects (Power Mech) reported flat yoy sales for 2QFY2016. The
52 Week High / Low
663/565
Avg. Daily Volume
43,448
company reported a top-line of `317cr, which is up 0.3% yoy from the year ago
Face Value (`)
10
levels. The EBITDA, at `43cr in 2QFY2016, grew 13.0% yoy. Despite flat sales,
BSE Sensex
25,611
the EBITDA margin of the company expanded on a yoy basis to 13.5% for
Nifty
7,762
2QFY2016. In-line with EBITDA growth, Power Mech reported a PAT of `18cr for
Reuters Code
POMP.NS
the quarter, reflecting 23.3% yoy growth. A 3.2% yoy decline in depreciation
Bloomberg Code
POWM@IN
expenses (to `9cr) and decline in effective tax rate (from 35.4% a year ago to
33.9% in the quarter) helped the company report a 107bp yoy PAT margin
Shareholding Pattern (%)
expansion.
Promoters
64.8
MF / Banks / Indian Fls
17.6
Power Mech’s order book as of 2QFY2016-end stood at `3,700cr, reflecting
FII / NRIs / OCBs
1.0
order book to LTM ratio of 2.2x.
Indian Public / Others
16.6
Valuation: On considering Power Mech’s 2QFY2016 order book of `3,700cr
(which gives strong earnings growth visibility), negligible debt on the books, and
Abs. (%)
3m 1yr 3yr
higher return ratios (RoE of Power Mech is higher than that of its peers), we
Sensex
(8.8)
(8.7)
38.6
PowerMech
3.4
NA NA
assign a 9.0x 1-year forward P/E multiple to our FY2017E, EPS estimate of
*NA- Not Applicable as PowerMech got listed on Aug 26, 2015
`72/share to arrive at a price target of `649/share. Given the limited upside, we
maintain our Neutral rating on the stock.
3-Year Daily Price Chart
660
Key financials (Standalone)
640
Y/E March (` cr)
FY13
FY14
FY15
FY16E
FY17E
620
600
Net Sales
933
1,187
1,356
1,539
1,801
580
560
% chg
42.4
27.3
14.2
13.6
17.0
540
Net Profit
50
68
71
87
106
520
% chg
(0.4)
36.3
3.5
22.7
22.1
EBITDA (%)
13.0
13.0
12.2
12.8
12.7
Source: Company, Angel Research
EPS (`)
46.6
62.4
56.2
59.0
72.1
P/E (x)
13.0
9.7
10.8
10.3
8.4
P/BV (x)
3.2
2.4
2.2
1.5
1.3
RoE (%)
28.0
28.7
22.5
18.6
16.8
RoCE (%)
32.8
35.1
26.5
24.7
24.0
EV/Sales (x)
0.8
0.6
0.7
0.6
0.5
Yellapu Santosh
022 - 3935 7800 Ext: 6811
EV/EBITDA (x)
5.9
4.9
5.6
4.5
3.9
Source: Company, Angel Research; CMP as of November 13, 2015
Please refer to important disclosures at the end of this report
1
PowerMech | 2QFY2016 Result Update
Exhibit 1: Quarterly Performance (Standalone)
Particulars (` cr)
2QFY16
1QFY16
% chg (qoq) 2QFY15
% chg (yoy) 1HFY16 1HFY15
% chg (yoy)
Net Sales
317
301
5.2
316
0.3
618
663
(6.7)
Total Expenditure
274
262
4.9
278
(1.5)
536
579
(7.5)
Cost of materials consumed
21
21
(3.4)
16
28.6
42.1
33.7
24.9
Contract Execution Exp.
221
206
7.3
229
(3.4)
426.8
478.4
(10.8)
Employee benefits Expense
26
28
(6.3)
29
(9.2)
54.6
59.2
(7.7)
Other Expenses
6
6
3.8
4
43.6
12.3
7.8
57.0
EBITDA
43
40
7.4
38
13.0
82.6
83.5
(1.0)
EBIDTA %
13.5
13.2
12.0
13.4
12.6
Depreciation
9
9
(2.0)
9
(3.2)
18.1
18.0
1.0
EBIT
34
31
10.2
29
18.2
64.5
65.5
(1.6)
Interest and Financial Charges
8
8
1.6
7
6.1
15.6
13.5
15.5
Other Income
1
2
(6.5)
2
(5.6)
3.0
4.1
(26.3)
PBT before Exceptional Items
27
24
11.8
23
20.6
51.9
56.1
(7.5)
Exceptional Items
0
0
0
0.0
0.0
PBT after Exceptional Items
27
24
11.8
23
20.6
51.9
56.1
Tax
9.3
8
10.1
8
15.5
17.7
18.5
% of PBT
33.9
34.5
35.4
34.2
33.1
PAT
18
16
12.7
15
23.3
34.1
37.5
(9.1)
Adj. PAT %
5.7
5.3
4.6
5.5
5.7
Dil. EPS
13.02
12.75
2.1
12.04
8.1
24.57
30.62
(19.8)
Source: Company, Angel Research
Revenues grow 0.3% yoy
Power Mech reported flat yoy sales for the quarter. The company reported a top-
line of `317cr, which is up 0.3% yoy from the year ago levels. Lower revenue
booking from recently won projects, led to flattish yoy top-line growth.
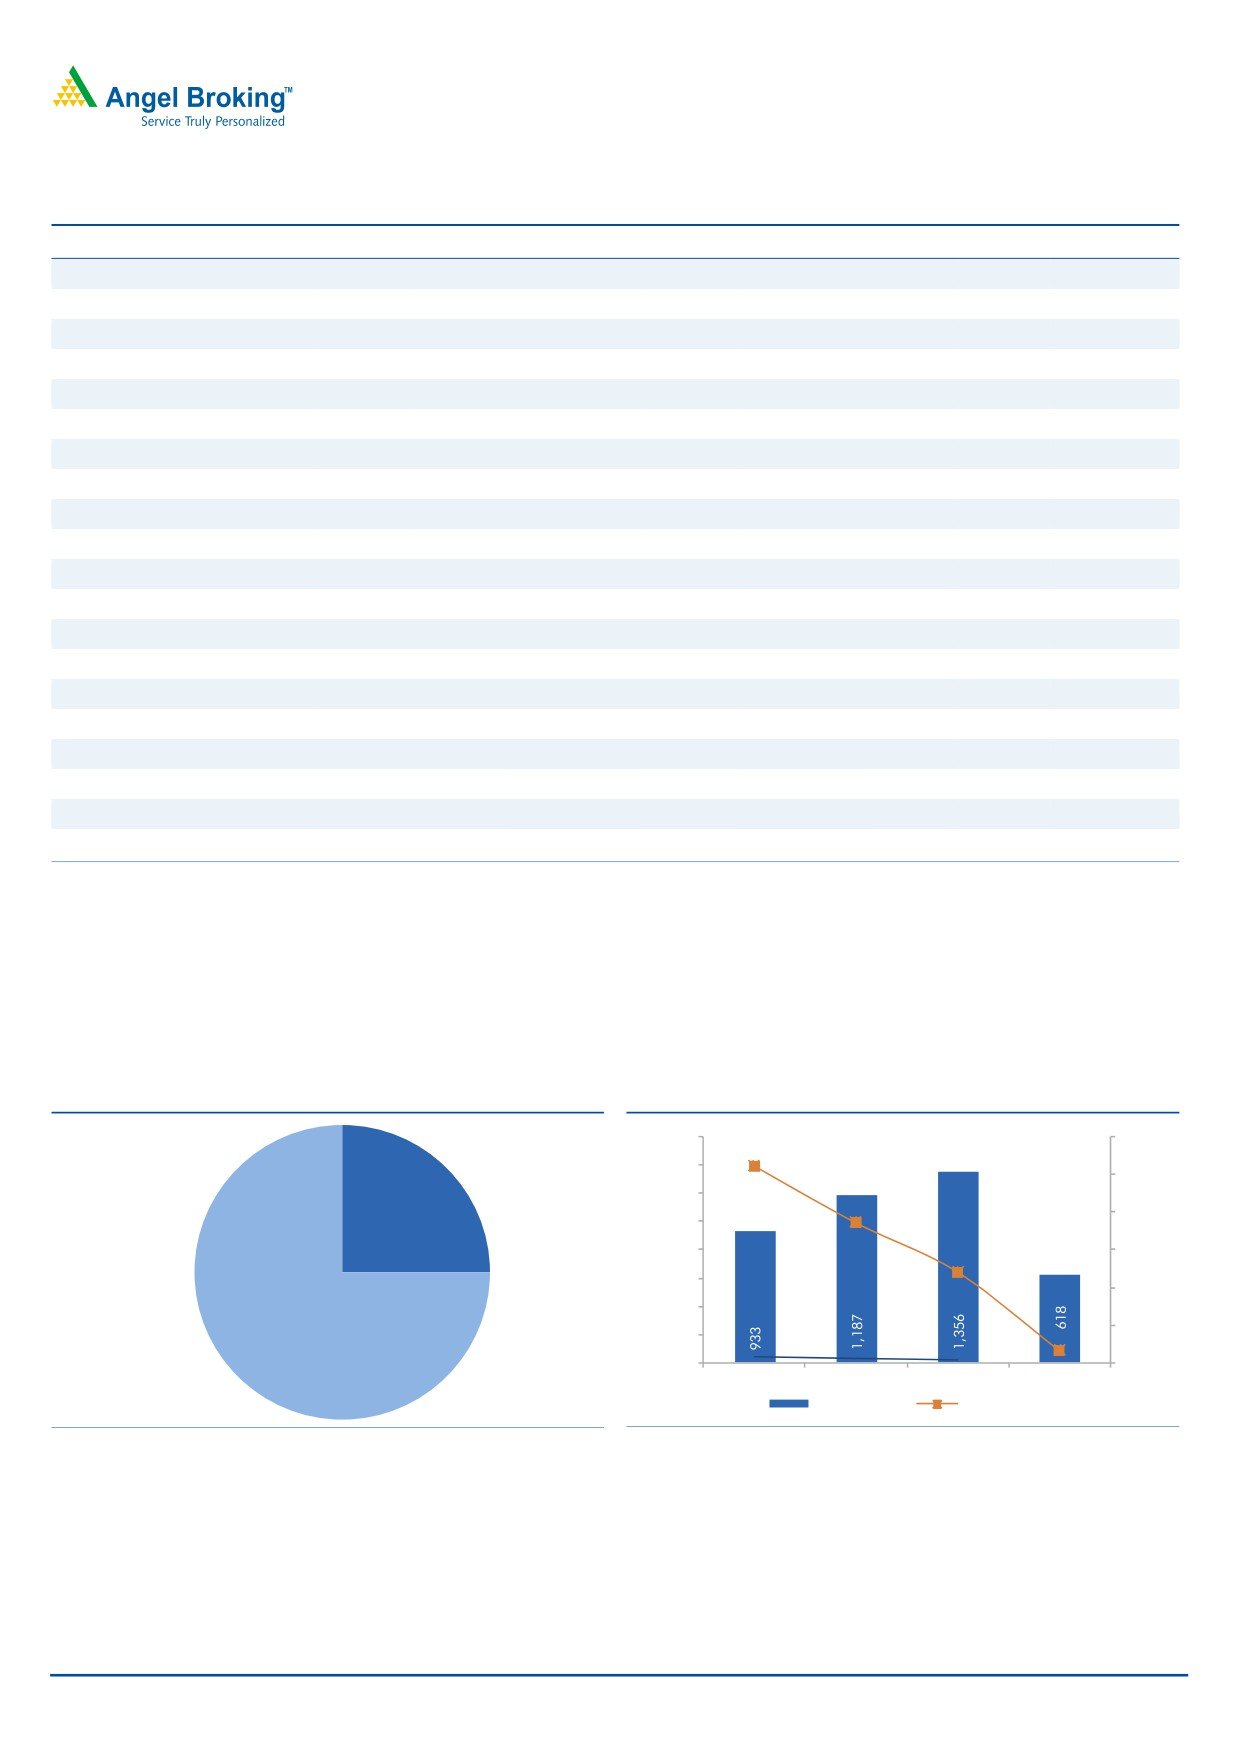
Exhibit 2: Segment-wise 2QFY2016 Revenue split
Exhibit 3: Revenue trend
1,600
50.0
1,400
42.4
40.0
1,200
O&M, 25%
30.0
1,000
27.3
800
20.0
14.2
600
10.0
400
Erectiom &
0.0
Civil
200
Works, 75%
-6.7
0
-10.0
FY13
FY14
FY15
1HFY16
Revenues
yoy growth (%)
Source: Company, Angel Research
Source: Company, Angel Research
Reports yoy EBITDA margin expansion
Power Mech reported an EBITDA of `43cr in 2QFY2016, reflecting 13.0% yoy
growth. Despite flat sales, the EBITDA margin expanded on a yoy basis to 13.5%
for 2QFY2016. Margin expansion is owing to higher revenue contribution from the
November 16, 2015
2
PowerMech | 2QFY2016 Result Update
O&M segment. Our view strengthened from the point that Contract execution
expenses as % of sales declined from 72.4% a year ago to 69.7% in 2QFY2016.
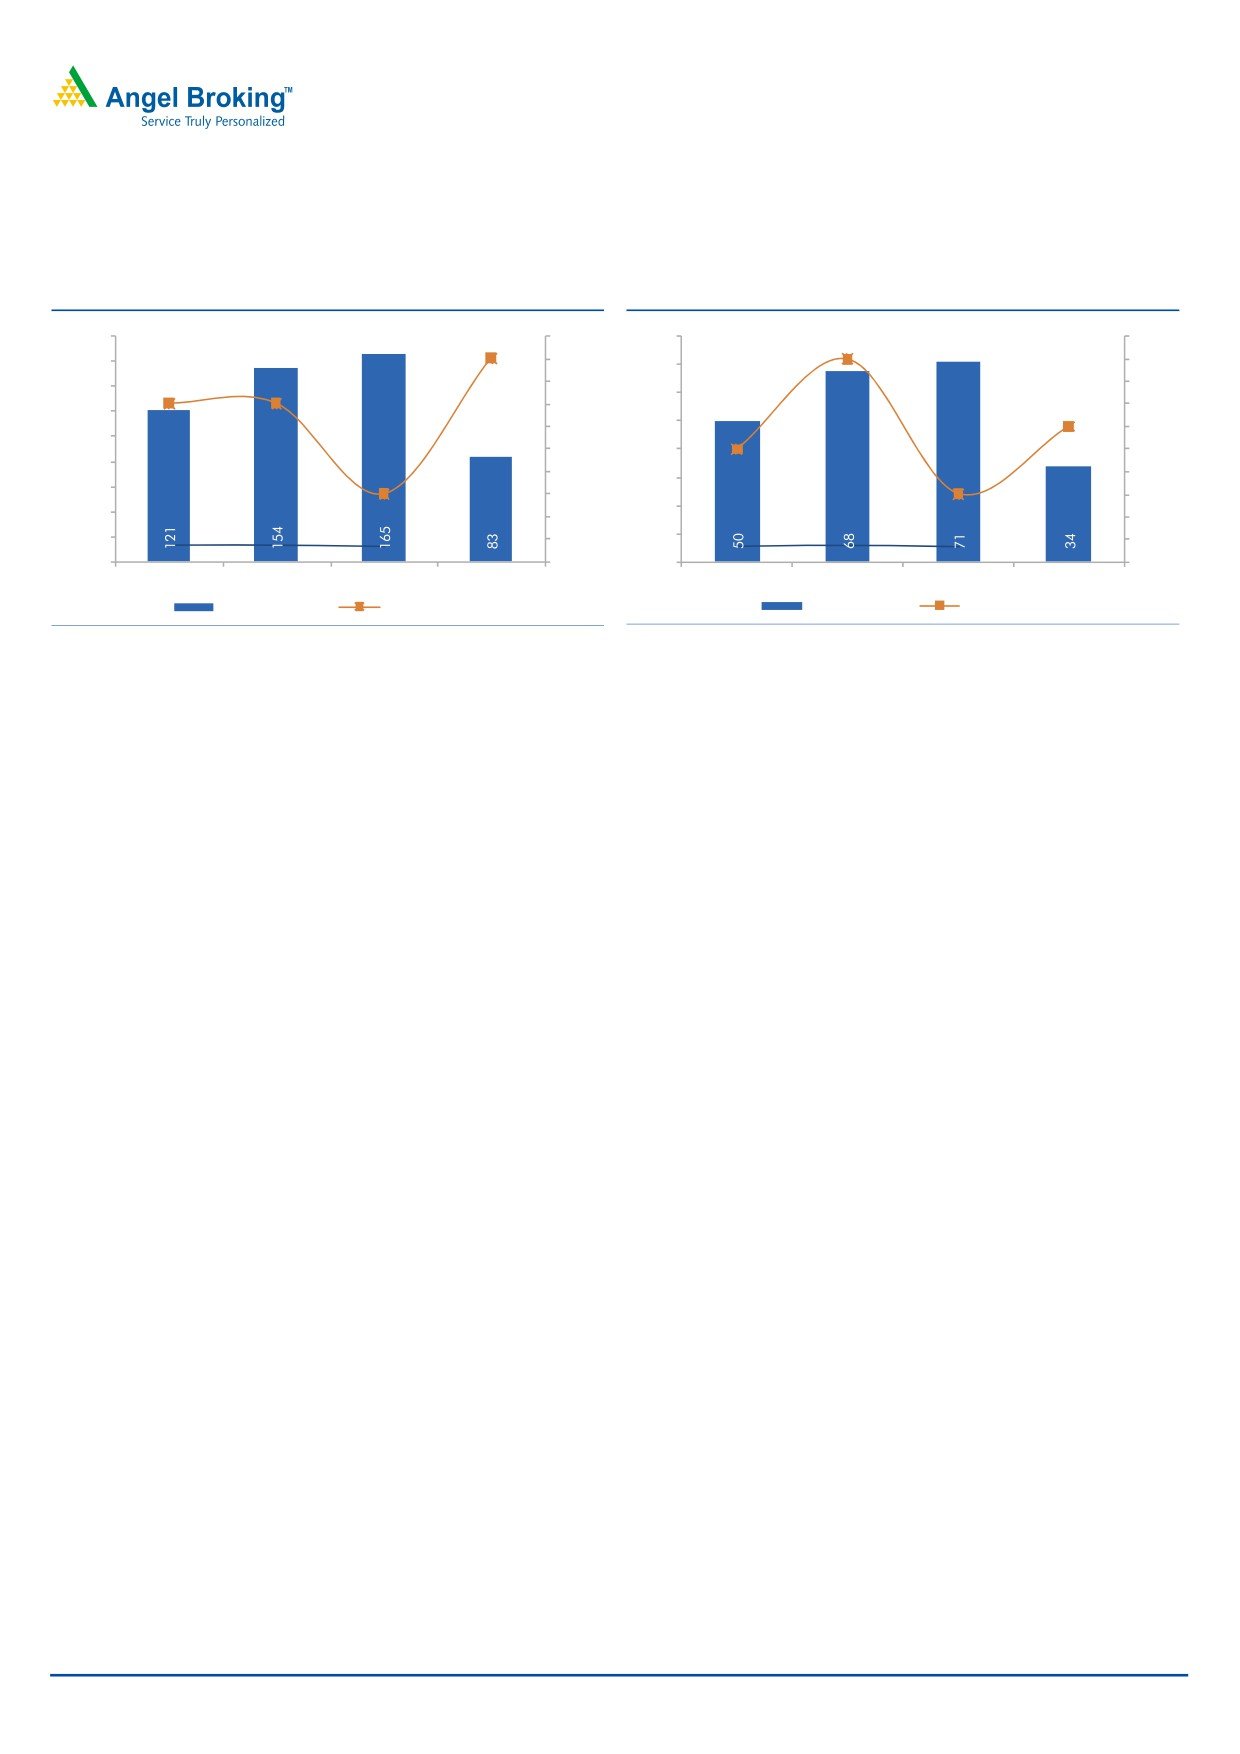
Exhibit 4: EBITDA margins expand
Exhibit 5: PAT Margins at 5.5%
180
13.4
13.6
80
5.8
5.9
160
13.4
5.8
70
140
13.0
13.0
13.2
5.7
60
13.0
5.5
5.6
120
50
12.8
5.4
5.5
100
12.6
40
5.4
80
12.2
12.4
5.2
5.3
30
60
12.2
5.2
20
40
12.0
5.1
20
11.8
10
5.0
0
11.6
0
4.9
FY13
FY14
FY15
1HFY16
FY13
FY14
FY15
1HFY16
EBITDA (` in cr)
EBITDA Margin (%)
PAT (` in cr)
PAT Margin (%)
Source: Company, Angel Research
Source: Company, Angel Research
PAT margins improve yoy
In-line with EBITDA growth, Power Mech reported a PAT of `18cr for the quarter,
reflecting 23.3% yoy growth. A 3.2% yoy decline in depreciation expenses (to `9cr)
and decline in effective tax rate (from 35.4% year ago to 33.9% in 2QFY2016)
helped the company report a 107bp yoy PAT margin expansion.
Reports `1,150cr of Order Inflows for 2QFY2016
Power Mech in 1HFY2016 reported `1,150cr of order inflows, led by both,
Erection and O&M segments. Some of the key projects won during 1HFY2016
include- Vedanta’s Jharsuguda project worth `422cr, Kottagudem project worth
`165cr; JP Group’s `166cr O&M order for Bara project, and `90cr order from
Neyveli.
Post these order wins, the company’s order book at 2QFY2016 adds up to
`3,700cr, reflecting order book to LTM ratio of 2.2x. Again a major 45% of the
order book is from the Erection segment, 35% from the O&M space and the
remaining 20% from the Civil segment.
The Management highlighted that they are participating in bid pipeline of over
`2,200cr (O&M projects-`800cr, Erection projects- `1,400cr), where outcome is
pending in the next few months. The Management has maintained optimism that it
would report ~`2,000cr of order wins in FY2016E.
November 16, 2015
3
PowerMech | 2QFY2016 Result Update
Investment arguments
Order book/LTM sales at 2.3x… depicting good revenue visibility
Power Mech, as of 2QFY2016-end, is sitting on an order book (exc. suspended
projects) of `3,700cr, which is 2.2x its last twelve month (LTM) revenues, thereby
giving good near-to-medium term revenue visibility.
Order inflow to benefit from uptick in award activity
Power Mech reported a 19.0% top-line and 17.1% bottom-line CAGR (during
FY2011-15) in a challenging macro environment. This was in an environment,
when the entire power generation sector had been facing structural problems such
as fuel unavailability, deteriorating financial health of SEBs, and difficulty in getting
requisite clearances, amongst other issues. The new government’s steps such as,
targeting to double Coal India (CIL)’s production by 2020 (some signs of ramp-up
in operations are already being seen), fastening the clearances process for large
ticket projects, and opening the mining sector to private players, reflect the
government’s focus towards reviving the ailing power generation sector.
We expect over 20GW of power projects (with different packages of BoP/BTG/EPC
works) to come-up for awarding in FY2016-17E and companies like Power Mech
should emerge as key beneficiaries on account of the same.
Power Mech claims it has limited competition when it comes to comprehensive
packages coming up for awarding; whereas, it faces competition from over half a
dozen players for smaller ticket projects. Based on their past track record and
market positioning, we expect Power Mech to report order wins of
`2,000cr/`2,500cr in FY2016E/FY2017E.
Strong profitability growth to be seen during FY2015-17E
At the backdrop of order inflow growth and average execution cycle of 25-36
months (for O&M contracts, the execution cycle stretches to 36 months), we expect
Power Mech to report strong 15.3% top-line and 22.4% bottom-line CAGR during
FY2015-17E.
Power Mech reported ~20% of its FY2015 revenues from the high margin O&M
business. Increased exposure to the O&M segment, which happens to be a high
EBITDA margin business, should act as a cushion to the company’s overall EBITDA
margins. Accordingly, we model 12.8%/12.7% EBITDA margins for FY2016/
2017E, respectively.
With the IPO proceeds likely to be deployed for retiring working capital debt, we
expect savings on interest expenses, which should result in 22.4% PAT CAGR
during FY2015-17E to `106cr.
Restricted WC cycle leads to unlevered Balance Sheet…
Power Mech is one of the few companies that has been able to hold on to its WC
cycle despite deteriorating health of its clients. This could be owing to the following
reasons: (1) tendering by equipment manufacturers is made only after land
acquisition is done and all clearances are in place (2) scope of works for ETC
companies is usually 13-20% of the BTG/BOP packages, (3) company has a policy
of billing clients once in a month instead of milestone based payments cycle
November 16, 2015
4
PowerMech | 2QFY2016 Result Update
followed by EPC players. These reasons have led to a superior WC cycle for Power
Mech in comparison to its peers.
Power Mech enjoys a better WC/sales ratio in comparison to its peers. In FY2015,
Power Mech reported a WC/sales ratio of 21.1% vs a comparable 34.7% average
of two of its closest industry peers - Sunil Hitech and TechnoElectric Engineering.
Owing to shorter WC cycle, Power Mech has been able to maintain its debt/equity
ratio at comfortable levels of 0.6x (as of FY2015-end). With `105cr of IPO
proceeds to be used towards retirement of debt, we expect the D/E ratio to further
decline, going forward.
Better RoEs …
Diversification of Power Mech across sub-verticals within the power sector helped
the company build its order book in an atmosphere where peers were experiencing
decline in order inflows. Driven by continuously increasing order book, Power
Mech reported a strong 19.0% top-line and 17.1% bottom-line CAGR during
FY2011-15. On the back of strong earnings growth, Power Mech reported an
above-industry RoE of 22.5-28% during FY2013-15, respectively. Considering our
earnings growth estimates and diluted equity, we expect RoEs in FY2016/FY2017E
to decline to 18.6%/16.8%, respectively, which is still impressive.
November 16, 2015
5
PowerMech | 2QFY2016 Result Update
Outlook & Valuation
During FY2011-15, Power Mech (standalone entity) reported a 19.0% and 17.1%
top-line and bottom-line CAGR, respectively. The company’s diversification
strategy has helped it grow its order book in a awarding down cycle. Recent
initiatives by the government strengthen our view that over 20GW of awarding by
state run entities (SEBs/NTPC) would be made to power generation equipment
manufacturers in FY2016-17E, which in-turn enhances the bid pipeline for ETC
companies like Power Mech.
With order inflow revival in the power generation space, we are optimistic that
Power Mech would emerge as one of the key beneficiaries, going forward. We
expect the order book of Power Mech to report a healthy 16.6% CAGR during
FY2015-2017E to `4,377cr by FY2017E. This, when coupled with Power Mech’s
focus to add more of high margin O&M works to its order book, should act as a
cushion against any further fall in the EBITDA margin. Accordingly, we model
12.8%/ 12.7% EBITDA margin for FY2016E/FY2017E. We expect EBITDA to report
a 17.5% CAGR during FY2015-17E.
In addition to EBITDA growth, we expect benefits flowing-in from a lower interest
expense (considering that `105cr of IPO proceeds would be used for debt
repayment). On the whole, we expect the standalone entity to report a 22.4%
bottom-line CAGR during FY2015-17E to `109cr.
On considering Power Mech’s 2QFY2016 order book of `3,700cr (which gives
strong earnings growth visibility), negligible debt on the books, and higher return
ratios (RoE of Power Mech is higher than its peers), we assign a 9.0x 1-year
forward P/E multiple to our FY2017E EPS of `72/share to arrive at a price target of
`649/share. Given the limited upside, we maintain our Neutral rating on the stock.
November 16, 2015
6
PowerMech | 2QFY2016 Result Update
Risks & Concerns
Prolonged delay in the award activity could act as risk to our estimates.
Higher than expected loss of market share in the ETC-BTG/BOP awarding
cycle could again act as a threat to our estimates and view.
56.4% of FY2015 order book came from top 5 clients (declined from 64.7% in
FY2014). Any change in outlook of these companies could act as a big risk to
our view and estimates.
Company background
Power Mech, incorporated in 1999, was founded by Mr Kishore Babu. Over the
years, Power Mech has emerged as a leading integrated power infrastructure
services player at a pan-India level. The company is in the business of providing
Erection, Testing and Commissioning (ETC) of Boilers, Turbines and Generators
(BTG) and Balance of Plant (BOP) works. Also, in recent years Power Mech has
built capabilities in Civil Works and power plants’ Operation and Maintenance
(O&M) services.
Erection Works: Since commencing its operations in 2003, Power Mech has
worked on more than 100 erection works projects. To-date, it has been involved in
100+ Erection works contracts. Power Mech provides ETC works for both-BTG and
BOP space of the power plants, including Ultra-Mega Power Plants (UMPPs) and
Super-critical power plants with unit capacities in150-800MW. It also provides
erection work services to gas plants, HRSG, WHRB, CFBC boilers, steam turbine
generators, steam generators including auxiliaries, ESPs, hydro turbines and BOP
packages, including structural steel works, ash handling, coal handling, fuel oil
systems and high-pressure piping works.
Operation and Maintenance (O&M) services: The O&M segment includes annual
maintenance contracts (AMCs), repairs, renovation and modernization, residual
life assessment, scheduled shutdowns, retro-fits, as well as overhauling,
maintenance and upgradation services for power plants. Power Mech has provided
O&M services for various projects in the Middle East, North Africa, South Asia and
South American markets. To-date PowerMech has been engaged in more than
400 O&M contracts.
Power Mech is a leading AMC services provider for power plants in India and this
business is expected to grow as a lot of new capacity additions have come from
IPPs in recent years. Currently, Power Mech is engaged in 23 O&M contracts with
unit capacity of 32,835MW.
Civil Works: As a diversification move, Power Mech entered the Civil Works
business in 2011. Scope of Civil Works segment includes civil and structural works
contracts ancillary to the ETC-BTG projects. In this segment, Power Mech
undertakes a range of civil and structural works (such as area grading, leveling,
excavation, piling, mass concreting foundations for buildings, turbine/generator
decks and super-structures, fabrication and erection of structures, main plant bay
etc).
November 16, 2015
7
PowerMech | 2QFY2016 Result Update
Profit and Loss Statement (Standalone)
Y/E March (` cr)
FY13
FY14
FY15
FY16E
FY17E
Net Sales
933
1,187
1,356
1,539
1,801
% Chg
42.4
27.3
14.2
13.6
17.0
Total Expenditure
812
1,033
1,190
1,342
1,573
Cost of Raw Materials Consumed
64
74
76
85
100
Contract Execution Expenses
672
838
977
1,094
1,286
Employee benefits Expense
67
107
118
137
159
Other Expenses
9
13
20
25
29
EBITDA
121
154
165
197
228
% Chg
6.7
27.6
7.0
19.5
15.4
EBIDTA %
13.0
13.0
12.2
12.8
12.7
Depreciation
33
33
37
39
44
EBIT
88
122
129
158
184
% Chg
16.8
39.0
5.7
23.0
16.4
Interest and Financial Charges
17
26
29
32
26
Other Income
5
12
6
6
6
PBT
75
107
105
132
164
Exceptional Items
0
0
0
0
0
Tax
25
39
35
46
58
% of PBT
33.5
36.1
32.8
34.5
35.5
PAT
50
68
71
87
106
% Chg
(0.4)
36.3
3.5
22.7
22.1
PAT %
5.4
5.8
5.2
5.6
5.9
Basic EPS
46.6
62.4
56.2
59.0
72.1
Diluted EPS
46.6
62.4
56.2
59.0
72.1
% Chg
(0.4)
34.0
(10.0)
5.0
22.2
November 16, 2015
8
PowerMech | 2QFY2016 Result Update
Balance Sheet (Standalone)
Y/E March (` cr)
FY13
FY14
FY15
FY16E
FY17E
Sources of Funds
Equity Capital
11
11
13
15
15
Reserves Total
192
263
341
563
667
Networth
203
273
354
577
682
Total Debt
122
175
227
178
155
Other Long-term Liabilities
83
94
64
74
78
Long-term Provision
0
0
0
0
0
Total Liabilities
408
542
645
829
914
Application of Funds
Gross Block
262
298
339
370
411
Accumulated Depreciation
92
124
160
200
243
Net Block
169
173
178
171
168
Capital WIP
7
7
9
8
8
Investments
0
5
7
10
13
Other Current Assets
109
161
241
278
340
Inventories
19
24
31
43
60
Sundry Debtors
174
148
194
231
280
Cash and Bank Balance
57
69
67
173
155
Loans & Advances
130
193
260
299
360
Current Liabilities
356
412
506
556
650
Net Current Assets
133
183
286
468
545
Other Assets
98
173
165
173
180
Total Assets
408
542
645
829
914
November 16, 2015
9
PowerMech | 2QFY2016 Result Update
Cash Flow Statement
Y/E March (` cr)
FY13
FY14
FY15P
FY16E
FY17E
Profit before tax
75
107
105
132
164
Depreciation
33
33
37
39
44
Other Adjustments
(5)
(7)
(6)
(11)
(11)
Change in Working Capital
(74)
(99)
(118)
(75)
(98)
Interest & Financial Charges
17
26
29
32
26
Direct taxes paid
(26)
(33)
(37)
(42)
(54)
Cash Flow from Operations
22
26
10
76
72
(Inc)/ Dec in Fixed Assets
(36)
(36)
(44)
(30)
(42)
(Inc)/ Dec in Invest. & Int. received
(3)
(9)
6
59
2
Cash Flow from Investing
(39)
(45)
(38
29
(40)
Inc./ (Dec.) in Borrowings
41
44
59
(50)
(23)
Issue/ (Buy Back) of Equity
0
0
0
138
(0)
Dividend Paid (Incl. Tax)
(1)
(1)
(2)
(2)
(2)
Finance Cost
(15)
(23)
(29)
(31)
(25)
Cash Flow from Financing
25
20
28
56
(50)
Inc./(Dec.) in Cash
8
1
0
161
(18)
Opening Cash balances
2
9
11
11
173
Closing Cash balances
9
11
11
173
155
November 16, 2015
10
PowerMech | 2QFY2016 Result Update
Ratio Analysis (x)
Y/E March
FY13
FY14
FY15
FY16E
FY17E
Valuation Ratio (x)
P/E (on FDEPS)
13.0
9.7
10.8
10.3
8.4
P/CEPS
7.8
6.6
7.1
7.1
5.9
Dividend yield (%)
6.1
4.0
6.0
6.1
6.1
EV/Sales
0.8
0.6
0.7
0.6
0.5
EV/EBITDA
5.9
4.9
5.6
4.5
3.9
EV / Total Assets
1.7
1.4
1.4
1.1
1.0
Per Share Data (`)
EPS (Basic)
46.6
62.4
56.2
59.0
72.1
EPS (fully diluted)
46.6
62.4
56.2
59.0
72.1
Cash EPS
77.7
92.4
85.3
85.8
101.9
DPS
1.0
1.5
1.0
1.0
1.0
Book Value
189.0
250.0
281.3
392.4
463.6
Returns (%)
RoCE (Pre-tax)
32.8
35.1
26.5
24.7
24.0
Angel RoIC (Pre-tax)
35.4
36.0
26.5
28.5
28.1
RoE
28.0
28.7
22.5
18.6
16.8
Turnover ratios (x)
Asset Turnover (Gross Block) (x)
3.5
4.2
4.3
4.3
4.6
Inventory / Sales (days)
6
7
7
9
10
Receivables (days)
63
50
46
50
52
Payables (days)
48
59
63
59
53
NWC days
21
(2)
(9)
0
10
Leverage Ratios (x)
D/E ratio (x)
0.6
0.6
0.6
0.3
0.2
Interest Coverage Ratio (x)
5.5
5.1
4.6
5.2
7.4
Note: nmf- Not Meaningful
November 16, 2015
11
PowerMech | 2QFY2016 Result Update
Research Team Tel: 022 - 39357800
DISCLAIMER
Angel Broking Private Limited (hereinafter referred to as “Angel”) is a registered Member of National Stock Exchange of India Limited,
Bombay Stock Exchange Limited and Metropolitan Stock Exchange of India Limited. It is also registered as a Depository Participant with
CDSL and Portfolio Manager with SEBI. It also has registration with AMFI as a Mutual Fund Distributor. Angel Broking Private Limited is
a registered entity with SEBI for Research Analyst in terms of SEBI (Research Analyst) Regulations, 2014 vide registration number
INH000000164. Angel or its associates has not been debarred/ suspended by SEBI or any other regulatory authority for accessing
/dealing in securities Market. Angel or its associates including its relatives/analyst do not hold any financial interest/beneficial
ownership of more than 1% in the company covered by Analyst. Angel or its associates/analyst has not received any compensation /
managed or co-managed public offering of securities of the company covered by Analyst during the past twelve months. Angel/analyst
has not served as an officer, director or employee of company covered by Analyst and has not been engaged in market making activity
of the company covered by Analyst.
This document is solely for the personal information of the recipient, and must not be singularly used as the basis of any investment
decision. Nothing in this document should be construed as investment or financial advice. Each recipient of this document should
make such investigations as they deem necessary to arrive at an independent evaluation of an investment in the securities of the
companies referred to in this document (including the merits and risks involved), and should consult their own advisors to determine
the merits and risks of such an investment.
Reports based on technical and derivative analysis center on studying charts of a stock's price movement, outstanding positions and
trading volume, as opposed to focusing on a company's fundamentals and, as such, may not match with a report on a company's
fundamentals.
The information in this document has been printed on the basis of publicly available information, internal data and other reliable
sources believed to be true, but we do not represent that it is accurate or complete and it should not be relied on as such, as this
document is for general guidance only. Angel Broking Pvt. Limited or any of its affiliates/ group companies shall not be in any way
responsible for any loss or damage that may arise to any person from any inadvertent error in the information contained in this report.
Angel Broking Pvt. Limited has not independently verified all the information contained within this document. Accordingly, we cannot
testify, nor make any representation or warranty, express or implied, to the accuracy, contents or data contained within this document.
While Angel Broking Pvt. Limited endeavors to update on a reasonable basis the information discussed in this material, there may be
regulatory, compliance, or other reasons that prevent us from doing so.
This document is being supplied to you solely for your information, and its contents, information or data may not be reproduced,
redistributed or passed on, directly or indirectly.
Neither Angel Broking Pvt. Limited, nor its directors, employees or affiliates shall be liable for any loss or damage that may arise from
or in connection with the use of this information.
Note: Please refer to the important ‘Stock Holding Disclosure' report on the Angel website (Research Section). Also, please refer to the
latest update on respective stocks for the disclosure status in respect of those stocks. Angel Broking Pvt. Limited and its affiliates may
have investment positions in the stocks recommended in this report.
Disclosure of Interest Statement
Power Mech Projects
1. Analyst ownership of the stock
No
2. Angel and its Group companies ownership of the stock
No
3. Angel and its Group companies' Directors ownership of the stock
No
4. Broking relationship with company covered
No
Note: We have not considered any Exposure below ` 1 lakh for Angel, its Group companies and Directors
Ratings (Based on expected returns
Buy (> 15%)
Accumulate (5% to 15%)
Neutral (-5 to 5%)
over 12 months investment period):
Reduce (-5% to -15%)
Sell (< -15%)
November 16, 2015
12