2QFY2016 Result Update | Power
November 5, 2015
Power Grid Corporation of India
BUY
CMP
`132
Performance Highlights
Target Price
`165
Standalone (` cr)
2QFY16
2QFY15
yoy (%)
1QFY16
qoq%
Investment Period
12 months
Total Revenue
4,918
4,179
17.7
4,718
4.2
EBITDA
4,318
3,590
20.3
4,137
4.4
Stock Info
Margin (%)
87.8
85.9
188bp
87.7
10bp
Sector
Power
Reported PAT
1,448
1,201
20.5
1,367
6.0
Source: Company, Angel Research
Market Cap (` cr)
68,639
Net Debt (` cr)
95,520
For 2QFY2016, Power Grid Corporation of India (PWGR) reported a 16.8% yoy
Beta
0.6
increase in transmission revenues to `4,708cr, which is 3.5% below our estimate
52 Week High / Low
159 / 121
of `4,878cr, on account of lower than expected capitalisation. For the quarter,
Avg. Daily Volume
24,34,052
capitalisation stood at
`5,053cr, well below our estimate of
`6,246cr.
Face Value (`)
10
Capitalisation was expected to remain strong on account of spill-over in the
BSE Sensex
26,553
commissioning of certain projects from 1QFY2016 to 2QFY2016 and the
commissioning of the Biswanath Chariyali - Agra transmission line in 2QFY2016.
Nifty
8,040
The company incurred a capex of `5,088cr during the quarter, which is higher
Reuters Code
PGRD.BO
than our estimate of `4,850cr. We reduce our FY2016 capitalisation estimate to
Bloomberg Code
PWGR IN
`21,991cr, as against `22,257cr earlier.
Lower operating expenses as a percentage of revenues and higher consultancy
Shareholding Pattern (%)
income helped the company in improving its EBITDA margin by 188bp yoy to
Promoters
57.9
87.8%. In terms of operating performance, the impact of lower than expected
MF / Banks / Indian Fls
8.7
revenue was partially offset by operating efficiencies, with transmission and
FII / NRIs / OCBs
26.1
employee expenses coming in lower than expected. The EBITDA came in at
Indian Public / Others
7.4
`4,318cr, as against our estimate of `4,368cr.
Outlook and valuation
Abs. (%)
3m 1yr
3yr
We have reduced our estimates marginally to factor in the lower-than-expected
Sensex
(5.4)
(4.7)
41.6
capitalisation in 2QFY2016. We expect PWGR to report a revenue and EBITDA
PWGR
(6.8)
(9.4)
11.3
CAGR of ~16% (vs 17% earlier) and the net profit to grow at a CAGR of 17%
(vs 18% earlier) over FY2015-17E. At the current market price of `132, the stock
3-year price chart
trades at a P/BV of 1.6x and 1.4x its FY2016E and FY2017E BV of `82 and `92,
170
respectively. We reduce our target price to `165 on the stock, based on ~1.8x
160
150
FY2017E BV, implying a 26% upside from the current levels. We reiterate our Buy
140
rating on the stock.
130
120
110
Key financials (Standalone)
100
Y/E March (` cr)
FY2014
FY2015
FY2016E FY2017E
90
80
Net sales
15,230
17,177
20,278
23,159
70
% chg
19.4
12.8
18.1
14.2
Net profit
4,497
4,979
6,124
6,846
% chg
7.3
11.1
21.8
11.8
Source: Company, Angel Research
EBITDA margin (%)
85.1
86.2
87.6
86.4
EPS (`)
9.4
9.5
11.7
13.1
P/E (x)
14.0
13.8
11.2
10.0
P/BV (x)
2.0
1.8
1.6
1.4
RoE (%)
14.9
13.8
15.1
15.1
RoCE (%)
8.3
7.6
8.2
8.0
Rahul Dholam
EV/Sales (x)
9.7
9.5
8.5
7.8
Tel: 022- 3935 7800 Ext: 6847
EV/EBITDA (x)
11.4
11.0
9.7
9.0
Source: Company, Angel Research
Please refer to important disclosures at the end of this report
1
Power Grid Corporation of India | 2QFY2016 Result Update
Exhibit 1: 2QFY2016 performance (Standalone)
(` cr)
2QFY16
2QFY15
yoy%
1QFY16
qoq%
FY2015
FY2014
yoy%
Transmission Revenue
4,708
4,030
16.8
4,540
3.7
16,451
14,046
17.1
Other Operating Income
210
149
41.0
177
18.2
726
1,184
(38.6)
Total Revenue
4,918
4,179
17.7
4,718
4.2
17,177
15,230
12.8
Transmission Expenses
361
331
9.1
350
3.2
1,355
1,328
2.1
% of net sales
7.3
7.9
7.4
7.9
8.7
Employee Cost
239
257
(7.1)
230
3.7
1,024
942
8.7
% of net sales
4.9
6.2
4.9
6.0
6.2
Total expenditure
600
588
2.0
580
3.4
2,379
2,269
4.8
% of net sales
12.2
14.1
12.3
13.8
14.9
EBITDA
4,318
3,590
20.3
4,137
4.4
14,798
12,961
14.2
Margin (%)
87.8
85.9
188bp
87.7
10bp
86.2
85.1
270bp
Interest
1,149
989
16.2
1,109
3.6
3,979
3,168
25.6
Depreciation
1,448
1,212
19.5
1,370
5.7
5,085
3,996
27.3
Other income
109
131
(16.7)
70
54.6
603
491
22.7
Exceptional items
(1)
10
(0)
47
25
Profit before tax
1,830
1,510
21.2
1,729
5.8
6,289
6,264
0.4
% of net sales
37.2
36.1
36.7
36.6
41.1
Tax
382
309
23.9
363
5.4
1,310
1,766
(25.8)
% of PBT
20.9
20.4
21.0
20.8
28.2
Net Profit
1,448
1,201
20.5
1,367
6.0
4,979
4,497
10.7
Source: Company, Angel Research
Exhibit 2: Standalone - 2QFY2016 Actual vs. Angel estimates
(` cr)
Actual
Estimates
Variation (%)
Revenue
4,918
5,062
(2.8)
EBITDA
4,318
4,368
(1.1)
EBITDA margin (%)
87.8
86.3
151bp
Net Profit
1,448
1,441
0.5
Source: Company, Angel Research
Result highlights
Revenue growth in line with expectation
PWGR reported a 16.8% yoy increase in transmission revenues to `4,708cr
(3.5% below our estimate of `4,878cr), on account of lower than expected
capitalisation. Consultancy revenues came in 12% ahead of our estimate at `99cr,
while telecom revenues too surprised positively, increasing by 55% yoy to `97cr (as
against our estimate of `64cr). The increase in consultancy and telecom income
partially offset the lower than expected transmission revenue, resulting in total
operating income of `4,918cr, 2.8% lower than our estimate of `5,062cr.
November 5, 2015
2
Power Grid Corporation of India | 2QFY2016 Result Update
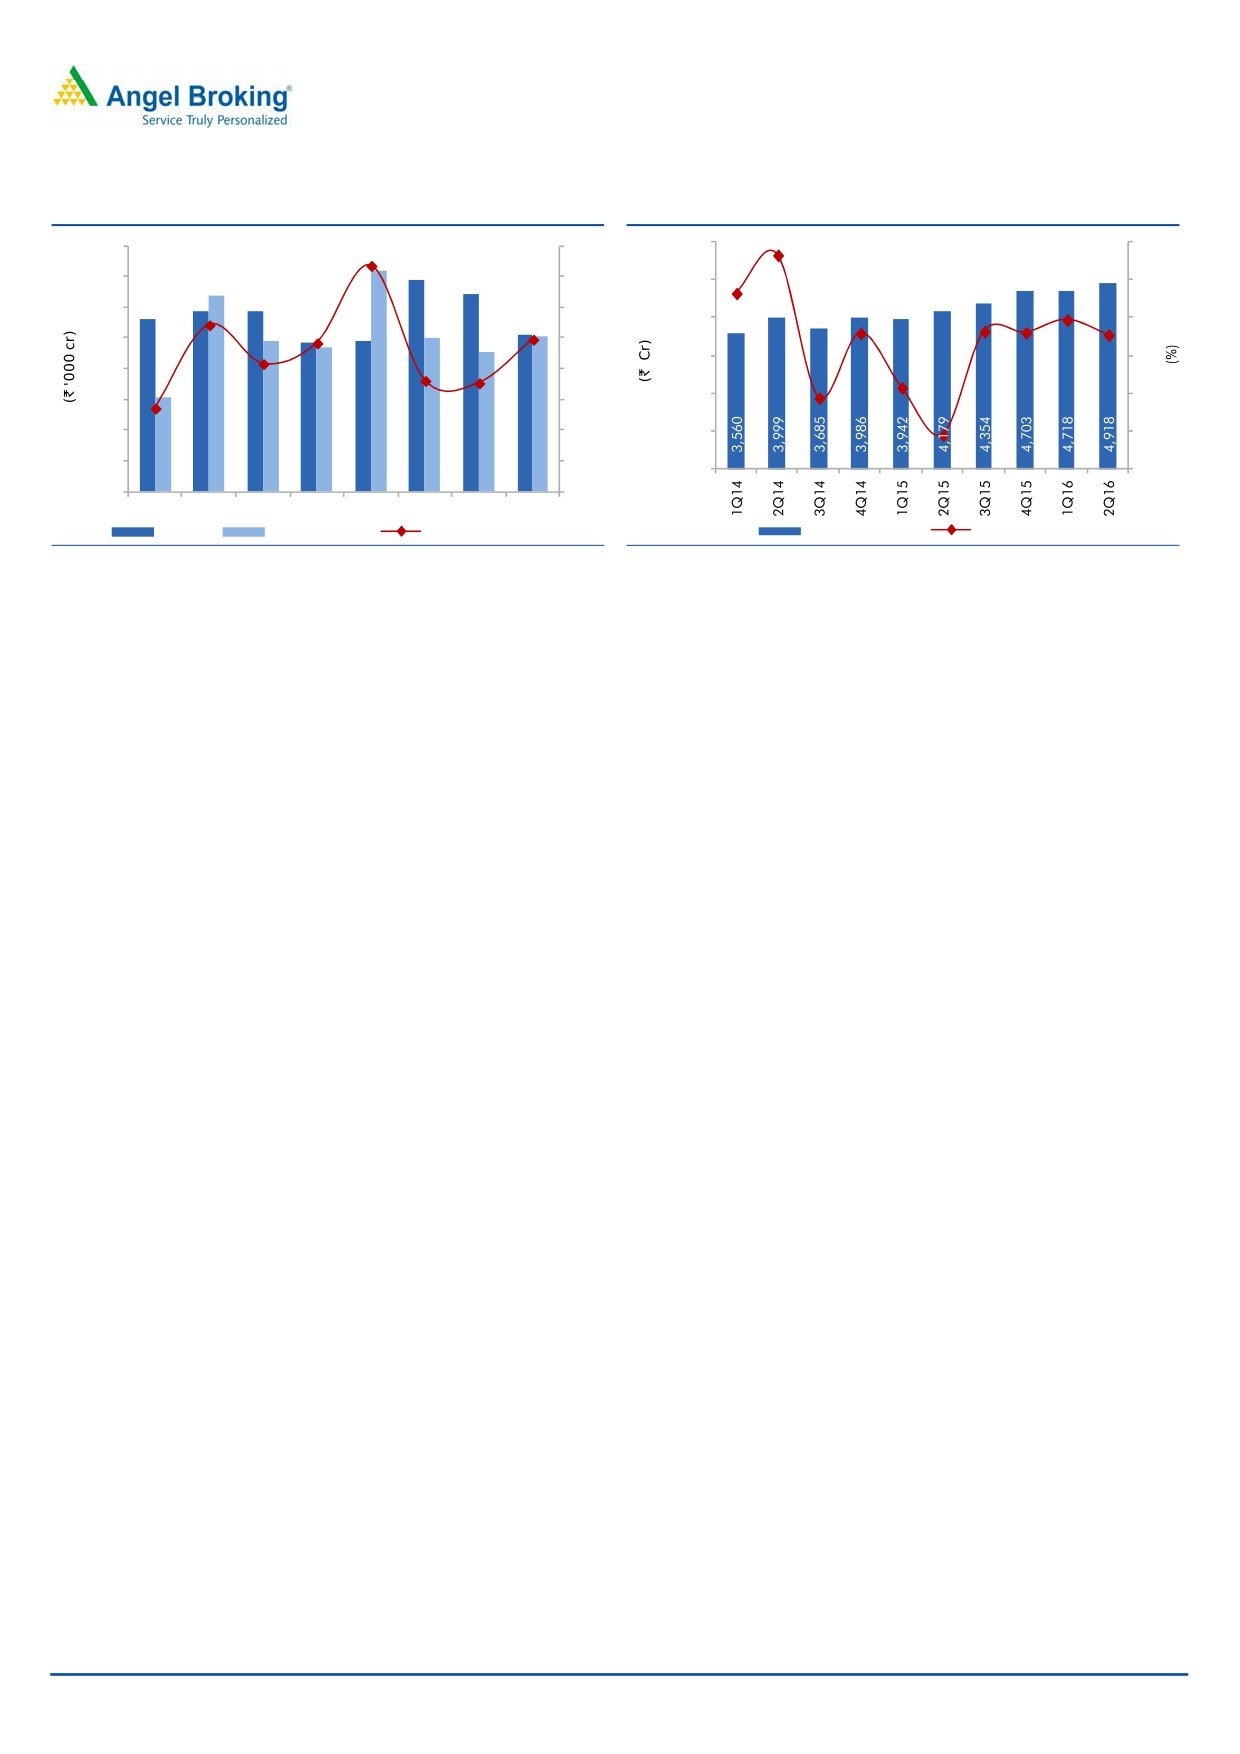
Exhibit 3: Capitalisation below estimate due to delays
Exhibit 4: Strong revenue growth of ~18% yoy
8.0
1.6
6,000
30
7.2
6.9
7.0
6.4
6.4
1.4
5,000
25
5.8
5.8
6.0
5.6
5.1
1.2
5.0
5.1
4,000
20
4.9
4.9
4.7
4.9
4.5
5.0
1.0
3,000
15
4.0
0.8
3.0
2,000
10
3.0
0.6
2.0
0.4
1,000
5
1.0
0.2
-
0
-
-
3Q14
4Q14
1Q15
2Q15
3Q15
4Q15
1Q16
2Q16
Capex
Capitalisation
Capitalisation/Capex (x)
Revenue (` Cr)
yoy change (%)
Source: Company, Angel Research
Source: Company, Angel Research
2QFY2016 capitalisation stood at `5,053cr, well below our estimate of `6,246cr.
We had expected capitalisation to remain strong on account of spill-over in the
commissioning of certain projects from 1QFY2016 to 2QFY2016 and with the
commissioning of the Biswanath Chariyali - Agra transmission line during the
quarter. Capex incurred during the quarter, at `5,088cr, was however higher than
our estimate of `4,850cr. We reduce our FY2016 capitalisation estimate to
`21,991cr, as against `22,257cr earlier.
EBITDA and net profit marginally ahead of our estimates
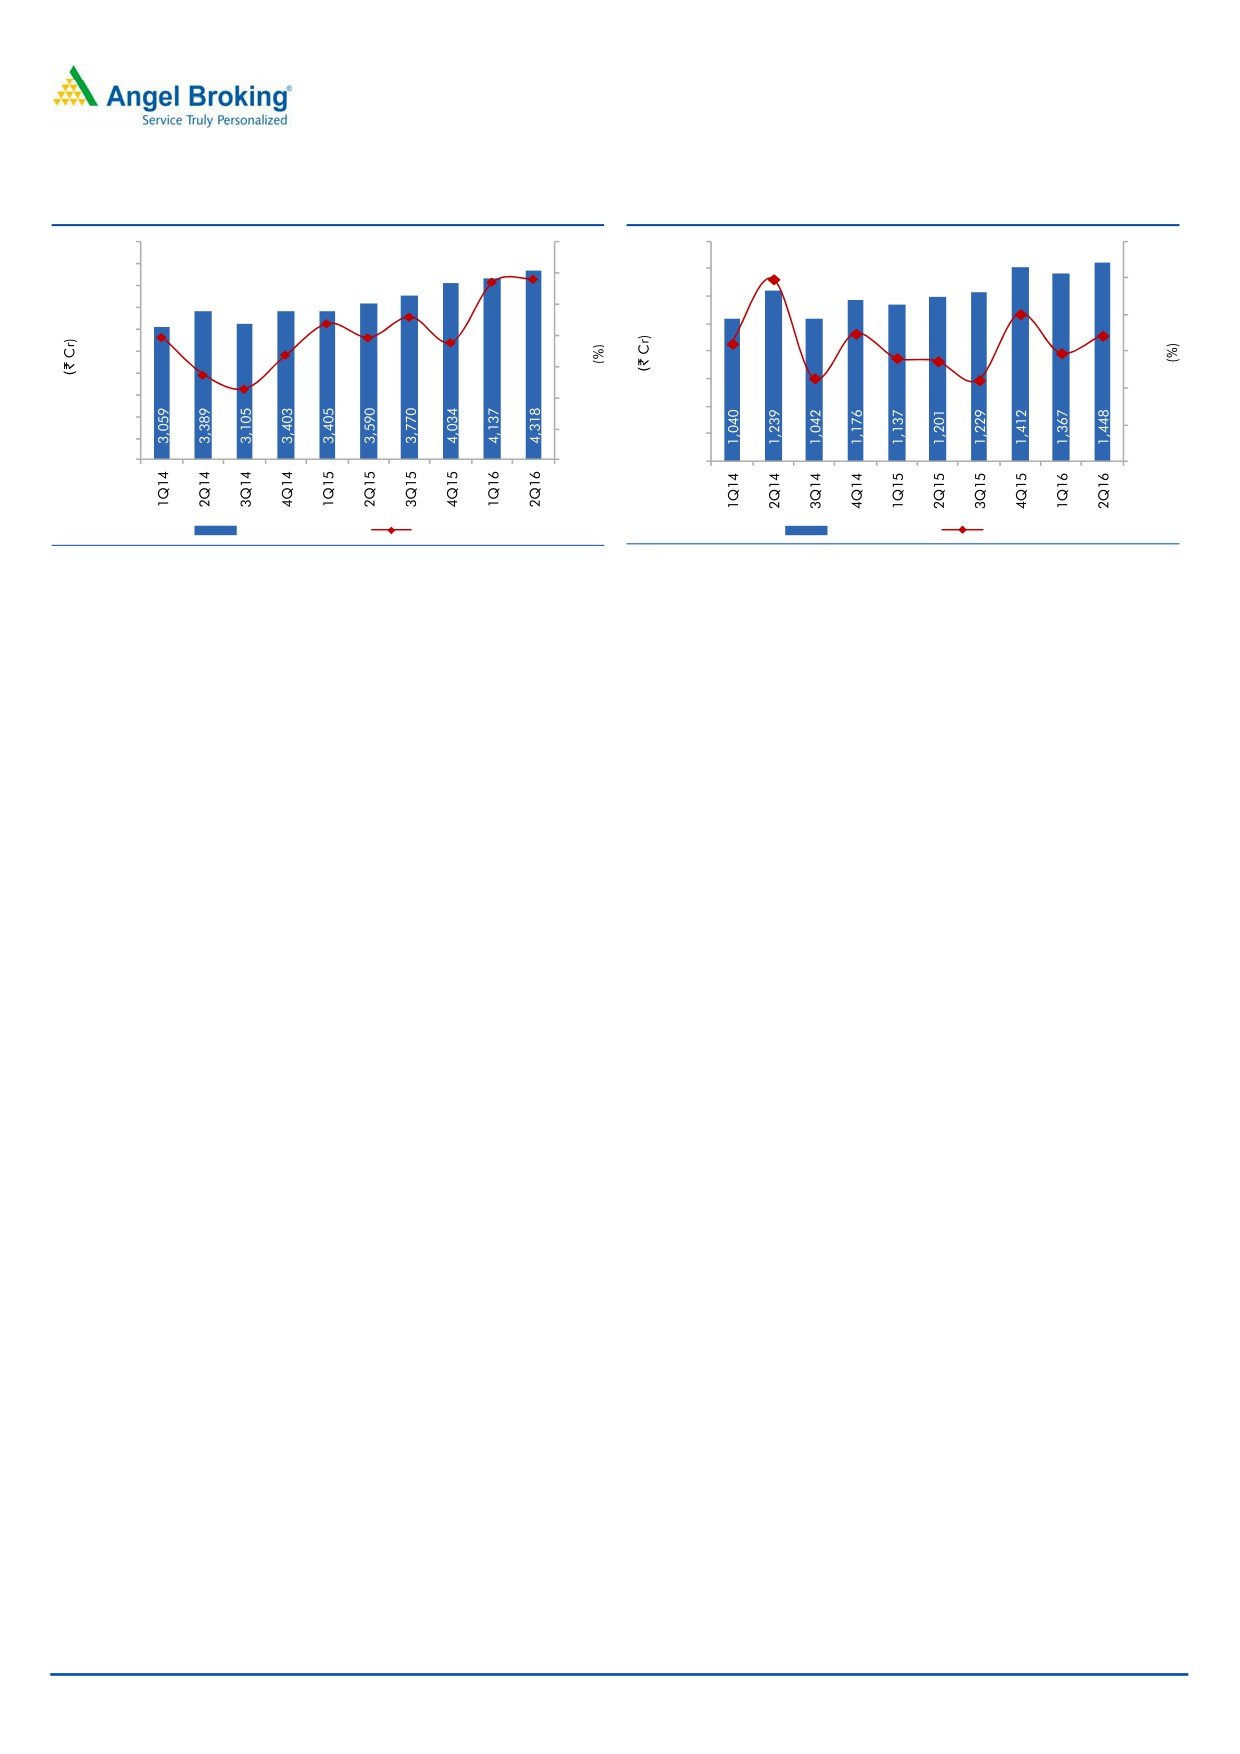
Lower operating expenses as a percentage of revenues and higher consultancy
income helped the company in improving its EBITDA margin by 188bp yoy to
87.8%. In terms of operating performance, the impact of lower than expected
revenue was partially offset by operating efficiencies, with transmission and
employee expenses coming in lower than expected. The EBITDA came in at
`4,318cr, as against our estimate of `4,368cr.
Depreciation increased ~20% yoy to `1,448cr (still, 3.1% lower than our estimate
of `1,495cr) led by lower than expected capitalisation. Interest costs, at `1,149cr,
were marginally above our expectation of `1,128cr. Other income, at `109cr, was
higher than our estimate of `76cr. Tax expenses were in-line with our estimate at
`1,830cr, leading to a 20.5% yoy increase in net profit to `1,448cr (in line with
our estimate of `1,441cr).
November 5, 2015
3
Power Grid Corporation of India | 2QFY2016 Result Update
Exhibit 5: EBITDA margin increases ~188bp yoy
Exhibit 6: Net profit jumps ~21% yoy
5,000
89
1,600
32
4,500
88
1,400
31
4,000
1,200
3,500
87
30
3,000
1,000
86
2,500
800
29
85
2,000
600
28
1,500
84
400
1,000
83
27
500
200
-
82
-
26
EBITDA (` Cr)
Margin (%)
PAT (` Cr)
Margin (%)
Source: Company, Angel Research
Source: Company, Angel Research
November 5, 2015
4
Power Grid Corporation of India | 2QFY2016 Result Update
Investment arguments
Huge investments lined up for augmenting power generation and
transmission capacities
Power generation capacity in the country is expected to increase to ~318GW by
the end of the XII plan and a further addition of ~110GW has been planned
during the XIII plan. The transmission sector is also expected to see huge
investments of ~`1,80,000cr and ~`2,00,000cr during the XII and XIII plans,
respectively. A majority of these investments are expected to be towards inter-
regional transmission. PWGR has planned a capital outlay of `1,10,000cr during
the XII plan. Further, we expect
~60-65% of XIII plan investments in the
transmission sector toward inter-state transmissions, implying a capex outlay of
~`1,20,000cr - `1,30,000cr by PWGR.
Regulated ROE model assures steady earnings growth
PWGR receives a fixed return on equity (ROE) of 15.5%, with an additional 0.5%
for timely completion of projects, as per norms laid out by the Central Electricity
Regulatory Commission (CERC). The fixed ROE model implies that earnings growth
is directly linked to the growth in assets capitalised. PWGR’s current outlay over the
next two years (CWIP + capex) is upward of `1 lakh cr, providing strong earnings
visibility.
November 5, 2015
5
Power Grid Corporation of India | 2QFY2016 Result Update
Outlook and valuation
We like PWGR for its high quality earnings as well as for the growth offered by its
regulated equity model. The company has had a good execution track record in
the past and we expect the same to continue. Strong entry barriers for new entrants
on account of huge investments that are required in the transmission sector, place
the company is a strong position. We have reduced our estimates marginally to
factor in the lower-than-expected capitalisation in 2QFY2016. We expect PWGR to
report a revenue and EBITDA CAGR of ~16% (vs 17% earlier) and the net profit to
grow at a CAGR of 17% (vs 18% earlier) over FY2015-17E.
At the current market price of `132, the stock trades at a P/BV of 1.6x and 1.4x its
FY2016E and FY2017E BV of `82 and `92, respectively. We reduce our target
price to `165 on the stock, based on ~1.8x FY2017E BV, implying a 26% upside
from the current levels. We reiterate our Buy rating on the stock.
Exhibit 7: Valuation (FY2017E)
Price / BV
(` cr)
Equity
48,102
Multiple (x)
1.8
Equity Value
86,583
Target price (`)
165
Source: Company, Angel Research
Company background
Power Grid Corporation of India Ltd is the Central Transmission Utility (CTU) of the
country and a 'Navratna' company operating under the Ministry of Power. The
company is engaged in the power transmission business with the responsibility for
planning, implementation, operation and maintenance of inter-state transmission
system and operation of National & Regional Power Grids. As of August 10, 2015,
the company owns and operates a transmission network of about 1,18,261ckm of
transmission lines and 197 EHVAC & HVDC substations with transformation
capacity of about 2,39,424MVA. The company continues to wheel ~50% of total
power generated in the country through its transmission network with a consistently
high availability of over 99.9%.
November 5, 2015
6
Power Grid Corporation of India | 2QFY2016 Result Update
Profit & Loss Statement (Standalone)
Y/E March (` cr)
FY2013
FY2014
FY2015
FY2016E
FY2017E
Transmission Charges
11,754
14,046
16,451
19,372
22,176
Telecom+Consultancy Revenue
547
903
655
842
888
Net Sales
12,300
14,949
17,106
20,214
23,064
Other operating income
457
281
71
64
96
Total operating income
12,758
15,230
17,177
20,278
23,159
% chg
25.5
19.4
12.8
18.1
14.2
Transmission Expenses
368
456
553
652
746
Employee Expenses
886
942
1,024
986
1,380
Other Mfg costs
558
849
755
871
972
Provisions
3
22
47
(2)
63
EBITDA
10,943
12,961
14,798
17,771
19,999
% chg
28.6
18.4
14.2
20.1
12.5
(% of Net Sales)
85.8
85.1
86.2
87.6
86.4
Depreciation& Amortisation
3,352
3,996
5,085
5,924
7,096
EBIT
7,591
8,965
9,713
11,847
12,903
% chg
27.8
18.1
8.3
22.0
8.9
(% of Net Sales)
59.5
58.9
56.5
58.4
55.7
Interest & other Charges
2,535
3,168
3,979
4,518
5,001
Other Income
571
491
603
392
746
(% of PBT)
10.1
7.8
9.5
5.1
8.6
Share in profit of Associates
-
-
-
-
-
Recurring PBT
5,627
6,289
6,337
7,722
8,647
% chg
21.9
11.8
0.8
21.9
12.0
Extraordinary Inc/(Expense)
18
(25)
(47)
-
-
PBT (reported)
5,645
6,264
6,289
7,722
8,647
Tax
1,410
1,766
1,310
1,598
1,801
(% of PBT)
25.0
28.2
20.8
20.7
20.8
PAT (reported)
4,235
4,497
4,979
6,124
6,846
ADJ. PAT
4,216
4,523
5,026
6,124
6,846
% chg
28.7
7.3
11.1
21.8
11.8
(% of Net Sales)
33.0
29.7
29.3
30.2
29.6
November 5, 2015
7
Power Grid Corporation of India | 2QFY2016 Result Update
Balance Sheet (Standalone)
Y/E March (` cr)
FY2013
FY2014
FY2015E
FY2016E
FY2017E
SOURCES OF FUNDS
Equity Share Capital
4,630
5,232
5,232
5,232
5,232
Reserves & Surplus
21,610
29,228
32,935
37,626
42,870
Shareholders Funds
26,239
34,460
38,167
42,858
48,102
Share Warrants
-
-
-
-
-
Total Loans
68,188
83,170
95,817
1,07,378
1,17,574
Deferred Tax Liability
1,959
2,443
2,472
2,501
2,531
Other Long term liabilities
4,708
5,855
6,610
7,743
8,293
Long term provisions
443
524
591
698
797
Total Liabilities
1,01,537
1,26,452
1,43,657
1,61,178
1,77,296
APPLICATION OF FUNDS
Gross Block
80,600
96,504
1,18,264
1,40,255
1,59,423
Less: Acc. Depreciation
19,199
23,350
28,577
34,501
41,597
Net Block
61,401
73,154
89,686
1,05,754
1,17,826
Capital Work-in-Progress
19,115
31,851
39,882
39,523
42,481
Construction Stores
21,038
21,479
16,409
17,213
17,637
Investments
964
814
741
741
741
Non-current Loans & Adv.
2,351
3,190
3,652
4,502
5,142
Current Assets
6,265
9,100
7,930
10,677
13,213
Cash
1,662
4,418
2,063
3,897
5,494
Loans & Advances
429
472
566
669
764
Other
4,175
4,211
5,301
6,111
6,956
Current liabilities
9,597
13,138
14,644
17,231
19,744
Net Current Assets
(3,331)
(4,037)
(6,714)
(6,555)
(6,530)
Mis. Exp. not written off
-
-
-
-
-
Total Assets
1,01,537
1,26,452
1,43,657
1,61,178
1,77,296
November 5, 2015
8
Power Grid Corporation of India | 2QFY2016 Result Update
Cash flow statement (Standalone)
Y/E March (` cr)
FY2013
FY2014
FY2015
FY2016E FY2017E
Profit before tax
5,645
6,264
6,289
7,722
8,647
Depreciation
3,380
4,011
5,228
5,924
7,096
Change in Working Capital
1,241
3,333
660
2,193
2,057
Others
2,091
2,809
4,494
5,268
5,195
Direct taxes paid
(1,072)
(1,157)
(1,310)
(1,598)
(1,801)
Cash Flow from Operations
11,284
15,259
15,361
19,509
21,194
(Inc.)/ Dec. in Fixed Assets
(22,389)
(26,735)
(24,721)
(22,436)
(22,550)
(Inc.)/ Dec. in Investments
137.0
148.8
72.3
-
-
Others
303
209
(462)
(850)
(640)
Cash Flow from Investing
(21,948)
(26,378)
(25,111)
(23,286)
(23,190)
Issue of Equity
0
5,297
0
0
0
Inc./(Dec.) in loans
13,795
12,720
12,599
11,561
10,196
Dividend Paid (Incl. Tax)
(1,569)
(1,391)
(1,224)
(1,433)
(1,602)
Others
(2,236)
(2,752)
(3,979)
(4,518)
(5,001)
Cash Flow from Financing
9,990
13,874
7,395
5,611
3,593
Inc./(Dec.) in Cash
(675)
2,756
(2,355)
1,834
1,597
Opening Cash balances
2,337
1,662
4,418
2,063
3,897
Closing Cash balances
1,662
4,418
2,063
3,897
5,494
November 5, 2015
9
Power Grid Corporation of India | 2QFY2016 Result Update
Key ratios
Y/E March
FY2013
FY2014
FY2015E
FY2016E
FY2017E
Valuation Ratio (x)
P/E (on FDEPS)
14.4
14.0
13.8
11.2
10.0
P/CEPS
8.0
7.4
6.8
5.7
4.9
P/BV
2.3
2.0
1.8
1.6
1.4
Dividend yield (%)
2.1
2.0
1.5
1.8
2.0
EV/Sales
10.0
9.7
9.5
8.5
7.8
EV/EBITDA
11.6
11.4
11.0
9.7
9.0
EV/Total Assets
1.3
1.2
1.1
1.1
1.0
Per Share Data (`)
Adjusted EPS (Basic)
9.1
9.4
9.6
11.7
13.1
Adjusted EPS (fully diluted)
9.1
9.4
9.6
11.7
13.1
Cash EPS
16.3
17.7
19.3
23.0
26.6
DPS
2.8
2.6
2.0
2.3
2.6
Book Value
56.7
65.9
73.0
81.9
91.9
Dupont Analysis
EBIT margin
59.5
58.9
56.5
58.4
55.7
Tax retention ratio (%)
75.0
71.8
79.2
79.3
79.2
Asset turnover (x)
0.1
0.1
0.1
0.1
0.1
ROIC (Post-tax)
6.7
6.1
6.2
6.6
6.6
Cost of Debt (Post Tax)
3.1
3.0
3.5
3.5
3.5
Leverage (x)
2.4
2.4
2.4
2.4
2.4
Operating RoE
15.1
13.6
12.4
14.2
13.8
Returns (%)
RoCE (Pre-tax)
8.7
8.3
7.6
8.2
8.0
Angel RoIC (Pre-tax)
15.6
15.4
13.9
14.0
13.3
RoE
17.0
14.9
13.8
15.1
15.1
Turnover ratios (x)
Asset Turnover (Gross Block)
0.2
0.2
0.2
0.2
0.2
Inventory (days)
14
15
15
15
15
Receivables (days)
42
36
39
40
39
Payables (days)
44
45
55
58
54
WC cycle (ex-cash) (days)
(116)
(161)
(183)
(173)
(177)
Solvency ratios (x)
Net debt to equity
2.5
2.3
2.5
2.4
2.3
Net debt to EBITDA
6.1
6.1
6.3
5.8
5.6
Interest Coverage
3.0
2.8
2.4
2.6
2.6
November 5, 2015
10
Power Grid Corporation of India | 2QFY2016 Result Update
Research Team Tel: 022 - 39357800
DISCLAIMER
Angel Broking Private Limited (hereinafter referred to as “Angel”) is a registered Member of National Stock Exchange of India Limited,
Bombay Stock Exchange Limited and Metropolitan Stock Exchange of India Limited. It is also registered as a Depository Participant with
CDSL and Portfolio Manager with SEBI. It also has registration with AMFI as a Mutual Fund Distributor. Angel Broking Private Limited is
a registered entity with SEBI for Research Analyst in terms of SEBI (Research Analyst) Regulations, 2014 vide registration number
INH000000164. Angel or its associates has not been debarred/ suspended by SEBI or any other regulatory authority for accessing
/dealing in securities Market. Angel or its associates including its relatives/analyst do not hold any financial interest/beneficial
ownership of more than 1% in the company covered by Analyst. Angel or its associates/analyst has not received any compensation /
managed or co-managed public offering of securities of the company covered by Analyst during the past twelve months. Angel/analyst
has not served as an officer, director or employee of company covered by Analyst and has not been engaged in market making activity
of the company covered by Analyst.
This document is solely for the personal information of the recipient, and must not be singularly used as the basis of any investment
decision. Nothing in this document should be construed as investment or financial advice. Each recipient of this document should
make such investigations as they deem necessary to arrive at an independent evaluation of an investment in the securities of the
companies referred to in this document (including the merits and risks involved), and should consult their own advisors to determine
the merits and risks of such an investment.
Reports based on technical and derivative analysis center on studying charts of a stock's price movement, outstanding positions and
trading volume, as opposed to focusing on a company's fundamentals and, as such, may not match with a report on a company's
fundamentals.
The information in this document has been printed on the basis of publicly available information, internal data and other reliable
sources believed to be true, but we do not represent that it is accurate or complete and it should not be relied on as such, as this
document is for general guidance only. Angel Broking Pvt. Limited or any of its affiliates/ group companies shall not be in any way
responsible for any loss or damage that may arise to any person from any inadvertent error in the information contained in this report.
Angel Broking Pvt. Limited has not independently verified all the information contained within this document. Accordingly, we cannot
testify, nor make any representation or warranty, express or implied, to the accuracy, contents or data contained within this document.
While Angel Broking Pvt. Limited endeavors to update on a reasonable basis the information discussed in this material, there may be
regulatory, compliance, or other reasons that prevent us from doing so.
This document is being supplied to you solely for your information, and its contents, information or data may not be reproduced,
redistributed or passed on, directly or indirectly.
Neither Angel Broking Pvt. Limited, nor its directors, employees or affiliates shall be liable for any loss or damage that may arise from
or in connection with the use of this information.
Note: Please refer to the important ‘Stock Holding Disclosure' report on the Angel website (Research Section). Also, please refer to the
latest update on respective stocks for the disclosure status in respect of those stocks. Angel Broking Pvt. Limited and its affiliates may
have investment positions in the stocks recommended in this report.
Disclosure of Interest Statement
Power Grid Corporation of India
1. Analyst ownership of the stock
No
2. Angel and its Group companies ownership of the stock
No
3. Angel and its Group companies' Directors ownership of the stock
No
4. Broking relationship with company covered
No
Note: We have not considered any Exposure below ` 1 lakh for Angel, its Group companies and Directors
Ratings (Based on expected returns
Buy (> 15%)
Accumulate (5% to 15%)
Neutral (-5 to 5%)
over 12 months investment period):
Reduce (-5% to -15%)
Sell (< -15)
November 5, 2015
11