1QFY2017 Result Update | Infrastructure
August 31, 2016
PNC Infratech
BUY
CMP
`120
Performance Highlights
Target Price
`143
Quarterly highlights - Standalone
Investment Period
12 Months
Y/E March (` cr)
1QFY17
1QFY16
% chg (yoy)
Net sales
515
434
18.6
Stock Info
EBITDA
67
60
11.6
Sector
Infrastructure
Market Cap (` cr)
3,084
Reported PAT
64
26
145.6
Source: Company, Angel Research
Net debt (` cr)
(91)
Beta
0.6
For 1QFY2017, PNC Infratech (PNC) reported top-line growth of 18.6% while the
52 Week High / Low
135/82
bottom-line grew by substantial 145.6% yoy. The top-line growth was driven by
Avg. Daily Volume
75,832
strong execution across Agra-Firozabad and Varanasi-Gorakhpur road projects.
Face Value (`)
2
Despite strong execution, decline in raw material and other expenses led to 81bp
BSE Sensex
28,343
yoy decline in EBITDA margin to 13.0%. A 11.6% yoy EBITDA growth coupled
Nifty
8,744
with tax benefits and MAT credit led PAT grow by 145.6% yoy. PAT margins stood
Reuters Code
PNCI.BO
at 12.4%, rose significantly on a yoy basis.
Bloomberg Code
PNCL@IN
PNC’s unexecuted order book as of 1QFY2017 stands at `6,474cr (order book
to LTM sales ratio stands at 3.1x).
Shareholding Pattern (%)
All the BOT projects are now operational as of now. Management has indicated
Promoters
56.1
that it does not intend to add any new BOT projects in FY2017-18. As a result,
MF / Banks / Indian Fls
15.1
we are of the view that PNC’s consolidated D/E ratio would peak out from
FII / NRIs / OCBs
8.0
FY2017E onwards.
Indian Public / Others
20.8
Outlook and valuation: Considering the strong uptick in roads and highways EPC
award activity especially in north India, where PNC has more comfort, and given
its past track record and recent wins, we expect the standalone entity to report
Abs. (%)
3m 1yr 3yr
20.1% top-line CAGR over FY2015-2017E. With normal tax rate applicable from
Sensex
6.3
7.8
54.0
FY2018, the bottom-line growth would be of -3.3% CAGR during the same
PNC Infratech
6.4
21.4
NA
*NA as PNC listed on May 26, 2015
period. Accordingly, RoEs would decline from 23.3% in FY2016 to 13.9% in
FY2018E. We are also now comforted that the consolidated Balance Sheet would
peak from FY2017E onwards. Using the SoTP valuation methodology we arrive
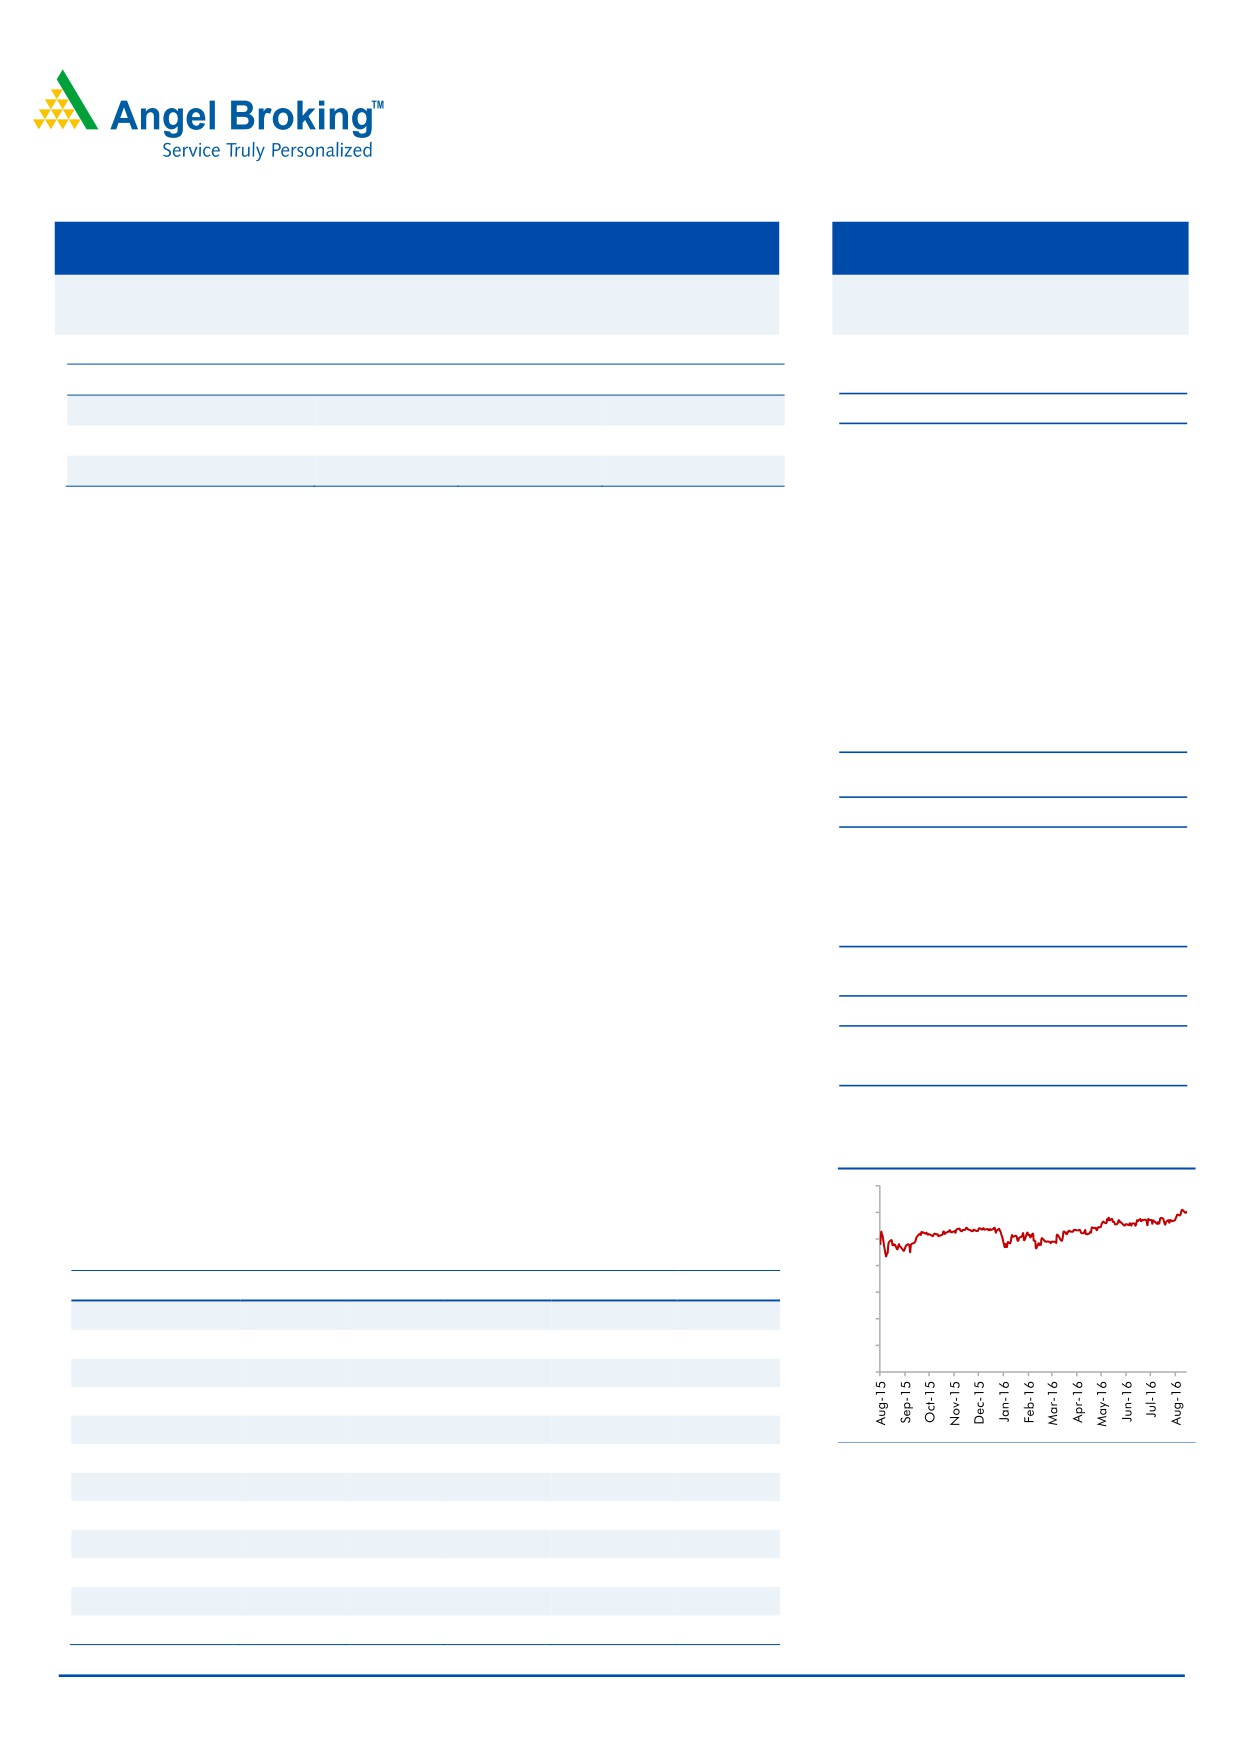
3-Year Daily Price Chart
at a FY2018E based price target of `143. Given the 19% upside in stock form the
140
120
current levels, we recommend BUY rating on the stock.
100
Key financials (Standalone)
80
Y/E March (` cr)
FY14
FY15
FY16
FY17E
FY18E
60
Net Sales
1,145
1,561
2,014
2,350
2,904
40
% chg
(12.1)
36.3
29.0
16.7
23.6
20
Net Profit
67
100
243
232
227
0
% chg
(12.6)
50.2
141.9
(4.6)
(2.0)
EBITDA (%)
12.2
13.9
13.2
13.1
13.2
EPS (`)
3
4
9
9
8.8
Source: Company, Angel Research
P/E (x)
46.1
30.7
12.7
13.3
13.6
P/BV (x)
4.9
4.3
2.3
2.0
0.0
RoE (%)
11.2
14.9
23.3
15.9
13.9
RoCE (%)
15.0
20.2
19.4
17.9
17.3
Yellapu Santosh
EV/Sales (x)
0.5
0.5
0.3
0.4
0.3
022 - 3935 7800 Ext: 6811
EV/EBITDA (x)
4.5
3.6
2.0
2.9
2.3
Source: Company, Angel Research; Note: CMP as of August 30, 2016
Please refer to important disclosures at the end of this report
1
PNC Infratech | 1QFY2017 Result Update
Exhibit 1: Quarterly Standalone Performance
Particulars (` cr)
1QFY17
1QFY16
% chg (yoy)
Net Sales
515
434
18.6
Total Expenditure
448
374
19.7
Cost of Materials consumed
378
302
25.1
Changes in Inv. Of FG & WIP
(2)
15
nmf
Employee Benefits Expense
24
19
26.9
Other Expenses
48
39
24.6
EBITDA
67
60
11.6
EBIDTA %
13.0
13.8
Depreciation
12
12
2.7
EBIT
55
48
13.7
Interest and Financial Charges
2
10
(79.2)
Other Income
17
2
831.6
PBT before Exceptional Items
70
40
76.5
Exceptional Items
0
0
PBT after Exceptional Items
70
40
76.5
Tax
6
14
(54.5)
% of PBT
8.9
34.5
PAT
64
26
145.6
PAT %
12.4
6.0
Other Comprehensive Income
0
0
(70.4)
Total Comprehensive Income
64
26
145.0
Dil. EPS (after extra-ord. Items)
2.49
1.16
114.7
Source: Company, Angel Research
Standalone Business Review
Strong execution seen during the quarter
Led by strong execution, PNC reported strong sales for 1QFY2017. Against our
15% yoy growth expectations, PNC reported 18.6% yoy top-line growth to `515cr.
Notably, Agra-Firozabad contributed `337cr (a/c’ed for 65% of the revenues) to
the 1QFY2017 standalone revenues. Varanasi-Gorakhpur project contributed
`65cr to the total revenues.
EBITDA margin declines to 13.0%
On the operating front, PNC reported an EBITDA of `67cr, reflecting 13.0%
EBITDA margin for the quarter. Reported EBITDA margins were lower than our
expectation, as they declined 81bp yoy to 13.0%. Despite strong execution, higher
raw material and other expenses led to yoy EBITDA margin compression.
PAT benefits from strong other income & low tax rate
PNC reported strong PAT at `64cr for the quarter. Reported PAT margin came in at
12.4%, ahead of 6.0% in the corresponding quarter a year ago and our
expectations. PAT on yoy basis benefitted from (1) sharp growth in other income
(to `17cr), and (2) lower effective tax rate at 8.9%. Of the total other income
booked for the quarter, PNC benefitted from ~`14cr of interest income from loans
given to the Ghaziabad-Aligarh JV. Lower tax rate is attributable to MAT credit and
section 80IA benefits.
August 31, 2016
2
PNC Infratech | 1QFY2017 Result Update
Order inflows continue to grow
In FY2016, PNC reported a 146% yoy increase in net order inflows to `3,972cr.
These include 6 highway projects and 1 airport runway project (has received letter
of award for all the 7 projects).
In FY2017, PNC is either L1 or has won 4 projects worth `1,373cr. Following are
the details of projects won:
(1) extension and resurfacing of runway at Air Force Station, Bakshi Ka Talab, near
Lucknow worth `139.6cr from Military Engineering Services, (2) upgradation of
Nanau-Dodon section in the district of Aligarh, Uttar Pradesh worth `119.9cr
by UP PWD, (3) 2/ 4 laning of Dausa-Lalsot-Kauthun section of NH-11 A
(Extension) in Rajasthan under NHDP IV, on HAM for `881cr of bid project cost,
and (4) 4-laning of Etah-Kasganj road project in UP worth `232.9cr.
PNC’s unexecuted order book (including L1 order wins) as of 1QFY2017 stands at
`6,474cr (order book to LTM sales ratio stands at 3.1x). Roads & Highways vertical
continues to dominate the order book mix.
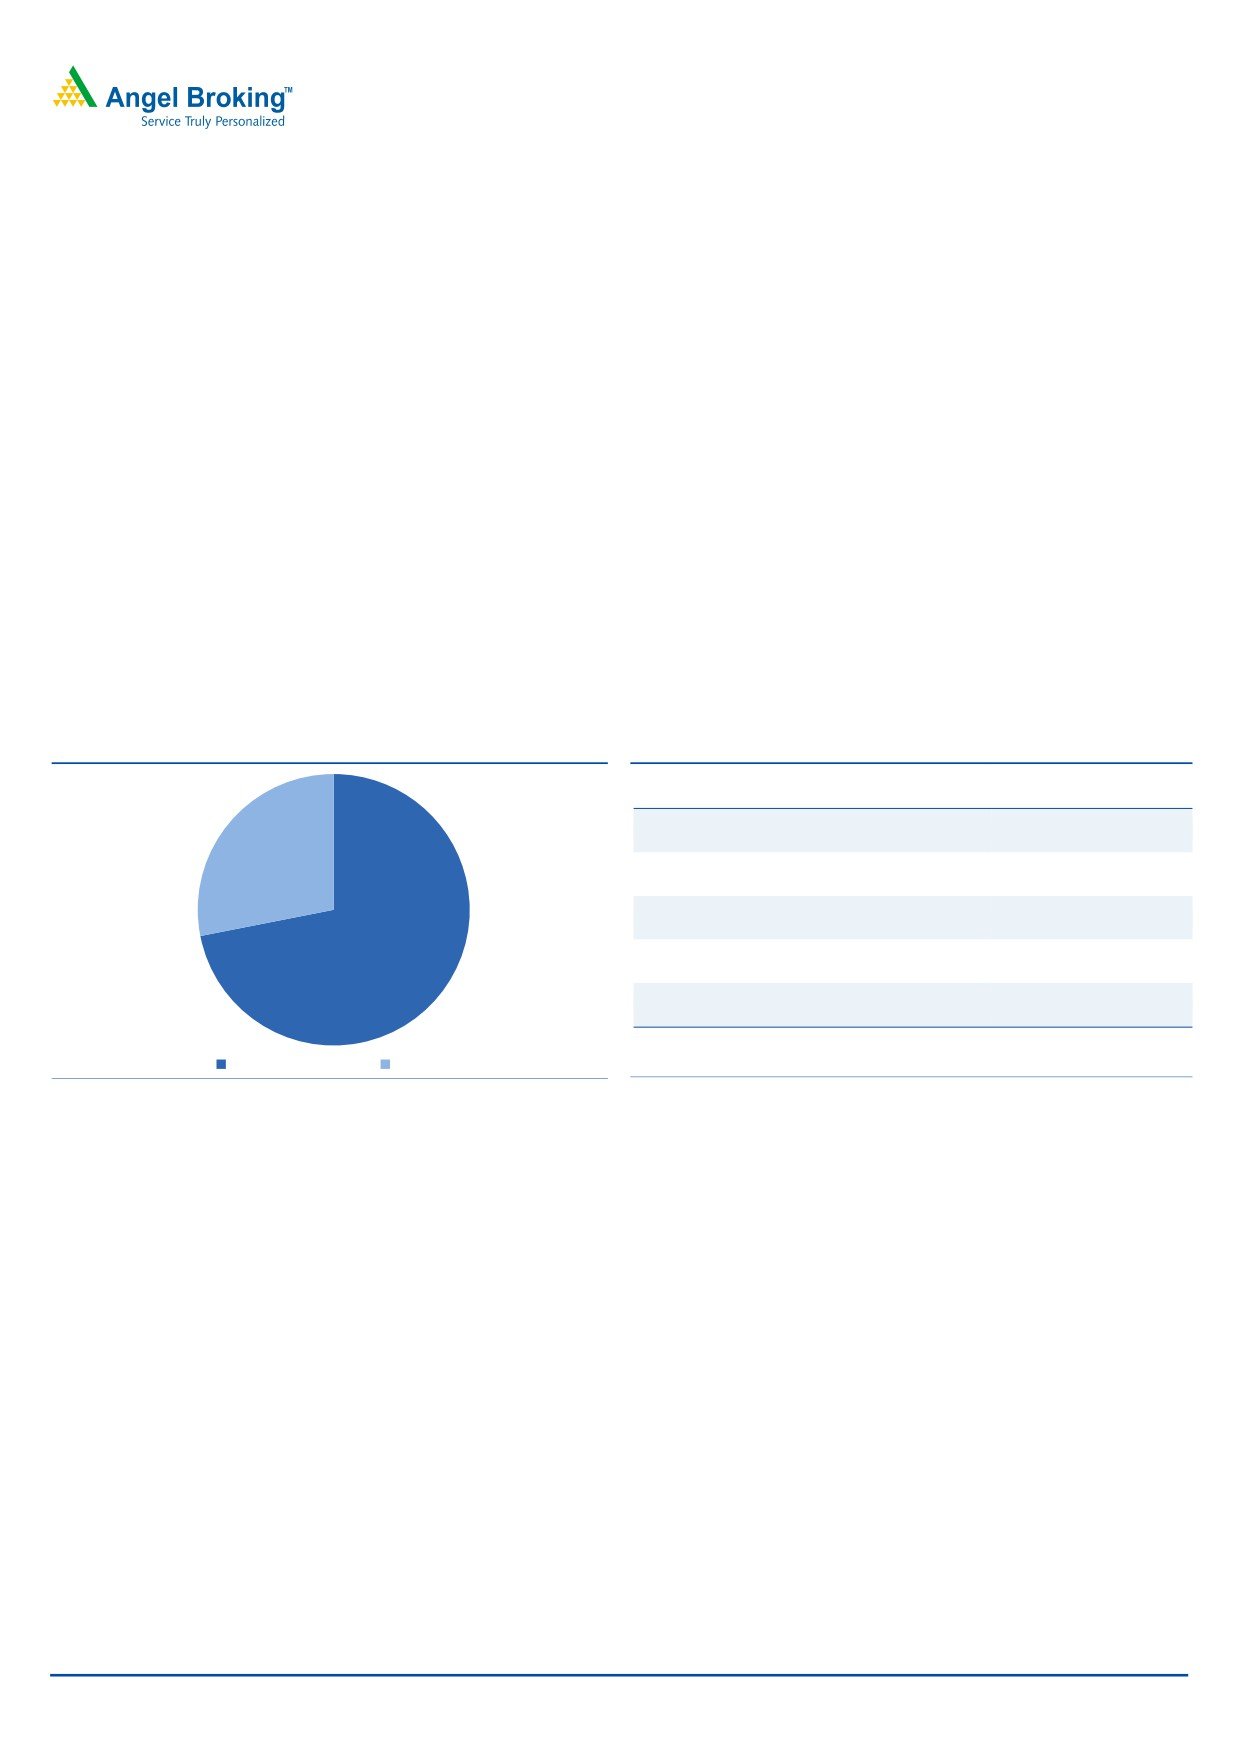
Exhibit 2: Top 5-projects as % of total Order Book
Exhibit 3: Details of Top-5 projects being executed
O/s Total Project
Project details
Value (` cr)
Nagina-Kashipur
1,156
28%
Varanasi-Gorakhpur
869
83%
Aligarh-Moradabad
645
Agra-Firozabad
523
Bhojpur-Buxar
477
Top 5-projects
3,670
Top 5 projects
Other Projects
Source: Company, Angel Research
Source: Company, Angel Research
August 31, 2016
3
PNC Infratech | 1QFY2017 Result Update
Update on BOT projects
PNC currently has 7 BOT/OMT assets which are at operational. Of these, 1 is a
BOT-Annuity project, 1 is an industrial estate maintenance project (BOT-Annuity +
Fee model), 1 is an OMT project, and the remaining 4 are BOT-Toll projects.
Notably, all 7 BOT projects are Uttar Pradesh (UP) or Central/North India based. 4
of these BOT projects have been won on Viability Gap Funding (VGF) basis,
amidst competition.
Currently all 7 BOT projects are operational (Rae Bareli-Jaunpur BOT project
commenced operations 98 days before the scheduled CoD of June-2016).
Exhibit 4: BOT Projects Status (at 1QFY2017-end)
PNC
Length
PNC Equity
BOT projects
Proj. Type
Status
TPC
Stake (%)
(kms)
Invested to-date
Ghaziabad-Aligarh
Toll
35%
Operational
125
2,000
68
Kanpur-Kabrai
Toll
100%
Operational
123
458
68
Gwalior-Bhind
Toll
100%
Operational
108
340
78
Bareilly-Almora
Toll
100%
Operational
54
604
75
Rae Bareli-Jaunpur
Annuity
100%
Operational
166
837
140
Narela Industrial Estate
Annuity + Fee
100%
Operational
NA
175
35
OMT projects
Kanpur-Ayodhya
Toll
100%
Operational
217
4,435
561
Source: Company, Angel Research
With all 7 BOT projects operational PNC does not have any equity commitments
pending towards the BOT projects.
Kanpur-Ayodhya OMT project during 1QFY2017 collected `69.8cr of gross toll
income, which in our estimate is over 10% yoy increase.
For Ghaziabad-Aligarh BOT project, PNC reported toll income of ~`41lakh/day.
Management expects tolling from this BOT to catch-up in next 3-6 months to
~`60lakh/day, (1) once entire road stretch gets operational (currently does partial
tolling); and (2) on implementation of over-loading charges.
Gwalior-Bhind reported
`15.5cr, Kanpur-Kabrai reported
`24.7cr, Kanpur-
Ayodhya reported `69.8cr and Bareilly Almora reported `9.6cr of toll income in
1QFY2017, respectively. All above-mentioned BOT projects benefitted from 2.5%
increase in tariff rate.
Risks & Concerns
Delay in order wins could pose as a risk to our estimates.
Roads & Highways account for substantial chunk of the order book. Slowdown
in orders from NHAI / State governments could affect company’s order inflow
adversely.
PNC's order book comes majorly from North India. Any slowdown in orders
from this region may impact our order inflow assumption for the company.
August 31, 2016
4
PNC Infratech | 1QFY2017 Result Update
Concall Takeaways:
PNC management highlighted that YTDFY2017 NHAI awarded 1,000kms of
road projects. Post the commencement of Hybrid Annuity (HAM) projects
awarding to-date ~30 projects covering ~1,600kms have been awarded.
Management highlighted that they are bidding for `15,000cr of EPC projects
and few HAM projects. Also, PNC has bid for ~`1,500cr of DFCC projects to
lay down railway track between Khurja-Pilkhani stretch in U.P.
Management expects to win `5,000cr of orders in FY2017E and end the year
with order book of `8,000cr.
On the back of recent win, management expects FY2017E revenue growth in
the range of 20-25%.
Despite completion of mobilization, Bihar based road stretches, Bhojpur-
Buxar, Koilwar-Bhojpur projects are expected to get their appointed date by
Oct-16. This project level delay is owing to land acquisition issue. Similarly,
management is hopeful of getting appointed dates for Aligarh-Moradabad by
Sep-16 and Varanasi-Gorakhpur, Nagina-Kashipur projects by Oct-16.
Management expects EBITDA margins to be in range of 13-14% for FY2017E.
For FY2017E, PNC is expected to report effective tax rate in range of ~5-7%
and 20-22% in FY2018E. This lower tax rate for FY2017/18E is attributable to
section 80IA benefits and MAT Credit entitlement.
Of the targeted `80cr capex for FY2017E, PNC has already incurred `8-10cr
capex in 1QFY2017. Management guided for `30-35cr capex in FY2018E.
On the back of uptick in the project execution from 2HFY2017E, management
expects stretch in the Working capital. As a result standalone debt is expected
to increase from `15cr in 1QFY2017 to `150-200cr by FY2017E-end. Consol.
debt at 1QFY2017 stands at `1,722cr (reflecting D/E of 1.3x).
August 31, 2016
5
PNC Infratech | 1QFY2017 Result Update
Outlook & Valuation
Considering strong execution trends exhibited by PNC, uptick in NHAI and MoRTH
awarding momentum, when coupled with recent NHAI announcements, we expect
further uptick in execution from here-on. On incorporating 1Q performance, we
expect PNC’s standalone business to report 20.1% top-line CAGR during FY2016-
18E to `2,904cr. We lower our EBITDA margin estimate to 13.1%/13.2% for
FY2017/18E, respectively. Given that the tax benefits availed during FY2016-18E,
would not be repeated beyond FY2018, we expect PAT to report negative 3.3%
CAGR during FY2016-18E to `227cr.
Exhibit 5: Earnings Revision
FY2017E
FY2018E
Y/E March (` cr)
Old
New Chan.(%)
Old
New Chan. (%)
Net Sales
2,350
2,350
0.0
2,904
2,904
0.0
EBITDA
315
308
(2.2)
396
382
(3.5)
EBITDA Margins (%)
13.4
13.1
13.6
13.2
PAT
245
232
(5.3)
218
227
4.1
PAT Margins (%)
6.4
9.9
7.5
7.8
Source: Angel Research
Value of Core EPC business
With applicability of normal tax rates from FY2018 onwards, we do not see a
scenario where the entire growth prospects of EPC segment (given expected uptick
in Roads and Highways award activity environment, current OB/LTM sales ratio of
3.1x), trickling down to the PAT level. We now expect PNC’s EPC business to report
20.1% top-line and -3.3% bottom-line CAGR during FY2016-18E, respectively. On
the same lines we expect RoEs of the standalone business to decline from 23.3% in
FY2016 to 13.9% in FY2018E. Accordingly, we value PNC’s core EPC business
(standalone entity) on P/E of 14.0x its FY2018E EPS of `8.8, resulting in a value of
`124/share.
August 31, 2016
6
PNC Infratech | 1QFY2017 Result Update
Exhibit 6: Sum-of-the-Parts based Valuation Table
Value/
FY18E Std.
Target
Target Value
% of
Particulars
Segment
share
Basis
PAT (` cr)
Multiple
(` cr)
SoTP
(`)
PNC's EPC business
Construction
227
14.0
3,175
124
87
P/E of 14x
Total
3,175
124
87
Adj. Equity
Value/
Equity Inv/ Disc.
Project
% of
Particulars
Proj. Type
Disc. FCFE
share
Basis
FCFE (` cr)
Stake
SoTP
(` cr)
(`)
Road BOT projects
Ghaziabad-Aligarh
Toll
194
35%
68
13
2
BV/share- 1.0x
Kanpur-Kabrai
Toll
68
100%
68
13
2
BV/share- 1.2x
Gwalior-Bhind
Toll
78
100%
78
15
2
BV/share- 1.0x
Bareilly-Almora
Toll
75
100%
75
15
2
BV/share- 1.0x
Rae Bareli-Jaunpur
Annuity
140
100%
140
27
4
BV/share- 1.0x
Narela Industrial Estate
Annuity+Fee
35
100%
35
7
1
BV/share- 1.1x
Kanpur Ayodhya
OMT
25
100%
25
5
1
FCFE, discount rate at 14%
Total
901
488
95
13
Grand Total
3,663
143
100
Upside
19%
CMP
120
Source: Company, Angel Research
Value of BOT projects
BOT projects have been valued using Book Value/Free Cash flow to Equity
holder’s method. Our value for all the 7 BOT projects comes to `19/share, which
is 13% of the overall SOTP value for the company.
On combining the value of EPC business BOT projects, we arrive at a combined
business value of `143/share, reflecting 19% upside in stock price from the current
levels. Given the upside, we maintain BUY rating on the stock.
August 31, 2016
7
PNC Infratech | 1QFY2017 Result Update
Investment arguments
Strong order inflows to lead to better execution: PNC, a north focused EPC
player, should gain from a sharp revival in NHAI and MoRTH award activity,
in-turn translating into strong order inflows over the next 12 months. We
expect PNC to report order inflows of
`5,000/4,500cr during
FY2017E/2018E, which should further lead to uptick in execution. Accordingly,
we expect PNC (on standalone basis) to report a strong 20.1% top-line CAGR
during FY2016-18E.
-3.3% PAT CAGR during FY2016-18E: Stronger execution, benefits of lower
raw material prices and absorption of fixed costs, should help PNC
(standalone entity) report 19.8% EBITDA CAGR during FY2016-18E. Entire
benefits of EBITDA growth would not trickle down to the PAT level, as the
normal tax rate would be applicable from FY2018 onwards. Accordingly, we
now expect PNC to report -3.3% PAT CAGR during the same period.
All BOT projects are operational: PNC has a portfolio of 7 BOT projects, with
all of them being operational. With commencement of all BOT projects in
FY2016E, we can expect gradual ease in the consolidated balance sheet stress
from FY2017E onwards.
Comfortable consol. D/E ratio: PNC entered the BOT space in FY2012 and
OMT space in FY2014. As a result, the consolidated debt of the company
increased from 0.2x in FY2011 to 1.2x in FY2016 (consol. debt at `1,603cr).
Management commented that they do not intend to build further the BOT
portfolio. With all pending BOT project getting operational, and PNC’s focus
to reduce additions to BOT projects portfolio, we expect consolidated D/E ratio
levels of the company to peak-out from FY2017E.
Company background
PNC Infratech Ltd (PNC), incorporated in 1999, is an Agra based infra player
mainly focused on Roads & Highways construction. PNC, in FY2012, diversified
into BOT-Toll & Annuity projects and in FY2014 into OMT projects. Currently, PNC
is executing 17 Engineering Procurement Construction (EPC) projects, 6 BOT
projects (including 2 Annuity projects) and 1 OMT project.
August 31, 2016
8
PNC Infratech | 1QFY2017 Result Update
Profit and Loss Statement (Standalone)
Y/E March (` cr)
FY14
FY15
FY16
FY17E
FY18E
Net Sales
1,145
1,561
2,014
2,350
2,904
% Chg
(12.1)
36.3
29.0
16.7
23.6
Total Expenditure
1,005
1,344
1,748
2,042
2,522
Cost of RM Consumed
372
1,196
1,434
1,741
2,147
Chg in Inventories of WIP
10
(60)
35
(23)
(15)
Employee benefits Expense
58
74
84
96
116
Other Expenses
566
135
196
228
273
EBITDA
140
217
266
308
382
% Chg
(10.0)
54.6
22.8
15.7
24.0
EBIDTA %
12.2
13.9
13.2
13.1
13.2
Depreciation
25
36
52
59
66
EBIT
115
180
213
248
316
% Chg
(13.3)
56.3
18.4
16.3
27.2
Interest Expenses
23
46
33
31
45
Other Income
11
14
20
40
20
PBT
102
148
200
257
291
Tax
36
47
(42)
26
64
% of PBT
34.8
32.1
(21.1)
10.0
22.0
PAT before Excep. Item
67
100
243
232
227
Exceptional item
0
0
0
0
0
PAT
67
100
243
232
227
% Chg
(12.6)
50.2
141.9
(4.6)
(2.0)
PAT %
5.8
6.4
12.1
9.9
7.8
Diluted EPS
2.6
3.9
9.5
9.0
8.8
% Chg
(86.4)
50.2
141.9
(4.6)
(2.0)
August 31, 2016
9
PNC Infratech | 1QFY2017 Result Update
Balance Sheet (Standalone)
Y/E March (` cr)
FY14
FY15
FY16
FY17E
FY18E
Sources of Funds
Equity Capital
40
40
51
51
51
Reserves Total
590
679
1,311
1,498
1,672
Networth
630
718
1,362
1,549
1,723
Total Debt
248
324
6
305
297
Other Long-term Liabilities
178
250
160
233
238
Deferred Tax Liability
3
0
(3)
(3)
(3)
Total Liabilities
1,058
1,293
1,525
2,084
2,255
Application of Funds
Gross Block
287
387
428
511
565
Accumulated Depreciation
134
171
223
283
348
Net Block
153
217
205
229
217
Capital WIP
2
1
9
1
1
Investments
351
424
464
849
949
Current Assets
Inventories
105
223
236
281
331
Sundry Debtors
344
367
376
555
645
Cash and Bank Balance
100
21
97
37
30
Loans, Adv. & Deposits
127
214
258
294
331
Other Current Asset
1
1
1
2
2
Current Liabilities
223
285
362
418
524
Net Current Assets
455
541
606
750
814
Other Assets
98
111
240
256
275
Total Assets
1,058
1,293
1,525
2,084
2,255
August 31, 2016
10
PNC Infratech | 1QFY2017 Result Update
Cash Flow Statement (Standalone)
Y/E March (` cr)
FY14
FY15
FY16
FY17E
FY18E
Profit before tax
103
148
200
257
291
Dep. & Other Non-cash Charges
28
28
82
51
57
Change in Working Capital
74
(105)
(209)
(147)
(84)
Interest & Financial Charges
23
46
33
31
45
Direct taxes paid
(33)
(50)
0
(26)
(64)
Cash Flow from Operations
195
67
107
167
245
(Inc)/ Dec in Fixed Assets
(54)
(100)
(49)
(75)
(54)
(Inc)/ Dec in Investments
(80)
(73)
(41)
(384)
(100)
Cash Flow from Investing
(133)
(172)
(90)
(459)
(154)
Issue/ (Buy Back) of Equity
0
0
435
0
0
Inc./ (Dec.) in Loans
21
76
(318)
299
(8)
Dividend Paid (Incl. Tax)
(3)
(7)
(37)
(45)
(53)
Net Interest Expenses
(17)
(42)
(21)
(23)
(37)
Cash Flow from Financing
0
27
59
232
(98)
Inc./(Dec.) in Cash
62
(79)
76
(61)
(7)
Opening Cash balances
38
100
21
97
37
Closing Cash balances
100
21
97
37
30
August 31, 2016
11
PNC Infratech | 1QFY2017 Result Update
Key Ratios (Standalone)
Y/E March
FY14
FY15
FY16
FY17E
FY18E
Valuation Ratio (x)
P/E (on FDEPS)
46.1
30.7
12.7
13.3
13.6
P/CEPS
33.6
22.5
10.4
10.6
10.5
Dividend yield (%)
4.0
2.0
0.4
0.3
0.3
EV/Sales
0.5
0.5
0.3
0.4
0.3
EV/EBITDA
4.5
3.6
2.0
2.9
2.3
EV / Total Assets
0.5
0.5
0.3
0.4
0.3
Per Share Data (`)
EPS (fully diluted)
16.8
25.2
47.3
45.1
44.2
Cash EPS
3.6
5.3
11.5
11.3
11.4
DPS
0.1
0.2
1.2
1.5
1.8
Book Value
25
28
53
60
67
Returns (%)
RoCE (Pre-tax)
15.0
20.2
19.4
17.9
17.3
Angel RoIC (Pre-tax)
16.5
21.6
20.5
18.7
17.6
RoE
11.2
14.9
23.3
15.9
13.9
Turnover ratios (x)
Asset Turnover (Gross Block) (x)
4.5
4.6
4.9
5.0
5.4
Inventory / Sales (days)
33
38
42
40
38
Receivables (days)
118
83
67
72
75
Payables (days)
80
69
68
70
68
WC (days)
72
52
41
43
46
Leverage Ratios (x)
D/E ratio (x)
0.4
0.5
0.0
0.2
0.2
Interest Coverage Ratio (x)
5.4
4.2
7.0
9.3
7.4
August 31, 2016
12
PNC Infratech | 1QFY2017 Result Update
Research Team Tel: 022 - 39357800
DISCLAIMER
Angel Broking Private Limited (hereinafter referred to as “Angel”) is a registered Member of National Stock Exchange of India Limited,
Bombay Stock Exchange Limited and Metropolitan Stock Exchange Limited. It is also registered as a Depository Participant with CDSL
and Portfolio Manager with SEBI. It also has registration with AMFI as a Mutual Fund Distributor. Angel Broking Private Limited is a
registered entity with SEBI for Research Analyst in terms of SEBI (Research Analyst) Regulations, 2014 vide registration number
INH000000164. Angel or its associates has not been debarred/ suspended by SEBI or any other regulatory authority for accessing
/dealing in securities Market. Angel or its associates/analyst has not received any compensation / managed or co-managed public
offering of securities of the company covered by Analyst during the past twelve months.
This document is solely for the personal information of the recipient, and must not be singularly used as the basis of any investment
decision. Nothing in this document should be construed as investment or financial advice. Each recipient of this document should
make such investigations as they deem necessary to arrive at an independent evaluation of an investment in the securities of the
companies referred to in this document (including the merits and risks involved), and should consult their own advisors to determine
the merits and risks of such an investment.
Reports based on technical and derivative analysis center on studying charts of a stock's price movement, outstanding positions and
trading volume, as opposed to focusing on a company's fundamentals and, as such, may not match with a report on a company's
fundamentals. Investors are advised to refer the Fundamental and Technical Research Reports available on our website to evaluate the
contrary view, if any.
The information in this document has been printed on the basis of publicly available information, internal data and other reliable
sources believed to be true, but we do not represent that it is accurate or complete and it should not be relied on as such, as this
document is for general guidance only. Angel Broking Pvt. Limited or any of its affiliates/ group companies shall not be in any way
responsible for any loss or damage that may arise to any person from any inadvertent error in the information contained in this report.
Angel Broking Pvt. Limited has not independently verified all the information contained within this document. Accordingly, we cannot
testify, nor make any representation or warranty, express or implied, to the accuracy, contents or data contained within this document.
While Angel Broking Pvt. Limited endeavors to update on a reasonable basis the information discussed in this material, there may be
regulatory, compliance, or other reasons that prevent us from doing so.
This document is being supplied to you solely for your information, and its contents, information or data may not be reproduced,
redistributed or passed on, directly or indirectly.
Neither Angel Broking Pvt. Limited, nor its directors, employees or affiliates shall be liable for any loss or damage that may arise from
or in connection with the use of this information.
Disclosure of Interest Statement
PNC Infratech
1. Financial interest of research analyst or Angel or his Associate or his relative
No
2. Ownership of 1% or more of the stock by research analyst or Angel or associates or relatives
No
3. Served as an officer, director or employee of the company covered under Research
No
4. Broking relationship with company covered under Research
No
Ratings (Based on expected returns
Buy (> 15%)
Accumulate (5% to 15%)
Neutral (-5 to 5%)
over 12 months investment period):
Reduce (-5% to -15%)
Sell (< -15)
August 31, 2016
13