Quick take
Nilkamal Ltd
BUY
CMP
`1,880
The furniture maker moulds the growth route
Target Price
`2,178
Nilkamal Ltd is engaged in the manufacturing and retail sales of moulded plastic
furniture and material handling products. The company has three divisions viz. plastics,
Investment Period
12 Months
lifestyle furniture and furnishings & accessories. Nilkamal’s manufacturing plants are
located at Barjora (West Bengal), Hosur (Tamil Nadu), Jammu, Dadra & Nagar Haveli,
Stock Info
Noida (UP), Sinnor and Nashik (Maharashtra) and in Pudducherry.
Sector
Plastic
Market Cap (` cr)
2,806
Market leader in plastic furniture with strong brand name: Nilkamal has strong brand
Net Debt (` cr)
98
recall and is a market leader with ~39% market share in the plastic furniture segment
Beta
0.9
(double of its closest peer). Nilkamal has planned an additional investment for 10 new
52 Week High / Low
2275/ 1258
products in the monoblock and value added segments like plastic storage. The market
Avg. Daily Volume
16,794
share of non-monoblock category in the current year would continue to witness an
Face Value (`)
10
improvement. Further, Nilkamal is a market leader in material handling segment too.
BSE Sensex
33,812
The company is optimistic regarding the revival in demand for material handling
Nifty
10,442
products, supported by various initiatives like Swachh Bharat Abhiyan, etc.
Reuters Code
NKML.BO
Mattress segment geared up for the big organised opportunity: The size of organized
Bloomberg Code
NILK.IN
mattress industry is ~`3,200cr and is envisaged to grow by 12-15% pa. Currently,
mattress segment contributes `48cr to the company’s total revenue (up ~44% yoy in
Shareholding Pattern (%)
FY17). Nilkamal is targeting revenues up to `200cr over the next 2-3 years on the back
P rom oters
64.1
of strong brand, wide distribution network and shift of consumer sentiment towards
MF / Banks / Indian Fls
9.8
branded products.
FII / NRIs / OCBs
4.4
Wide distribution network: Nilkamal has a network of nearly 980 channel partners and
Indian Public / Others
21.8
over 15,000 dealers on a pan India basis. The strong network of 40 plus depots and
300 plus sales staff assisted by a robust “SCM” system, which links the multi locational
Abs. (%)
3m
1yr
3yr
production facilities to deliver products efficiently, and has enhanced the company’s
Sensex
7.4
27.1
22.9
penetration and improved timely fill rates to modern trade outlets and e-commerce
Nikamal
21.5
47.8
300.6
portals across the country.
Retail division expected to perform better: Nilkamal continues to remain a trusted
brand among consumers with its 17 large format stores, one Go-to-Market (GTM)
store and 8 shop-in-shop stores (Shoppers Stop), spread across 14 cities, covering a
retail space of over 2.87 lakh sq. ft. Nilkamal registered flattish top-line growth last
year due to trimming down of non-profitable stores. Going forward, we expect
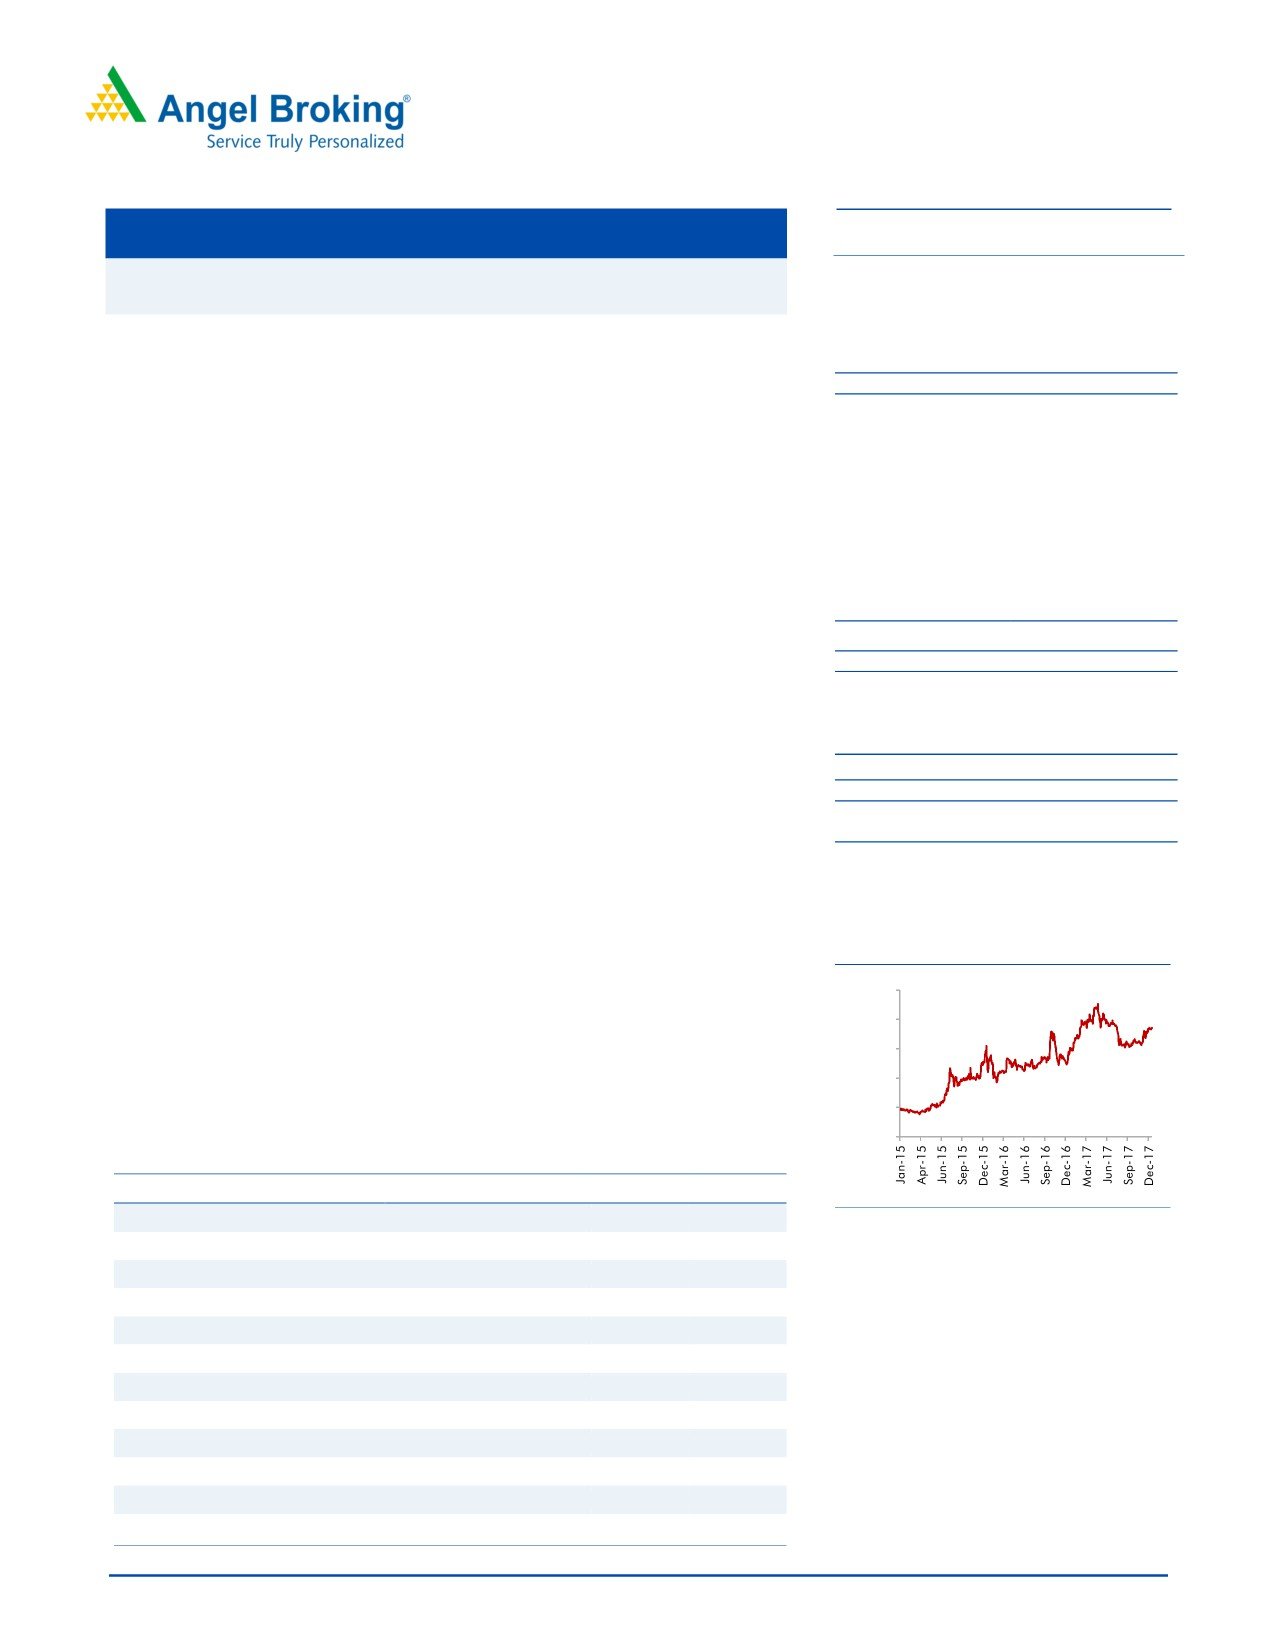
3 year daily price chart
improvement in retail space on revenue and profitability fronts backed by foray into
customized kitchens, wall units and wardrobes.
2500
Outlook and Valuation: We forecast Nilkamal to report top-line CAGR of ~9% to
2000
`2,635cr over FY17-20E on the back of healthy demand growth in plastic division. On
1500
the bottom-line front, we estimate ~10% CAGR to `162cr owing to improvement in
volumes. Further, better margins and lower interest cost would aid profitability. We
1000
initiate coverage on Nilkamal with a Buy recommendation and target price of `2,178
500
(20x FY2020E EPS), indicating an upside of ~16% from the current levels.
0
Key financials
Y/E March (` cr)
FY2016
FY2017
FY2018E
FY2019E FY2020E
Net Sales
1,926
2,024
2,097
2,333
2,635
Source: Company, Angel Research
% chg
1.7
5.1
3.6
11.3
12.9
Net Profit
114
123
123
141
162
% chg
126.0
7.4
0.7
14.6
15.0
Amarjeet S Maurya
OPM (%)
11.9
11.4
11.3
11.3
11.2
022-39357800 Ext: 6831
EPS (Rs)
76.4
82.1
82.7
94.7
108.9
P/E (x)
24.6
22.9
22.7
19.8
17.3
P/BV (x)
4.5
3.8
3.3
2.8
2.4
RoE (%)
18.2
16.5
14.4
14.2
14.1
RoCE (%)
23.9
22.0
19.2
19.6
19.7
EV/Sales (x)
1.5
1.4
1.3
1.2
1.0
EV/EBITDA (x)
12.4
12.2
11.9
10.6
9.3
Source: Company, Angel Research, Note: CMP as of January 02, 2018
Please refer to important disclosures at the end of this report
1
Quick take
Nilkamal
Company Background
Nilkamal Ltd is engaged in the manufacturing and retail sales of moulded plastic
furniture and material handling products. The company has three divisions viz.
plastics, lifestyle furniture and furnishings & accessories. The products of these
divisions are sold through the company’s retail chain “@home”. The company is
also present in the mattress business, which is relatively smaller in size. The
company’s manufacturing plants are located at Barjora (West Bengal), Hosur
(Tamil Nadu), Jammu, Kharadapada and Vasona (Dadra & Nagar Haveli), Noida
(UP), Sinnor and Nashik (Maharashtra) and in Pudducherry. Its retail store chain
“@home” operates 17 stores across 14 cities covering a retail space of over 3.15
lakh sq. ft.
Outlook and Valuation
We forecast Nilkamal to report top-line CAGR of ~9% to `2,635cr over FY17-20E
on the back of healthy demand growth in plastic division. On the bottom-line front
(reported PAT), we estimate ~10% CAGR to `162cr owing to improvement in
volumes. Further, better margins and lower interest cost would aid profitability. We
initiate coverage on Nilkamal with a Buy recommendation and target price of
`2,178 (20x FY2020E EPS), indicating an upside of ~16% from the current levels.
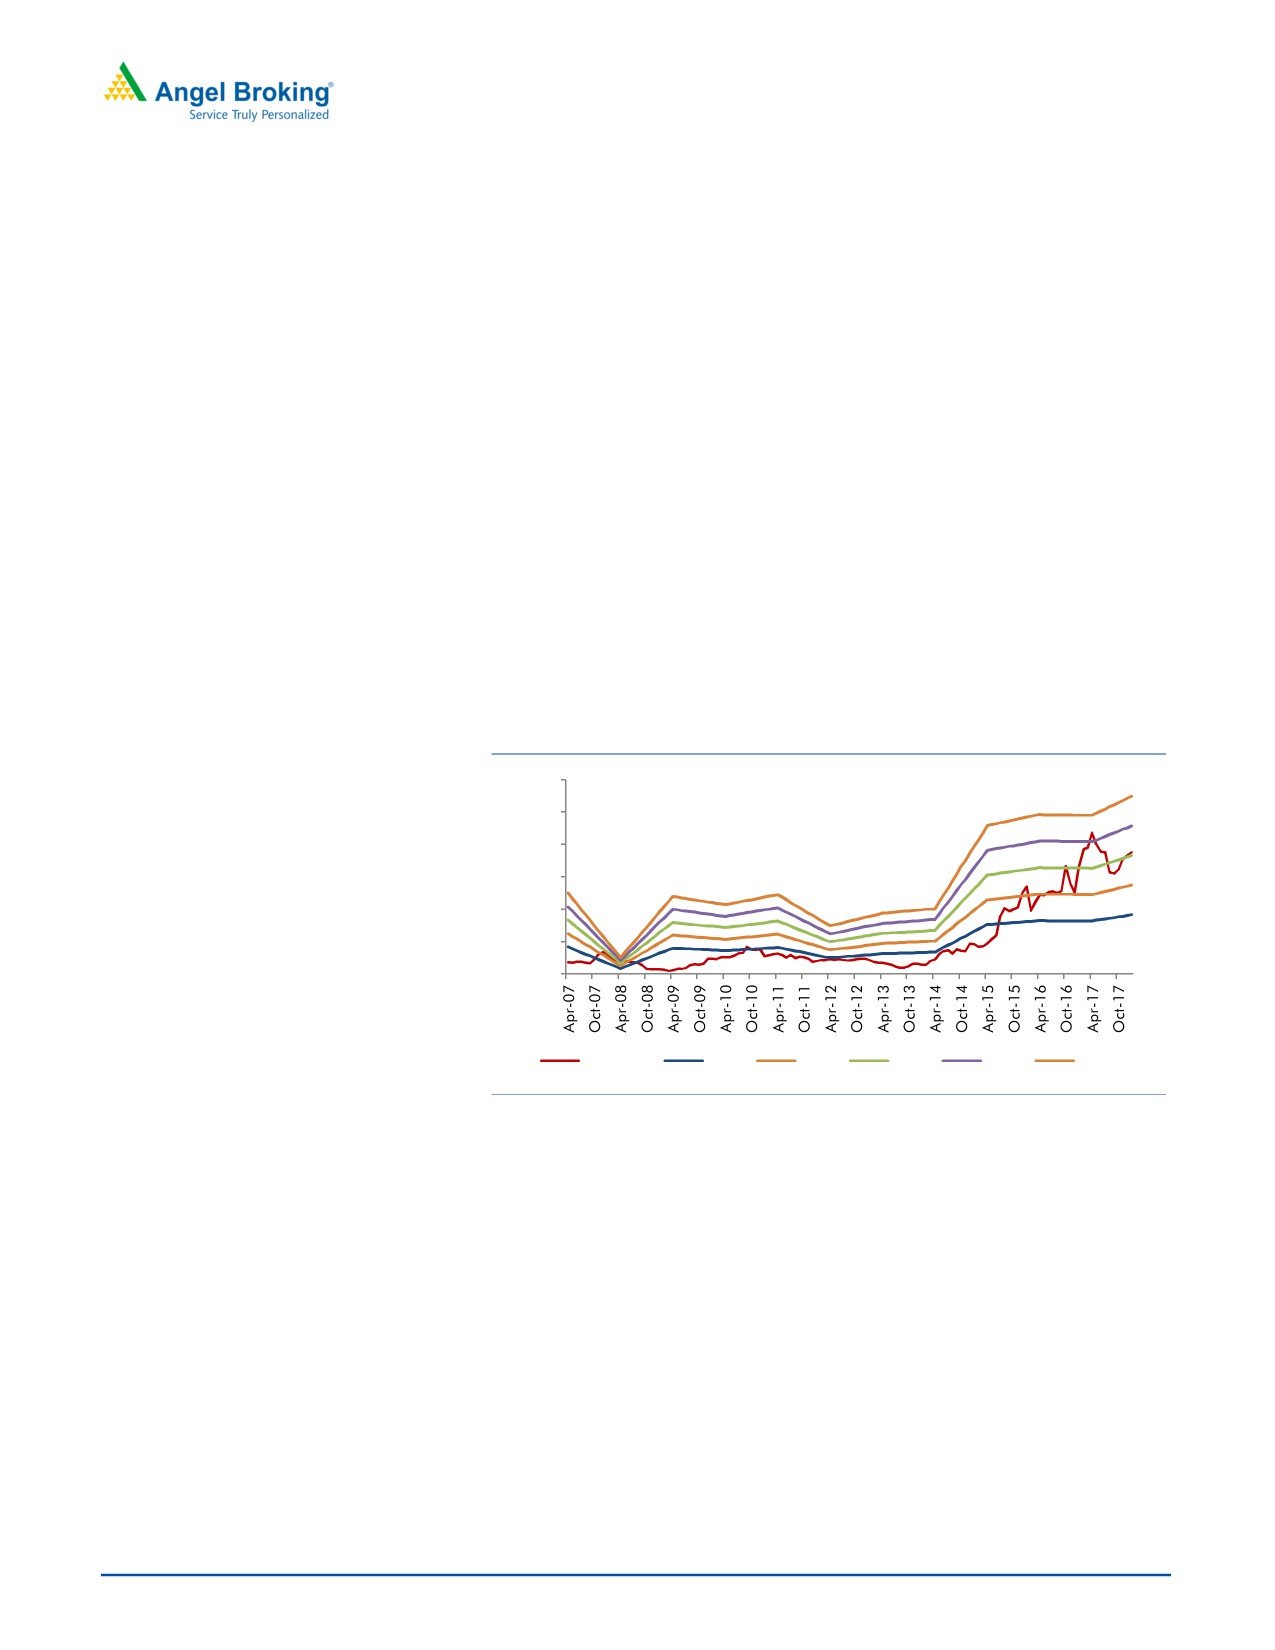
Exhibit 1: One year forward PE chart
3000
2500
2000
1500
1000
500
0
Share Price
10.0 X
15.0 X
20.0 X
25.0 X
30.0 X
Source: Company, Angel Research
Risks to our estimates
Volatile raw material prices: High volatility in crude and raw material prices could
have a negative impact on the company’s performance.
Economic slowdown: Economic slowdown will have a negative impact on the
performance of the company, as both plastics and ‘@home’ are dependent on the
economic scenario.
Competition from the unorganized segment: Availability of low priced furniture
from the unorganized segment poses a threat, as it offers lower priced products by
compromising on quality.
January 3, 2018
2
Quick take
Nilkamal
Consolidated Profit & Loss Statement
Y/E March (` cr)
FY2016
FY2017
FY2018E
FY2019E
FY2020E
Total operating income
1,926
2,024
2,097
2,333
2,635
% chg
1.7
5.1
3.6
11.3
12.9
Total Expenditure
1,696
1,792
1,860
2,070
2,340
Raw Material
1,111
1,160
1,195
1,330
1,502
Personnel
143
155
164
187
216
Others Expenses
443
478
501
553
622
EBITDA
230
232
237
264
295
% chg
49.7
0.7
2.3
11.3
11.9
(% of Net Sales)
11.9
11.4
11.3
11.3
11.2
Depreciation& Amortisation
55
51
57
61
67
EBIT
175
181
180
203
229
% chg
81.9
3.5
(0.6)
12.6
12.7
(% of Net Sales)
9.1
8.9
8.6
8.7
8.7
Interest & other Charges
18
12
10
7
3
Other Income
3
3
4
5
6
(% of PBT)
2.0
1.9
2.3
2.5
2.6
Share in profit of Associates
-
-
-
-
-
Recurring PBT
160
173
174
200
231
% chg
126.2
7.9
0.6
15.2
15.6
Tax
52
54
54
62
72
(% of PBT)
32.2
31.0
31.0
31.0
31.0
PAT (reported)
109
119
120
138
160
Minority Interest (after tax)
2
2
2
2
2
Profit/Loss of Associate Company
7
5
5
5
5
Extraordinary Items
0
(0)
-
-
-
ADJ. PAT
114
123
123
141
162
% chg
126.0
7.4
0.7
14.6
15.0
(% of Net Sales)
5.9
6.1
5.9
6.1
6.2
Basic EPS (`)
76.4
82.1
82.7
94.7
108.9
Fully Diluted EPS (`)
76.4
82.1
82.7
94.7
108.9
% chg
126.0
7.4
0.7
14.6
15.0
January 3, 2018
3
Quick take
Nilkamal
Consolidated Balance Sheet
Y/E March (` cr)
FY2016
FY2017
FY2018E
FY2019E FY2019E
SOURCES OF FUNDS
Equity Share Capital
15
15
15
15
15
Reserves& Surplus
613
727
844
980
1,136
Shareholders Funds
628
742
859
995
1,151
Minority Interest
7
7
7
7
7
Total Loans
105
83
80
40
10
Deferred Tax Liability
18
18
18
18
18
Total Liabilities
758
850
964
1,059
1,186
APPLICATION OF FUNDS
Gross Block
327
370
415
455
495
Less: Acc. Depreciation
54
99
156
217
284
Net Block
273
271
259
238
211
Capital Work-in-Progress
5
32
32
32
32
Investments
44
42
42
42
42
Current Assets
677
749
849
1,002
1,190
Inventories
305
336
368
428
484
Sundry Debtors
269
301
333
390
469
Cash
16
14
19
21
26
Loans & Advances
37
48
63
82
105
Other Assets
51
50
67
82
105
Current liabilities
248
255
229
265
300
Net Current Assets
429
494
621
737
890
Deferred Tax Asset
8
11
11
11
11
Mis. Exp. not written off
-
-
-
-
-
Total Assets
758
850
964
1,059
1,186
January 3, 2018
4
Quick take
Nilkamal
Consolidated Cash flow Statement
Y/E March (` cr)
FY2016
FY2017
FY2018E FY2019E FY2020E
Profit before tax
160
173
174
200
231
Depreciation
55
51
57
61
67
Change in Working Capital
(4)
(66)
(122)
(114)
(147)
Interest / Dividend (Net)
18
12
0
0
0
Direct taxes paid
(51)
(58)
(54)
(62)
(72)
Others
6
3
0
0
0
Cash Flow from Operations
183
114
55
85
79
(Inc.)/ Dec. in Fixed Assets
(39)
(79)
(45)
(40)
(40)
(Inc.)/ Dec. in Investments
(3)
6
3
3
3
Cash Flow from Investing
(42)
(73)
(42)
(37)
(37)
Issue of Equity
0
0
0
0
0
Inc./(Dec.) in loans
(102)
(19)
(3)
(40)
(30)
Dividend Paid (Incl. Tax)
(19)
(8)
(6)
(6)
(6)
Interest / Dividend (Net)
(25)
(16)
0
0
0
Cash Flow from Financing
(146)
(43)
(9)
(46)
(36)
Inc./(Dec.) in Cash
(5)
(2)
5
2
6
Opening Cash balances
21
16
14
19
21
Closing Cash balances
16
14
19
21
26
January 3, 2018
5
Quick take
Nilkamal
Key Ratios
Y/E March
FY2016
FY2017
FY2018E
FY2019E
FY2020E
Valuation Ratio (x)
P/E (on FDEPS)
24.6
22.9
22.7
19.8
17.3
P/CEPS
17.2
16.5
15.9
14.1
12.4
P/BV
4.5
3.8
3.3
2.8
2.4
Dividend yield (%)
0.4
0.2
0.2
0.2
0.2
EV/Sales
1.5
1.4
1.3
1.2
1.0
EV/EBITDA
12.4
12.2
11.9
10.6
9.3
EV / Total Assets
3.8
3.3
2.9
2.6
2.3
Per Share Data (Rs)
EPS (Basic)
76.4
82.1
82.7
94.7
108.9
EPS (fully diluted)
76.4
82.1
82.7
94.7
108.9
Cash EPS
109.6
113.7
118.6
133.5
151.6
DPS
7.0
4.0
4.0
4.0
4.0
Book Value
420.6
497.3
575.9
666.6
771.5
Returns (%)
ROCE
23.9
22.0
19.2
19.6
19.7
Angel ROIC (Pre-tax)
26.0
23.5
20.5
20.8
20.9
ROE
18.2
16.5
14.4
14.2
14.1
Turnover ratios (x)
Asset Turnover (Gross Block)
5.9
5.5
5.1
5.1
5.3
Inventory / Sales (days)
58
61
64
67
67
Receivables (days)
51
54
58
61
65
Payables (days)
22
21
19
19
19
Working capital cycle (ex-cash) (days)
87
94
103
109
113
Source: Company, Angel Research
-
January 3, 2018
6
Quick take
Nilkamal
Research Team Tel: 022 - 39357800
DISCLAIMER
Angel Broking Private Limited (hereinafter referred to as “Angel”) is a registered Member of National Stock Exchange of India Limited,
Bombay Stock Exchange Limited and MCX Stock Exchange Limited. It is also registered as a Depository Participant with CDSL and
Portfolio Manager with SEBI. It also has registration with AMFI as a Mutual Fund Distributor. Angel Broking Private Limited is a
registered entity with SEBI for Research Analyst in terms of SEBI (Research Analyst) Regulations, 2014 vide registration number
INH000000164. Angel or its associates has not been debarred/ suspended by SEBI or any other regulatory authority for accessing
/dealing in securities Market. Angel or its associates including its relatives/analyst do not hold any financial interest/beneficial
ownership of more than 1% in the company covered by Analyst. Angel or its associates/analyst has not received any compensation /
managed or co-managed public offering of securities of the company covered by Analyst during the past twelve months. Angel/analyst
has not served as an officer, director or employee of company covered by Analyst and has not been engaged in market making activity
of the company covered by Analyst.
This document is solely for the personal information of the recipient, and must not be singularly used as the basis of any investment
decision. Nothing in this document should be construed as investment or financial advice. Each recipient of this document should
make such investigations as they deem necessary to arrive at an independent evaluation of an investment in the securities of the
companies referred to in this document (including the merits and risks involved), and should consult their own advisors to determine
the merits and risks of such an investment.
Reports based on technical and derivative analysis center on studying charts of a stock's price movement, outstanding positions and
trading volume, as opposed to focusing on a company's fundamentals and, as such, may not match with a report on a company's
fundamentals.
The information in this document has been printed on the basis of publicly available information, internal data and other reliable
sources believed to be true, but we do not represent that it is accurate or complete and it should not be relied on as such, as this
document is for general guidance only. Angel Broking Pvt. Limited or any of its affiliates/ group companies shall not be in any way
responsible for any loss or damage that may arise to any person from any inadvertent error in the information contained in this report.
Angel Broking Pvt. Limited has not independently verified all the information contained within this document. Accordingly, we cannot
testify, nor make any representation or warranty, express or implied, to the accuracy, contents or data contained within this document.
While Angel Broking Pvt. Limited endeavors to update on a reasonable basis the information discussed in this material, there may be
regulatory, compliance, or other reasons that prevent us from doing so.
This document is being supplied to you solely for your information, and its contents, information or data may not be reproduced,
redistributed or passed on, directly or indirectly.
Neither Angel Broking Pvt. Limited, nor its directors, employees or affiliates shall be liable for any loss or damage that may arise from
or in connection with the use of this information.
Note: Please refer to the important ‘Stock Holding Disclosure' report on the Angel website (Research Section). Also, please refer to the
latest update on respective stocks for the disclosure status in respect of those stocks. Angel Broking Pvt. Limited and its affiliates may
have investment positions in the stocks recommended in this report.
Disclosure of Interest Statement
Nilkamal Ltd
1. Analyst ownership of the stock
No
2. Angel and its Group companies ownership of the stock
No
3. Angel and its Group companies' Directors ownership of the stock
No
4. Broking relationship with company covered
No
Note: We have not considered any Exposure below ` 1 lakh for Angel, its Group companies and Directors
Ratings (Based on expected returns
Buy (> 15%)
Accumulate (5% to 15%)
Neutral (-5 to 5%)
over 12 months investment period):
Reduce (-5% to -15%)
Sell (< -15)
January 3, 2018
7