4QFY2016 Result Update | Logistics
June 1, 2016
Navkar Corporation
BUY
CMP
`200
Performance Update
Target Price
`265
Y/E March (` cr)
4QFY2016 4QFY2015
% chg (yoy) 3QFY2016
% chg (qoq)
Investment Period
12 Months
Net sales
91
84
8.5
88
3.6
EBITDA
38
28
38.4
37
3.3
Stock Info
EBITDA margin (%)
41.9
32.8
904bp
42.0
(9)bp
Adjusted PAT
26
12
107.4
29
(10.4)
Sector
Logistics
Source: Company, Angel Research
Market Cap (` cr)
2,851
Net Debt
161
Navkar Corporation (Navkar) reported a good set of numbers for 4QFY2016.
Beta
0.6
The consolidated top-line grew by 8.5% yoy. On the operating front, the company
52 Week High / Low
221 / 151
reported a margin expansion on account of sharp decline in other operating
Avg. Daily Volume
130,794
expenses. The net profit grew by ~107% yoy due to significantly higher other
Face Value (`)
10
income and a better operating performance.
BSE Sensex
26,668
Top-line grew 8.5% yoy: The consolidated top-line grew by 8.5% yoy to ~`91cr
Nifty
8,160
led by higher volumes and improvement in realizations. For 4QFY2016, the
Reuters Code
NA
volumes grew by 18.5% to 81,183 TEUs (twenty-foot equivalent units) which
Bloomberg Code
NACO@IN
included 2,000 TEUs from Vapi. Empty containers handled stood at 3,000 TEUs
against 5,000 TEUs handled in 3QFY2016 which improved the realizations. The
number of trains ran by the company increased by 14 over the past quarter to
Shareholding Pattern (%)
220 trains. For FY2016, the volumes grew by ~15% to ~3,08,000 TEUs and the
Promoters
72.9
company ran 765 trains during the year with the share of rail increasing to 22%
MF / Banks / Indian Fls
16.6
vs 15% in FY2015. The import-export mix remained unchanged at 55:45.
FII / NRIs / OCBs
6.5
PAT grew ~107% yoy: On the operating front, the company reported a margin
Indian Public / Others
4.1
expansion of 904bp yoy to 41.9% on account of the sharp decline in other
operating expenses by 816bp yoy to 51.1% of sales. As a result, the EBITDA grew
by 38.4% yoy to `38cr. Aided by a better operating performance and higher
Abs. (%)
3m 1yr 3yr
other income, the net profit grew by ~107% yoy to ~`26cr.
Sensex
15.9
4.2
35.0
Outlook and Valuation: We estimate Navkar to post a revenue CAGR of 32.7%
NCL
32.2
NA NA
and PAT CAGR of 31.3% over FY2016-18E. We have factored in lower utilization
levels of 34.7% and 42.6% for FY2017E and FY2018E, respectively. At the current
levels, the stock is trading at 17.4x its FY2018E earnings. Historically, Navkar has
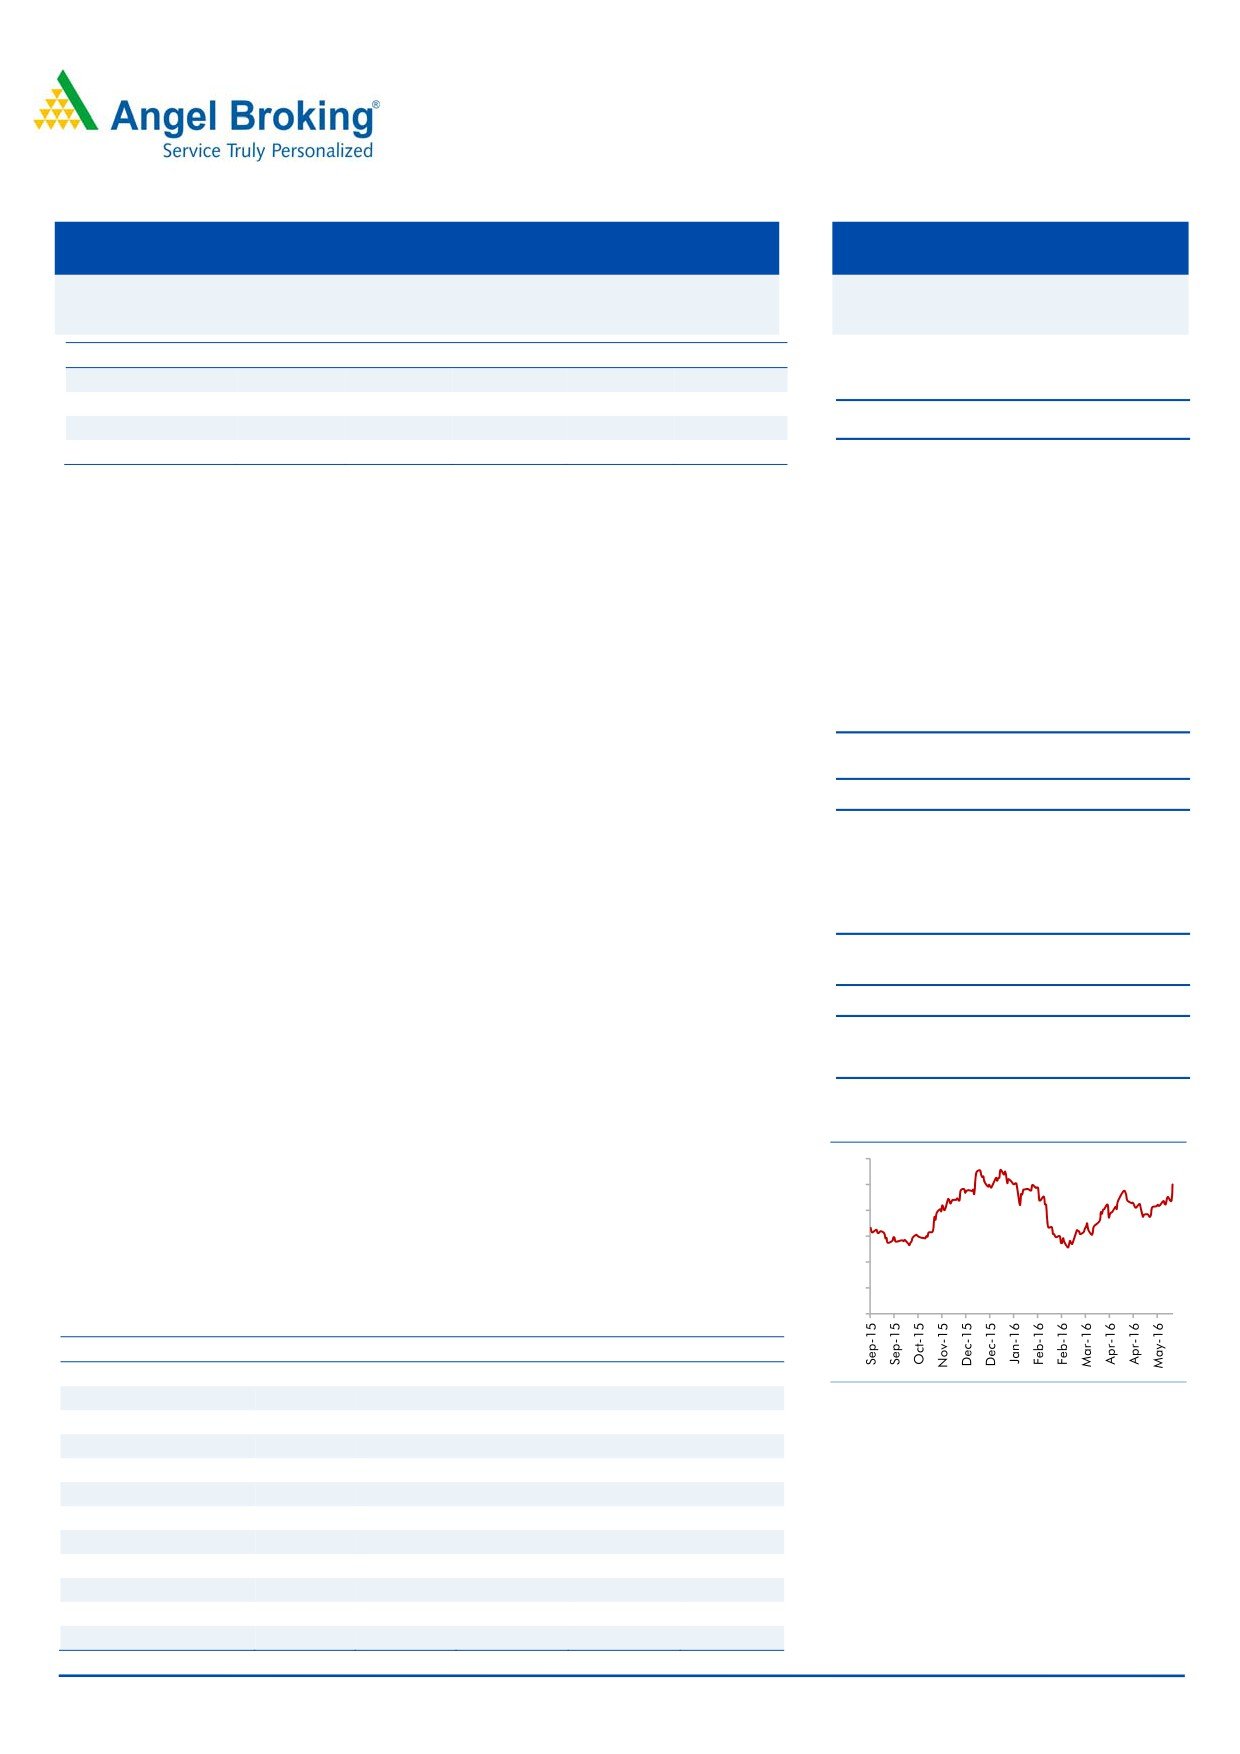
Historical share price chart
consistently grown at JNPT and increased its utilisation from 68% in FY2012 to
220
87% in FY2015 by leveraging on its rail advantage during periods when JNPT
200
posted flattish volume growth. Going forward, we expect Navkar’s utilizations to
180
improve; we expect the company to be able to garner a good chunk of business
160
over the next three to four years due to its rail advantage at both JNPT and Vapi.
140
We maintain our Buy recommendation on the stock with a target price of `265.
120
100
Key Financials
Y/E March (` cr)
FY2014
FY2015
FY2016
FY2017E FY2018E
Net sales
349
329
347
408
612
% chg
4.8
(5.9)
5.6
17.6
49.7
Source: Company, Angel Research
Adj. Net profit
90
68
95
97
164
% chg
58.7
(24.0)
39.0
1.5
69.8
EBITDA margin (%)
35.5
40.7
43.2
42.9
42.3
Amarjeet S Maurya
EPS (`)
6.3
4.8
6.7
6.8
11.5
022-40003600 Ext: 6831
P/E (x)
31.7
41.7
30.0
29.5
17.4
P/BV (x)
6.7
3.8
2.2
2.0
1.8
RoE (%)
21.0
9.1
7.3
6.9
10.5
RoCE (%)
12.8
9.1
7.5
8.1
11.6
Milan Desai
EV/Sales (x)
9.4
10.3
8.7
7.9
5.3
022-40003600 Ext: 6846
EV/EBITDA (x)
26.3
25.4
20.1
18.4
12.4
Source: Company, Angel Research; Note: CMP as of May 31, 2016
Please refer to important disclosures at the end of this report
1
Navkar Corporation | 4QFY2016 Result Update
Exhibit 1: 4QFY2016 Performance
Y/E March (` cr)
4QFY16
4QFY15
% yoy
3QFY16
% qoq
FY16
FY15
% chg
Net Sales
91
84
8.5
88
3.6
347
329
5.6
Staff Costs
6
7
(3.5)
7
(7.2)
25
22
11.4
(% of Sales)
7.0
7.9
(88)bp
7.8
(81)bp
7.1
6.8
37bp
Other Expenses
47
50
(6.4)
44
5.4
172
173
(0.1)
(% of Sales)
51.1
59.3
(816)bp
50.2
90bp
49.7
52.5
(287)bp
Total Expenditure
53
57
(6.1)
51
3.7
197
195
1.2
Operating Profit
38
28
38.4
37
3.3
150
134
12.1
OPM
41.9
32.8
42.0
43.2
40.7
Interest
7
4
89.8
7
(6.0)
40
41
(2.5)
Depreciation
5
4
22.0
5
(1.3)
19
15
27.0
Other Income
7
0
1,232.2
10
(34.7)
23
2
977.6
PBT (excl. Ext Items)
33
21
60.9
35
(4.9)
114
80
42.6
Ext (Income)/Expense
-
-
-
-
PBT (incl. Ext Items)
33
21
60.9
35
(4.9)
114
80
42.6
(% of Sales)
36.2
24.4
39.5
32.9
24.4
Provision for Taxation
7
8
6
19
12
64.1
(% of PBT)
22.1
39.5
17.3
16.7
14.6
Reported PAT
26
12
107.4
29
(10.4)
95
68
39.0
PATM
28.2
14.8
32.6
27.4
20.8
Minority Interest After NP
Extra-ordinary Items
Reported PAT
26
12
107.4
29
(10.4)
95
68
39.0
PATM
28.2
14.8
32.6
27.4
20.8
Source: Company, Angel Research
June 1, 2016
2
Navkar Corporation | 4QFY2016 Result Update
Investment Arguments
Upcoming ICD to provide an edge
The Vapi region has a huge potential as it is a well developed industrial area. As
per the Management and industry sources, the Vapi region accounts for close to
27% of container volumes at JNPT. We believe that the company’s inland
container depot (ICD; with rail connectivity) at Vapi will enable Navkar to garner a
good portion of the business from the region. At present, imports headed for the
region have to get custom cleared at container freight station (CFS)/ICD at JNPT
and are then transported via road. With rail transport being a more economical
option compared to road, the imports should head directly to Vapi ICD. As for exports
from Vapi region, a large portion (~60%) is stuffed at factory and transported to JNPT.
However, the balance 40% or ~170,000 TEUs (less-than-container load [LCL]) which
is being transported via road and consolidated at JNPT, can be consolidated at the
ICD. Once the scale advantages kick in, and given the rail advantage, the company
can also cater to some portion of bulkier factory stuffed cargo.
Capacity enhancement at Somathane to aid revenue growth
The company has managed to outgrow its peers in the region by attracting
volumes on the back of its rail advantage. Navkar has been facing capacity
constraints at JNPT and is forced to reject certain bulk commodities like PTA, Fiber,
Scrap, Marble, etc. Although the current South Gujarat volume of Navkar
(~70,000 TEUs) is expected to shift to the Vapi ICD, the company will now be able
to handle these bulk commodities and effectively utilize its extended capacity.
Navkar will now also be handling domestic traffic, which it had been rejecting
earlier, thus aiding growth.
Logistics park at Vapi to be an additional revenue driver
The logistics park will be a one-stop solution for importers and exporters, providing
a host of warehousing and other value added services. Its close proximity to one of
the largest industrial clusters in India augurs well for Navkar.
June 1, 2016
3
Navkar Corporation | 4QFY2016 Result Update
Outlook and Valuation
We estimate Navkar to post a revenue CAGR of 32.7% and PAT CAGR of 31.3%
over FY2016-18E. We have factored in lower utilization levels of 34.7% and 42.6%
for FY2017E and FY2018E, respectively. At the current levels, the stock is trading
at 17.4x its FY2018E earnings. Historically, Navkar has consistently grown at JNPT
and increased its utilisation from 68% in FY2012 to 87% in FY2015 by leveraging
on its rail advantage during periods when JNPT posted flattish volume growth.
Going forward, we expect Navkar’s utilizations to improve; we expect the company
to be able to garner a good chunk of business over the next three to four years
due to its rail advantage at both JNPT and Vapi. We maintain our Buy
recommendation on the stock with a target price of `265.
Downside risks to our estimates include
The company is exposed to currency risk with foreign currency debt of `194cr
on its balance sheet (as of 31-03-2015). The company uses dollar call options
to hedge against dollar appreciation and as per the term, the foreign currency
debt will get converted to INR debt upon dollar rate hitting the strike price. In
this event, the interest rate on the INR debt will be at ~12%.
Currently the company is paying lower taxes, with it getting tax benefits for its
CFS operations. Once the exemption period is over, the company will have to
pay higher taxes, which could impact its earnings growth.
Delay in capacity expansion and lower than expected utilization of existing
CFS as well as existing players increasing their capacity at JNPT could impact
the profitability of the company. Delay in capacity enhancement at JNPT can
also impact the top-line.
The company operates a private freight terminal (PFT) at JNPT which has
helped the company in increasing its volumes. Lapse in agreement with the
Indian Railways will lead to the company being unable to operate its PFT.
June 1, 2016
4
Navkar Corporation | 4QFY2016 Result Update
Company Background
Navkar is a CFS operator with three CFSs, Ajivali CFS I and Ajivali CFS II at Ajivali
and one at Somathane. All of its CFS units are strategically located in close
proximity to JNPT which is the largest container port in India. As of May 31, 2015,
Navkar’s CFSs had an aggregate installed handling capacity of 310,000 TEUs per
annum. It has a PFT which facilitates loading and unloading of cargo from
container trains operating between Somathane CFS and JNPT and to transport
domestic cargo to and from inland destinations on the Indian rail network. As of
May 31, 2015, it also owns and operates 516 trailers for the transportation of
cargo between its CFSs and the JN Port by road. The company offers services like
cargo storage facilities at CFSs, packing, labeling/bar-coding, palletizing,
fumigation and other related activities. It also provides warehousing facilities, for
which, it occupies an aggregate area of 500,000 sq ft.
Exhibit 2: CFS details
Particulars
Ajivali CFS I
Ajivali CFS II
Somathane CFS
Somathane/Ashte
Location
Ajivali village, Panvel Ajivali village, Panvel
village, Panvel
Area Custom Notified
135,156 sq. ft.
428,400 sq. ft.
1,073,224.35 sq. ft.
Operational since
May 12, 2008
May 18, 2006
May 11, 2009
Installed Capacity per
25,000 TEUs
65,000 TEUs
220,000 TEUs
annum
Bonded warehouse
-
27,641 sq. feet
33,141 sq. feet
Reefer Points
16
24
52
Temperature controlled
-
500 m
-
chambers
Authorized to handle,
Authorized to handle,
store and deliver
store and deliver
Hazardous cargo
-
hazardous cargo up to
hazardous cargo, up
the total installed
to the total installed
capacity per annum capacity per annum
Connectivity
Road
Road
Rail and road
Source: Company, Angel Research
June 1, 2016
5
Navkar Corporation | 4QFY2016 Result Update
Consolidated Profit & Loss Statement
Y/E March (` cr)
FY2014
FY2015
FY2016
FY2017E
FY2018E
Total operating income
349
329
347
408
612
% chg
4.8
(5.9)
5.6
17.6
49.7
Total Expenditure
225
195
197
233
353
Operating Expenses
117
138
144
170
256
Purchases of Traded Goods
60
-
-
-
-
Personnel Expenses
19
22
25
31
48
Others Expenses
29
34
29
33
49
EBITDA
124
134
150
175
259
% chg
21.9
7.9
12.2
16.7
47.6
(% of Net Sales)
35.5
40.7
43.2
42.9
42.3
Depreciation& Amortisation
13
15
19
26
29
EBIT
111
119
131
149
229
% chg
21.3
6.8
10.2
13.8
54.2
(% of Net Sales)
31.8
36.1
37.7
36.4
37.5
Interest & other Charges
33
26
23
40
41
Other Income
4
2
23
5
5
(% of PBT)
4.7
2.3
17.7
4.4
2.6
Share in profit of Associates
-
-
-
-
-
Recurring PBT
82
94
131
114
193
% chg
28.4
15.3
38.6
(13.1)
69.8
Prior Period & Extraord.
-
Exp./(Inc.)
PBT (reported)
82
94
131
114
193
Tax
9
12
19
17
29
(% of PBT)
10.8
12.4
14.6
15.0
15.0
PAT (reported)
73
83
112
97
164
Extraordinary Items
17
(14)
(17)
-
-
ADJ. PAT
90
68
95
97
164
% chg
58.7
(24.0)
39.0
1.5
69.8
(% of Net Sales)
25.8
20.8
27.4
23.6
26.8
Basic EPS (`)
6.3
4.8
6.7
6.8
11.5
Fully Diluted EPS (`)
6.3
4.8
6.7
6.8
11.5
% chg
58.7
(24.0)
39.0
1.5
69.8
June 1, 2016
6
Navkar Corporation | 4QFY2016 Result Update
Consolidated Balance Sheet
Y/E March (` cr)
FY2014
FY2015
FY2016E FY2017E FY2018E
SOURCES OF FUNDS
Equity Share Capital
21
112
145
145
145
Reserves& Surplus
407
638
1,153
1,250
1,414
Shareholders’ Funds
428
750
1,298
1,395
1,559
Minority Interest
-
-
-
-
-
Total Loans
437
555
452
440
420
Deferred Tax Liability
28
33
33
33
33
Total Liabilities
893
1,338
1,783
1,868
2,012
APPLICATION OF FUNDS
Gross Block
699
1,133
1,256
1,529
1,549
Less: Acc. Depreciation
43
59
79
105
134
Net Block
656
1,073
1,177
1,424
1,415
Capital Work-in-Progress
44
27
27
27
27
Investments
20
5
-
-
-
Current Assets
198
253
603
442
610
Inventories
-
2
2
2
3
Sundry Debtors
76
77
83
97
146
Cash
1
1
290
69
52
Loans & Advances
45
48
52
69
104
Other Assets
76
126
175
204
306
Current liabilities
25
22
25
26
42
Net Current Assets
172
231
577
416
569
Deferred Tax Asset
1
1
1
1
1
Mis. Exp. not written off
-
-
-
-
-
Total Assets
893
1,338
1,783
1,868
2,012
June 1, 2016
7
Navkar Corporation | 4QFY2016 Result Update
Consolidated Cashflow Statement
Y/E March (` cr)
FY2014
FY2015
FY2016E FY2017E FY2018E
Profit before tax
99
80
131
114
193
Depreciation
13
15
19
26
29
Change in Working Capital
(29)
7
(56)
(60)
(170)
Interest / Dividend (Net)
33
26
23
40
41
Direct taxes paid
(16)
(22)
(19)
(17)
(29)
Others
(17)
18
-
-
-
Cash Flow from Operations
82
123
98
103
64
(Inc.)/ Dec. in Fixed Assets
(93)
(209)
(123)
(273)
(20)
(Inc.)/ Dec. in Investments
-
15
5
-
-
Cash Flow from Investing
(93)
(194)
(118)
(273)
(20)
Issue of Equity
35
-
453
-
-
Inc./(Dec.) in loans
10
97
(103)
(12)
(20)
Dividend Paid (Incl. Tax)
-
-
-
-
-
Interest / Dividend (Net)
1
(27)
413
(40)
(41)
Cash Flow from Financing
10
71
310
(52)
(61)
Inc./(Dec.) in Cash
(1)
0
289
(222)
(17)
Opening Cash balances
2
1
1
290
69
Closing Cash balances
1
1
290
69
52
June 1, 2016
8
Navkar Corporation | 4QFY2016 Result Update
Key Ratios
Y/E March
FY2014
FY2015
FY2016E FY2017E FY2018E
Valuation Ratio (x)
P/E (on FDEPS)
31.7
41.7
30.0
29.5
17.4
P/CEPS
33.1
29.1
21.8
23.2
14.8
P/BV
6.7
3.8
2.2
2.0
1.8
Dividend yield (%)
0.0
0.0
0.0
0.0
0.0
EV/Sales
9.4
10.3
8.7
7.9
5.3
EV/EBITDA
26.3
25.4
20.1
18.4
12.4
EV / Total Assets
3.6
2.5
1.7
1.7
1.6
Per Share Data (`)
EPS (Basic)
6.3
4.8
6.7
6.8
11.5
EPS (fully diluted)
6.3
4.8
6.7
6.8
11.5
Cash EPS
6.0
6.9
9.2
8.6
13.6
DPS
0.0
0.0
0.0
0.0
0.0
Book Value
30.0
52.6
91.0
97.8
109.3
Returns (%)
ROCE
12.8
9.1
7.5
8.1
11.6
Angel ROIC (Pre-tax)
13.2
9.1
9.0
8.4
11.9
ROE
21.0
9.1
7.3
6.9
10.5
Turnover ratios (x)
Asset Turnover (Gross Block)
0.5
0.3
0.3
0.3
0.4
Inventory / Sales (days)
-
2
2
2
2
Receivables (days)
80
86
87
87
87
Payables (days)
7
7
5
4
4
Wc cycle (ex-cash) (days)
72
81
84
85
85
June 1, 2016
9
Navkar Corporation | 4QFY2016 Result Update
Research Team Tel: 022 - 39357800
DISCLAIMER
Angel Broking Private Limited (hereinafter referred to as “Angel”) is a registered Member of National Stock Exchange of India Limited,
Bombay Stock Exchange Limited and Metropolitan Stock Exchange of India Limited. It is also registered as a Depository Participant with
CDSL and Portfolio Manager with SEBI. It also has registration with AMFI as a Mutual Fund Distributor. Angel Broking Private Limited is
a registered entity with SEBI for Research Analyst in terms of SEBI (Research Analyst) Regulations, 2014 vide registration number
INH000000164. Angel or its associates has not been debarred/ suspended by SEBI or any other regulatory authority for accessing
/dealing in securities Market. Angel or its associates including its relatives/analyst do not hold any financial interest/beneficial
ownership of more than 1% in the company covered by Analyst. Angel or its associates/analyst has not received any compensation /
managed or co-managed public offering of securities of the company covered by Analyst during the past twelve months. Angel/analyst
has not served as an officer, director or employee of company covered by Analyst and has not been engaged in market making activity
of the company covered by Analyst.
This document is solely for the personal information of the recipient, and must not be singularly used as the basis of any investment
decision. Nothing in this document should be construed as investment or financial advice. Each recipient of this document should
make such investigations as they deem necessary to arrive at an independent evaluation of an investment in the securities of the
companies referred to in this document (including the merits and risks involved), and should consult their own advisors to determine
the merits and risks of such an investment.
Reports based on technical and derivative analysis center on studying charts of a stock's price movement, outstanding positions and
trading volume, as opposed to focusing on a company's fundamentals and, as such, may not match with a report on a company's
fundamentals.
The information in this document has been printed on the basis of publicly available information, internal data and other reliable
sources believed to be true, but we do not represent that it is accurate or complete and it should not be relied on as such, as this
document is for general guidance only. Angel Broking Pvt. Limited or any of its affiliates/ group companies shall not be in any way
responsible for any loss or damage that may arise to any person from any inadvertent error in the information contained in this report.
Angel Broking Pvt. Limited has not independently verified all the information contained within this document. Accordingly, we cannot
testify, nor make any representation or warranty, express or implied, to the accuracy, contents or data contained within this document.
While Angel Broking Pvt. Limited endeavors to update on a reasonable basis the information discussed in this material, there may be
regulatory, compliance, or other reasons that prevent us from doing so.
This document is being supplied to you solely for your information, and its contents, information or data may not be reproduced,
redistributed or passed on, directly or indirectly.
Neither Angel Broking Pvt. Limited, nor its directors, employees or affiliates shall be liable for any loss or damage that may arise from
or in connection with the use of this information.
Note: Please refer to the important ‘Stock Holding Disclosure' report on the Angel website (Research Section). Also, please refer to the
latest update on respective stocks for the disclosure status in respect of those stocks. Angel Broking Pvt. Limited and its affiliates may
have investment positions in the stocks recommended in this report.
Disclosure of Interest Statement
Navkar Corporation
1. Analyst ownership of the stock
No
2. Angel and its Group companies ownership of the stock
No
3. Angel and its Group companies' Directors ownership of the stock
No
4. Broking relationship with company covered
No
Note: We have not considered any Exposure below ` 1 lakh for Angel, its Group companies and Directors
Ratings (Based on expected returns
Buy (> 15%)
Accumulate (5% to 15%)
Neutral (-5 to 5%)
over 12 months investment period):
Reduce (-5% to -15%)
Sell (< -15)
June 1, 2016
10