IPO Note | Hospitals
December 16, 2015
Narayana Hrudayalaya
NEUTRAL
Issue Open: December 17, 2015
IPO Note
Issue Close: December 21, 2015
Narayana Hrudayalaya (NHL) is one of the leading private healthcare service
providers in India with a strong presence in Karnataka and the Eastern region
Face Value: `10
with while it is growing its presence is other parts of India as well. The company
Present Eq. Paid up Capital: `200cr
has a relatively light asset model with it owning just 1,613 out of its 5,442 operational
Offer Size: 2.5cr Shares
beds. It has a strong brand name and is known for its clinical excellence and being an
affordable healthcare service provider. It currently has 23 hospitals.
Post Eq. Paid up Capital: `200cr
Potential improvement in profitability: Generally, hospital businesses have a long
Issue size (amount)**: `600cr - `613cr
gestation period before they mature (in terms of occupancy rates) and it may
operate at a loss for a period of time before achieving profitability. Currently,
Price Band**: `245-250
NHL is in an investment phase where the company has increased its bed count at
Post-issue implied mcap**: `5,007cr-5,109cr
a higher rate in comparison to its peer Apollo Hospitals (Apollo). As a result, its
top-line has grown at a faster rate but its occupancy and profitability levels are
Promoters holding Pre-Issue: 64.0%
not as high as that of Apollo. Going forward, with NHL’s pace of expansion being
Promoters holding Post-Issue: 62.0%
slightly slower than in the past, we expect it to gradually increase its occupancy
Note:**at Lower and Upper price band respectively
rates and enhance its profitability.
Upcoming projects under light asset model to complement growing need for
healthcare delivery in India: Unlike its peers, which have higher number of owned
Book Building
hospitals, NHL has fewer owned hospitals while the rest are on either lease &
operate, revenue sharing, or managed basis. Going forward, the company plans
QIBs
At least 50%
to expand its bed-count following the asset light route, which would include PPP or
Non-Institutional
At least 15%
on operation and management basis, to grow its presence in other parts of the
country. Moreover, India lags behind other developing and developed countries
Retail
At least 35%
in terms of overall bed density, total expenditure on healthcare, and consumers
here incur a higher out-of-pocket expenditure on healthcare. We believe that the
company can gradually build its presence with efficient use of capital and by
Post Issue Shareholding Pattern (%
leveraging on its brand name to capitalize on the available opportunity in the
Promoters Group
62.0
under-penetrated healthcare delivery market in India.
MF/Banks/Indian
Outlook and Valuation: Currently, NHL’s operating margin is lower than its close
FIs/FIIs/Public & Others
38.0
peer Apollo Hospitals on account of lower realizations (focus on affordable
healthcare) and has lower occupancy rates. Since the hospital business has longer
gestation period, we expect the occupancy and overall profitability to improve
over a longer period of time. On the valuation front, at the upper end of the price
band, FY2016E annualized EV/Sales multiple works out to 3.4x for NHL which is
not at a significant discount to Apollo (which trades at 3.6x). Hence we have a
Neutral view on the IPO from a short term perspective. However, investors with a longer
term investment horizon can subscribe to the issue considering that the company’s
performance is expected to be more favorable in the longer run as the hospital business
entails a longer gestation period and takes time to perform at optimum levels.
Key Financial Consolidated
Y/E March (` cr)
FY2012
FY2013
FY2014
FY2015
Net Sales
658
839
1,095
1,364
% chg
37.7
27.6
30.5
24.5
Net Profit
26
25
32
(11)
% chg
88.8
(3.7)
27.9
(134.3)
OPM (%)
12.5
9.7
11.0
9.5
Amarjeet Maurya
EPS (`)
1.3
1.2
1.6
(0.5)
P/E (x)
198.4
206.0
161.1
-
+91 22 4000 3600 Ext: 6831
P/BV (x)
9.9
9.3
8.8
6.7
RoE (%)
5.0
4.5
5.5
-
RoCE (%)
7.1
4.6
7.3
5.8
Milan Desai
EV/Sales (x)
7.9
6.3
4.8
3.9
+91 22 4000 3600 Ext: 6846
EV/EBITDA (x)
63.3
65.2
44.2
41.3
Source: Company, Angel Research, valuation ratios calculated at upper end of price band
Please refer to important disclosures at the end of this report
1
Narayana Hrudayalaya | IPO Note
Company Background
Founded in 2000 by Dr. Devi Prasad Shetty (Promoter), NHL is one of the leading
private healthcare service providers in India, operating a chain of multispecialty,
tertiary and primary healthcare facilities. Currently, NHL has a network of 23
hospitals (multispecialty and super specialty healthcare facilities which provide
tertiary care), 8 heart centers (super specialty units which are set up in a third party
hospital) and 24 primary care facilities (including clinics and information centers),
across a total of 31 cities, towns and villages in India. The network comprises of
5,442 operational beds while the capacity at the existing hospitals could be
augmented to 6,602 beds. Apart from this, NHL is also expected to commence
operations at 3 new facilities (Vaishno Devi, Mumbai and Lucknow) over the next
24 months, thereby increasing the number of beds by 864. It has a strong
presence in the southern state of Karnataka and Eastern India, as well as an
emerging presence in Western and Central India. Dr. Devi Prasad Shetty, is a
cardiac surgeon with over 30 years of medical experience.
Its centres provide advanced levels of care in over 30 specialties, including
cardiology and cardiac surgery, cancer care, neurology and neurosurgery,
orthopaedics, nephrology and urology, and gastroenterology.
As of FY2015, NHL generated 90.7% of its revenue from its 19 hospitals offering
multispecialty and super specialty services, 7.3% of its revenue from heart centers
and the balance from the management fee received from four managed hospitals,
ancillary businesses and other standalone clinics and primary care facilities.
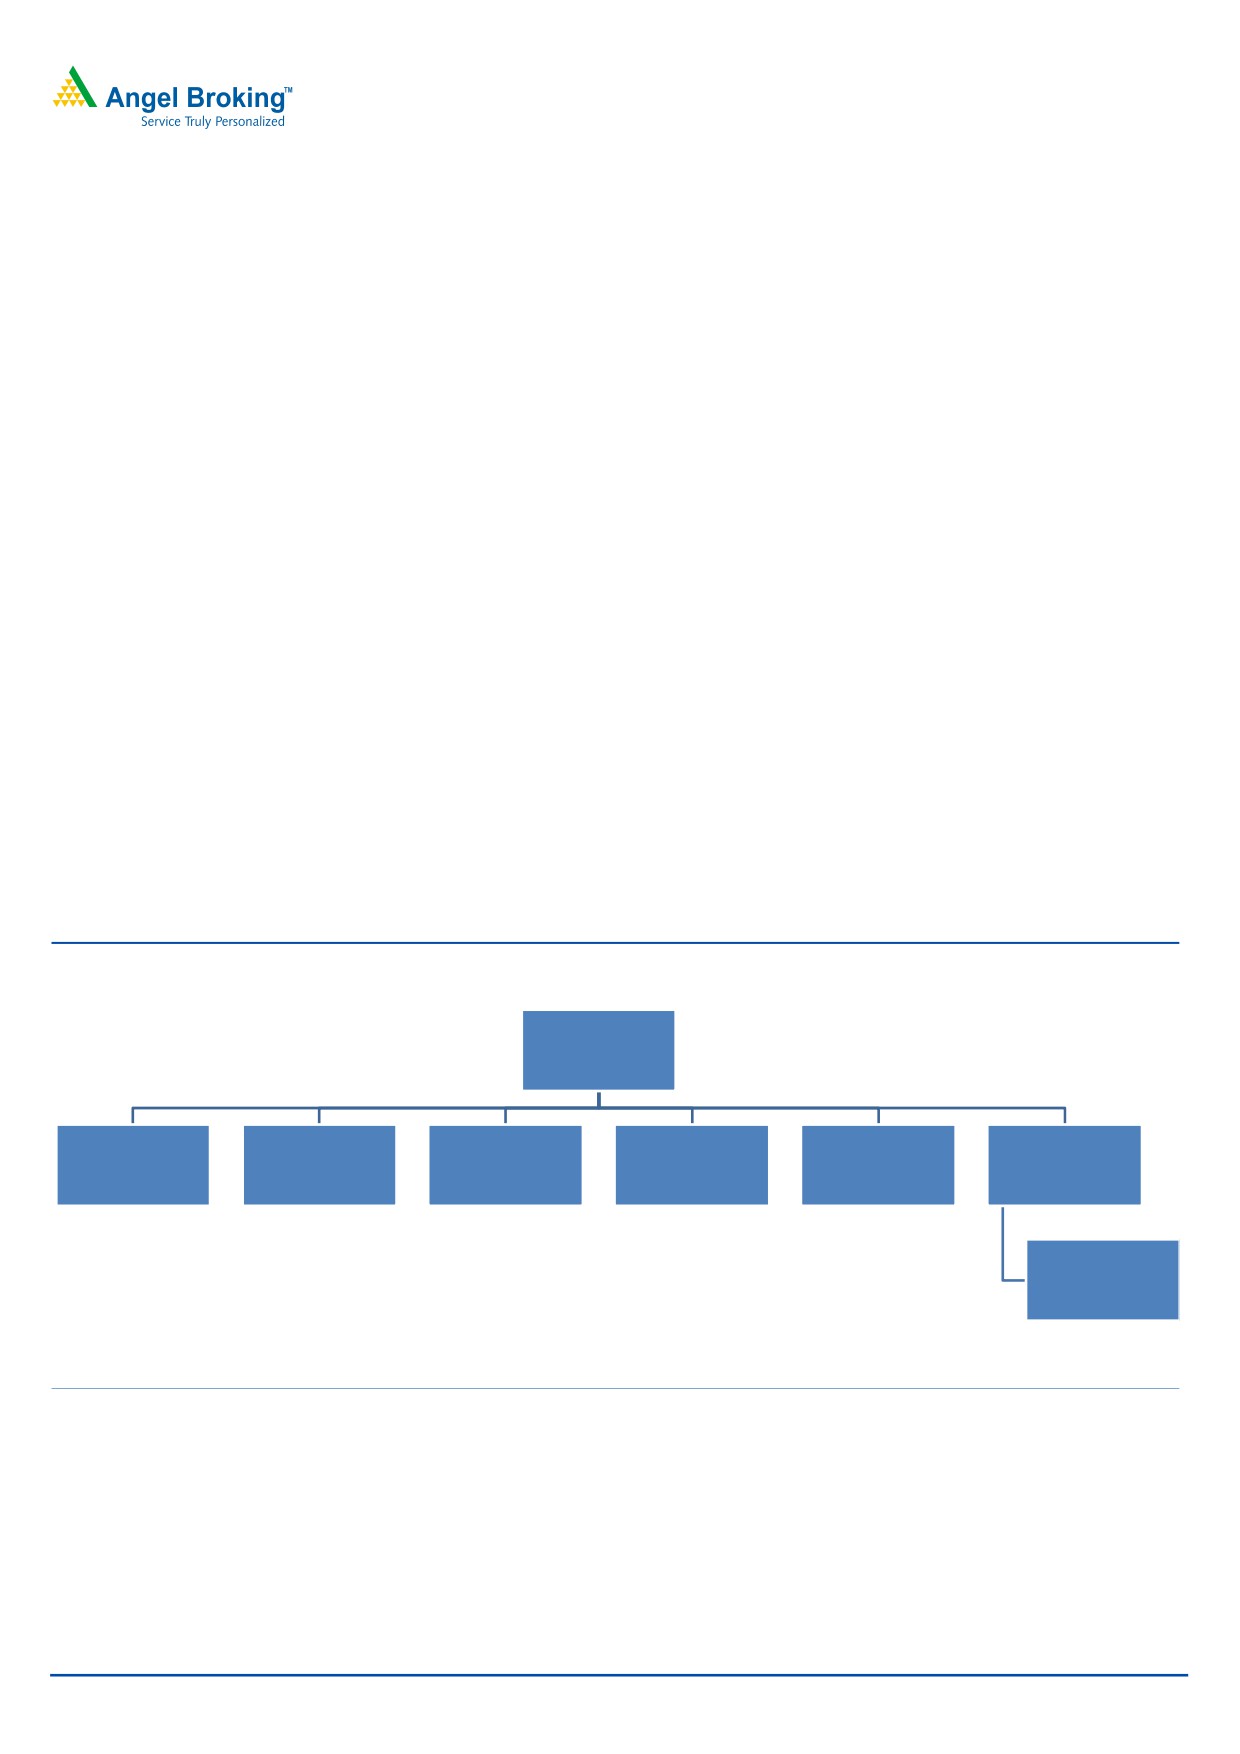
Exhibit 1: Corporate Structure
Narayana
Hrudayalaya
Narayana Hospitals
AHDL - 100% (Operates
MMRHL - 99% (Operates
- 100%
NVDSHPL - 100% (Intended
facility in Berthampore
West Bank facilities, one is
NSHSPL - 74% (Operates
Narayana Cayman Holding
(Holds land alloted in
to operate upcoming
granted on a lease basis by
freehold and the other on
facility in Mysore)
- 100% (Holding Company)
Jaipur, Ahmedabad and
hospital in Vaishno Devi)
the Murshidabad Zilla
long term lease granted by
Siliguri)
Parishad)
West Bengal Government)
HCCI - 28.6% (Operates
the facility in Grand
Cayman)
Source: RHP, Angel Research
December 16, 2015
2
Narayana Hrudayalaya | IPO Note
Issue details
The issue is an offer for sale by promoters and non-promoters of 2.45cr equity
shares aggregating to `613cr at the upper end of the price band. The issue
constitutes 12.0% of the paid-up equity share capital of the company. There is no
fresh capital being raised by the company.
Exhibit 2: Share holding pattern
Pre-Issue
Post-Issue
No. of Share (cr.)
(%)
No. of Share (cr.)
(%)
Promoters
13.1
64.0
Promoters
12.7
62.0
Dr. Devi Prasad Shetty
6.7
Dr. Devi Prasad Shetty
6.5
Shakuntala Shetty
6.4
Shakuntala Shetty
6.2
Investors
4.4
21.7
Investors
2.4
11.7
Ashoka Investment Holdings Limited
1.7
Ashoka Investment Holdings Limited
1.1
Ambadevi Mauritius Holding Limited
0.5
Ambadevi Mauritius Holding Limited
0.3
JPMorgan Mauritius
2.2
JPMorgan Mauritius
1.0
Others
2.9
14.3
Others
5.4
26.3
Total
20.4
100.0
Total
20.4
100.0
Source: Company, Angel Research
Objects of the Issue
The issue comprises of sale of shares by existing investors (10%) and promoters
(2%) and as a result, the company will not be receiving any proceeds of this offer.
However, the company will reap the benefits from being listed as it will enhance its
image. Besides, the issue will provide liquidity to the company’s existing
shareholders.
December 16, 2015
3
Narayana Hrudayalaya | IPO Note
Investment Arguments
Potential of improvement in operating margin
Currently the company is in an investment phase and over the last few years it has
increased its bed count significantly. During FY2013-15, the company has
increased its bed count from 3,834 to 5,352 (a growth of ~40%) and on the other
hand, its peer Apollo has increased its bed capacity from 6,382 to
7207
representing a growth of 13%. This led to higher revenue growth but lower
occupancy and lower profitability for NHL. At the same time, Apollo has not added
beds aggressively which has resulted into higher occupancy rate and better margin
profile in comparison to NHL.
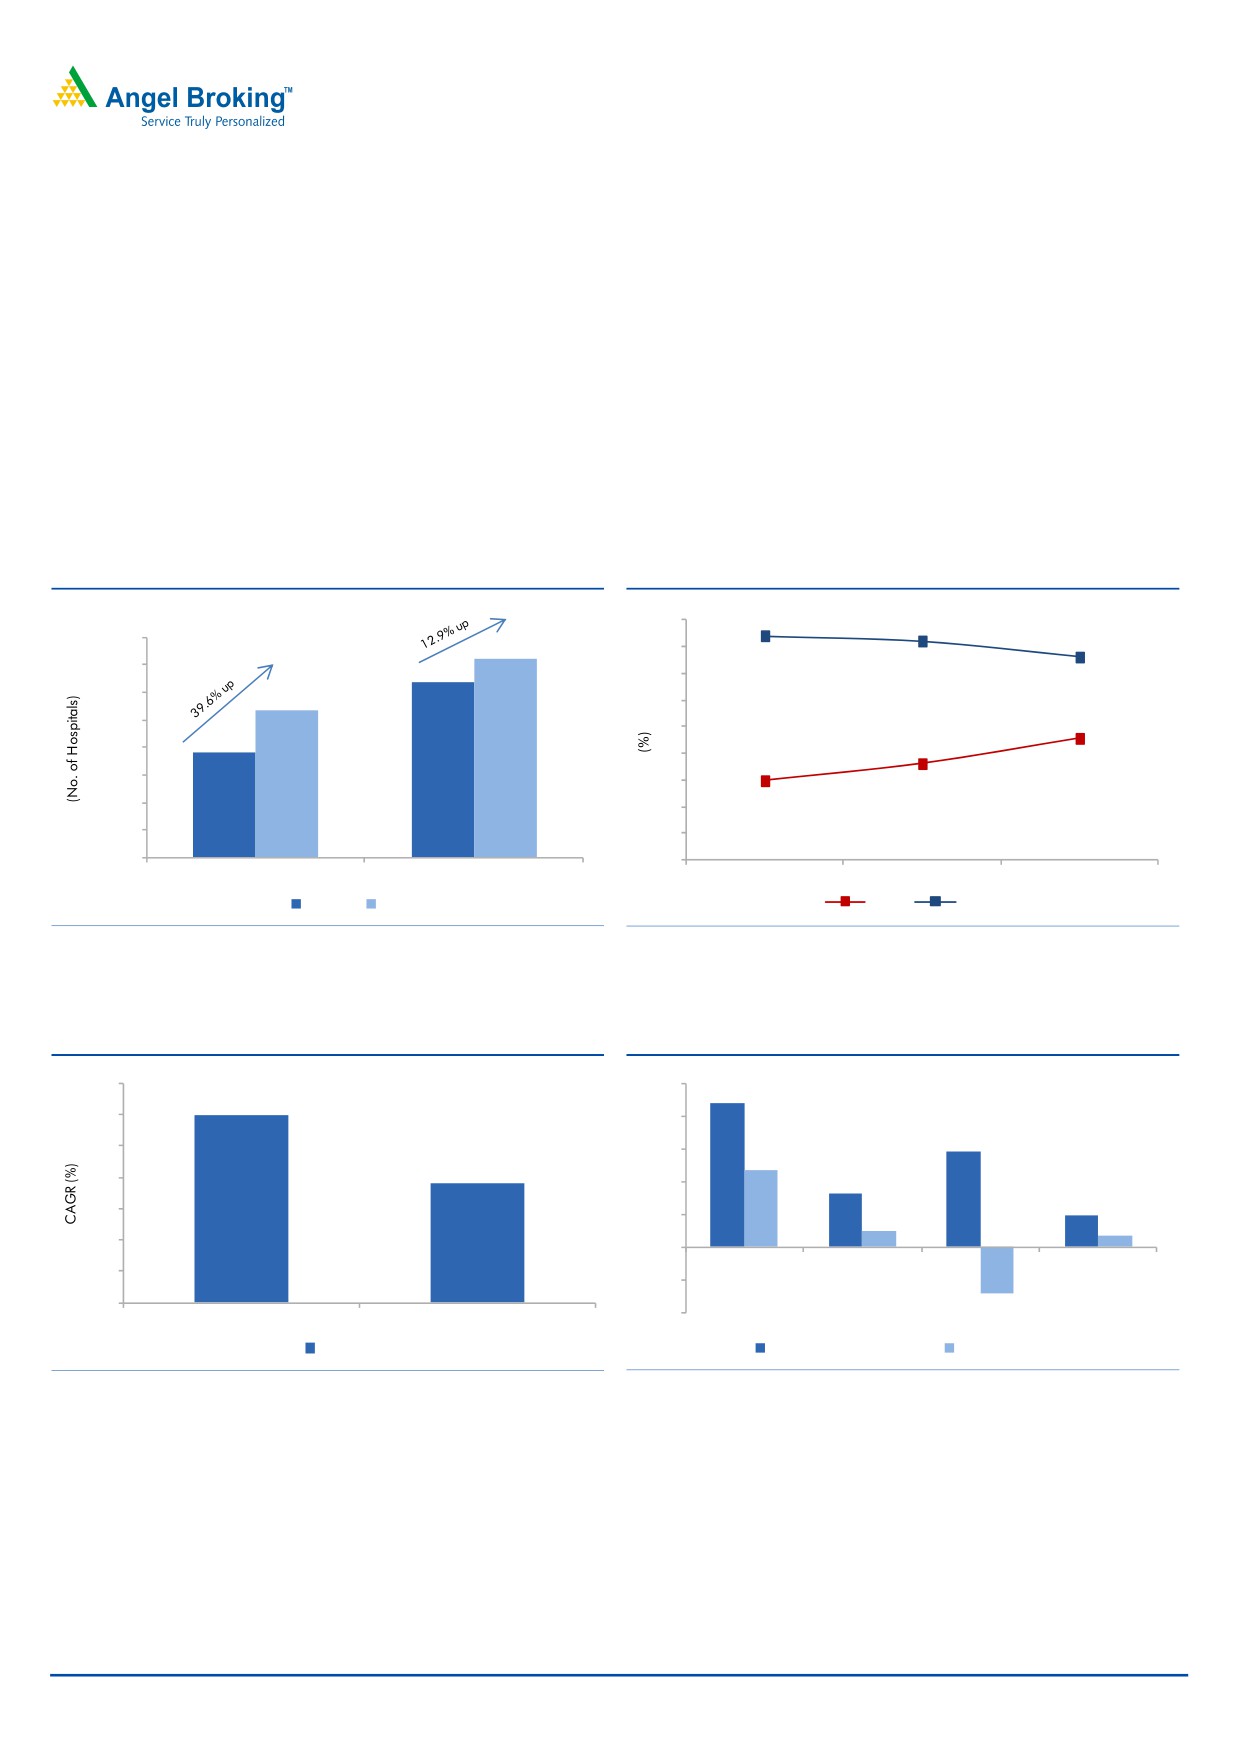
Exhibit 3: No. of bed additions during FY13-15
Exhibit 4: Occupancy rate during the same period
72.0
75
71.0
8,000
68.0
7,207
70
7,000
6,382
65
6,000
5,352
60
5,000
55
3,834
4,000
50
52.8
3,000
45
48.0
2,000
40
44.8
1,000
35
-
30
NHL
Apollo
FY2013
FY2014
FY2015
FY2013
FY2015
NHL
Apollo
Source: Company, Angel Research, Apollo PPT
Source: RHP, Angel Research
Exhibit 5: Higher bed addition resulted in stronger
Exhibit 6: Operational beds and margin profile for
top-line growth (CAGR) for NHL
NHL
35
50%
44%
30
30
40%
29%
25
30%
23.5%
19
20
17%
20%
10%
15
10%
4.8%
3.4%
10
0%
5
< 5 years old
3-5 years old
> 3 years old Acquired facilities
-10%
-
-20%
-14.4%
NHL
Apollo
FY11-15
Operational beds (%)
EBITDA margin (%)
Source: RHP, Angel Research
Source: RHP, Angel Research
Generally, hospital businesses have long gestation periods before they mature
(particularly with respect to occupancy rates) and they may operate at a loss for a
period of time before achieving profitability. As per the RHP, at end of FY2015,
NHL had 44% of its operational beds in the mature stage (at more than 5-year old
hospitals) having ~23.5% EBITDA margin and the balance at below 5-year old
hospitals were having lower profitability/loss at the EBITDA level.
Hence, going forward, the company will increase its capacity by 800-1,000 beds
over the next two years, following a relatively asset-light model, which is slower
December 16, 2015
4
Narayana Hrudayalaya | IPO Note
than the current pace. Thus, we believe that the company will gradually be able to
increase its occupancy rates with assist from its strong brand value.
Upcoming projects following the asset light model
Unlike its peers, NHL has fewer hospitals on an ownership basis. The company has
4 owned hospitals totaling to 1,613 beds which account for ~45% of revenues.
The remaining beds are on lease and operate, managed, or on a revenue sharing
model.
Exhibit 7: Various Operating Models
Model
Number of Operational Beds
Owned and Managed
1,613
Revenue Share
1,326
Lease and Operated
1,250
Managed
737
Clinics and Cayman Island
516
Total
5,442
Source: RHP, Angel Research
Currently, the company has a strong presence in Karnataka and the Eastern region
and it plans to grow its presence in other parts of the country. This bed addition
will be via the asset light route, which would include PPP or on operation and
management basis. As a result, the company will be incurring lower capex and
would thus enable it in delivering better return ratios.
Exhibit 8: Upcoming project for NHL
No of capacity
Location
Executed on the basis
Period
Types
beds to be added
Vaishno Devi
Public-private basis
Within the next 12 months
Multispeciality
241
Lucknow
Operation and Management basis
Within the next 24 months
Multispeciality
326
Mumbai
Operation and Management basis
Within the next 24 months
Multispeciality, Paediatric
297
Bhubaneshwar
Tertiary Care
Total
864
Source: RHP, Angel Research
December 16, 2015
5
Narayana Hrudayalaya | IPO Note
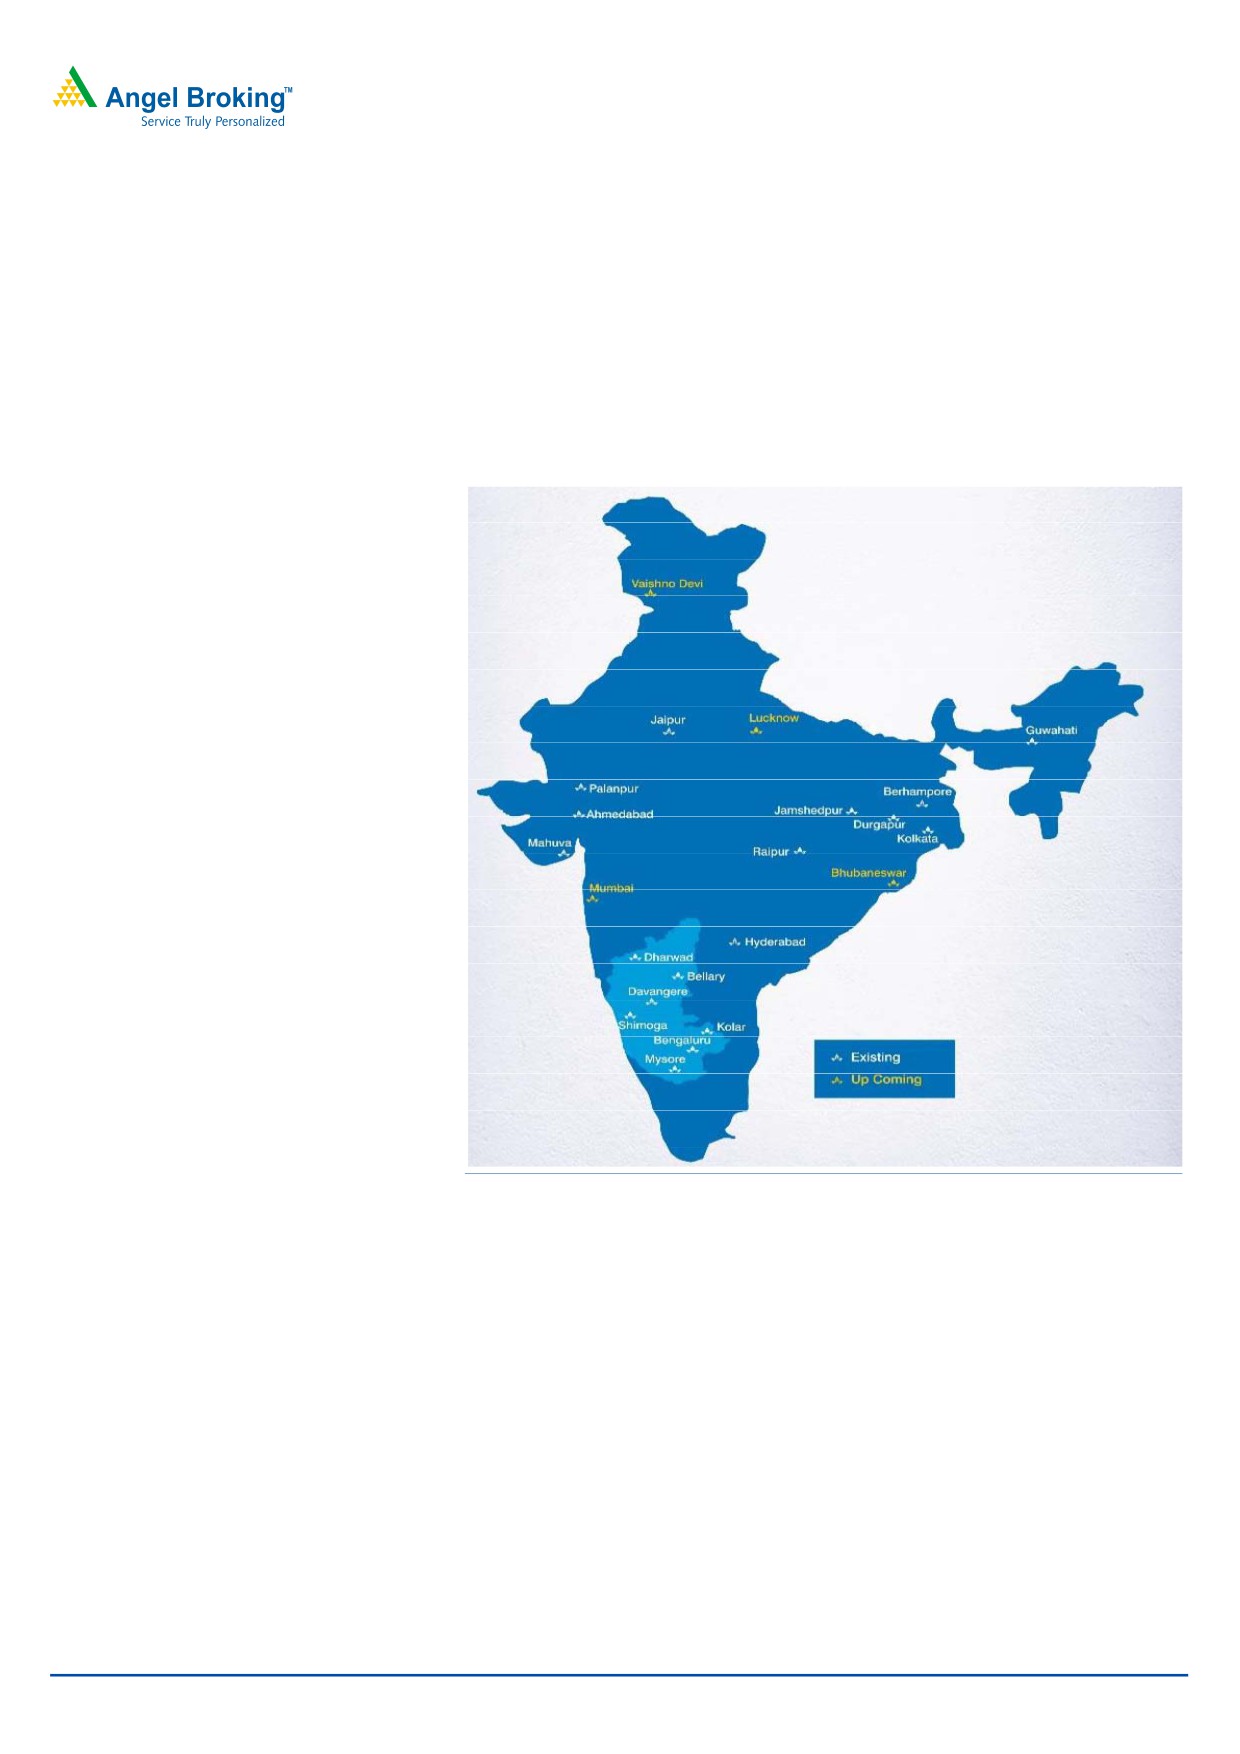
Pan India Presence
NHL is a well recognized brand with a reputation for clinical excellence and is
known for providing affordable healthcare services. It has a pan-India network
with a strong presence in Karnataka and Eastern India. Apart from this, the
company is also increasing its presence in the Western and the Central region. We
believe that the company can successfully leverage upon its brand name and
sound business model to scale up its presence in other parts of India.
Exhibit 9: Network with a strong presence in Karnataka and eastern India
Source: RHP, Angel Research
December 16, 2015
6
Narayana Hrudayalaya | IPO Note
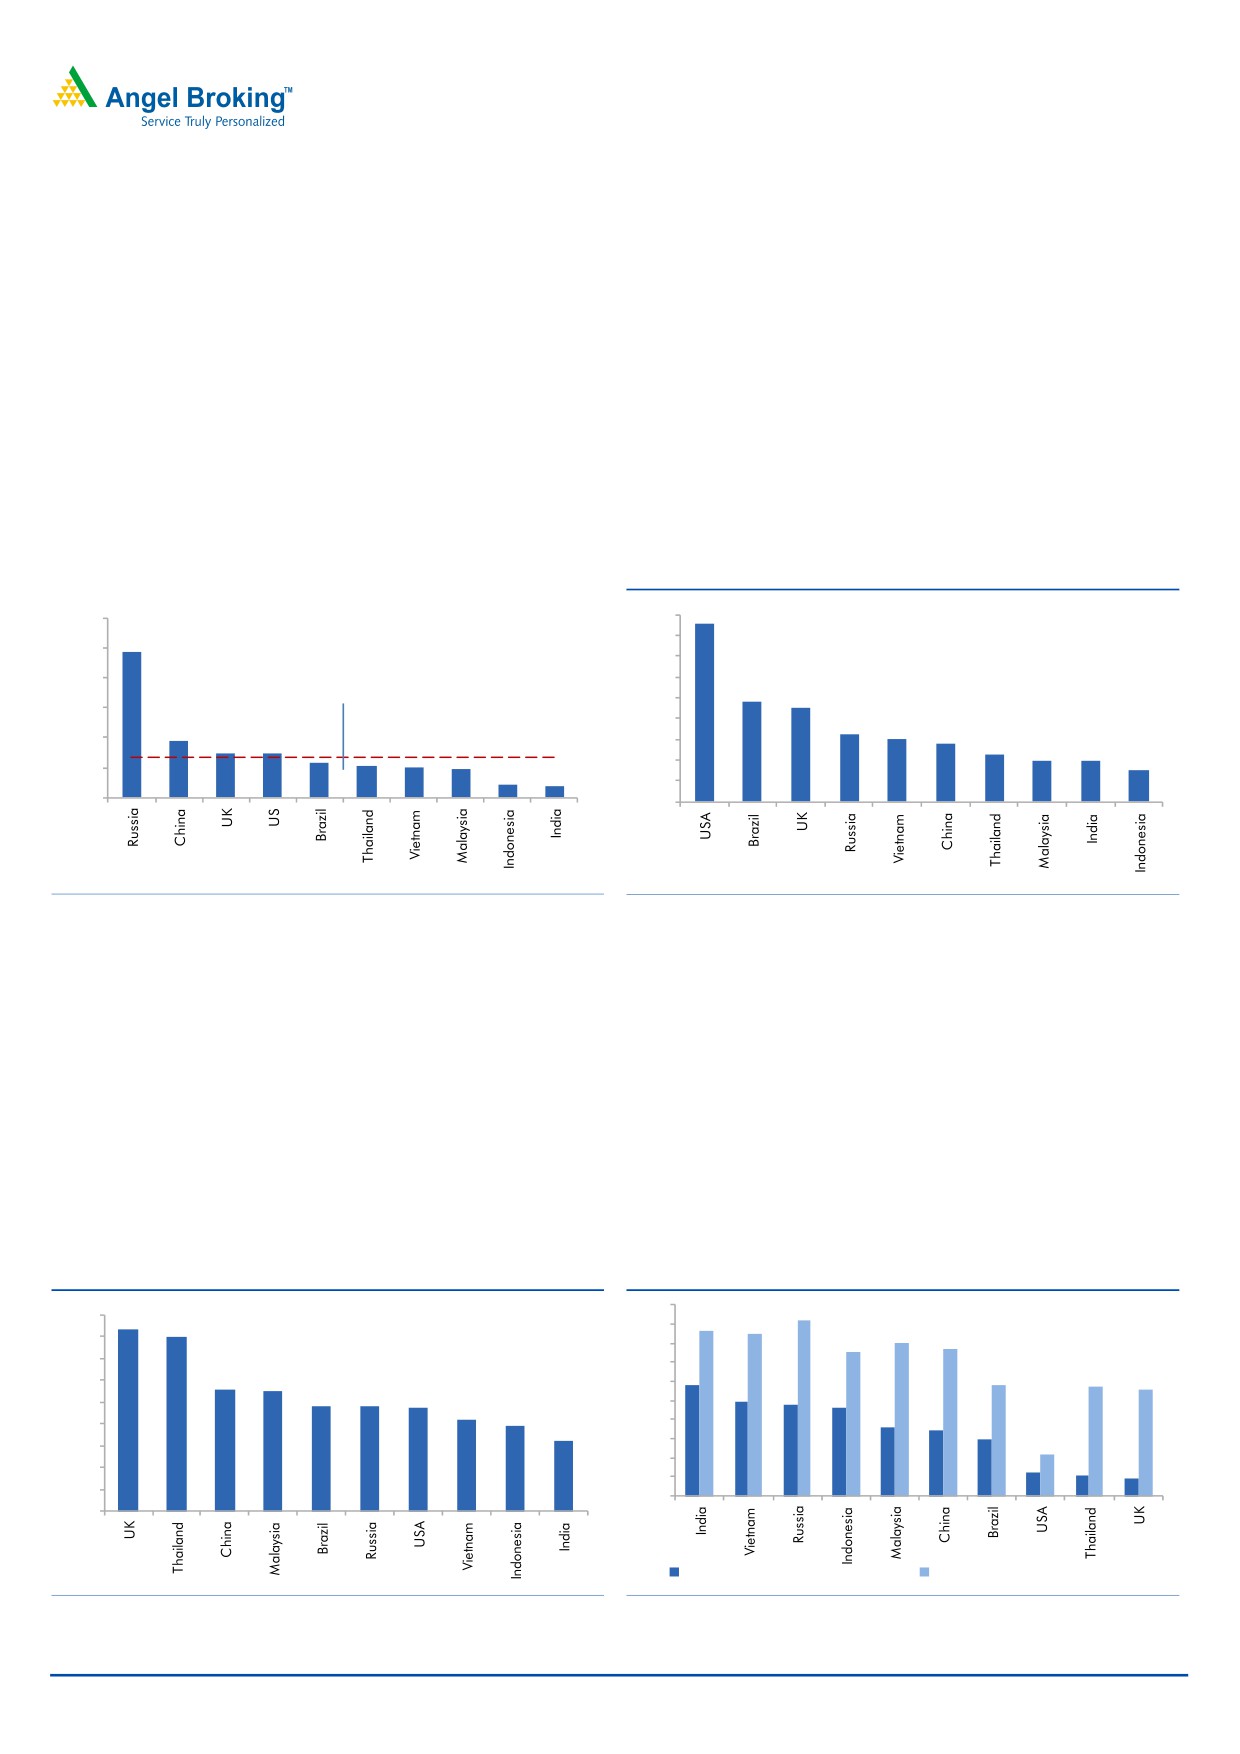
Potential to increase bed capacities; lower out-of-pocket spend to
benefit hospital industry
As per a report by Crisil, India has an overall bed density of ~7 per 10,000
population, which is significantly lower than that of other developing nations like
Brazil, Malaysia, Vietnam, and Indonesia and the global median of 27. One of the
reasons behind lower bed density in India could be lower total expenditure on
healthcare, which at 4.0% of GDP is one of the lowest among the developing and
developed nations. Of the total expenditure on healthcare in India, the
government’s contribution stands at ~32.2%, which too happens to be the lowest
among countries. Such lower spend has resulted in poor affordability of healthcare
services by a vast majority of India’s population.
Exhibit 10: Hospital bed density- India vs others (2012)
Exhibit 11: Total healthcare exp. as a % of GDP (2013)
120
18
17.1
97
16
100
14
80
12
Global median-27 Beds
9.7
10
9.1
60
38
8
6.5
6
5.6
40
29
29
6
4.6
23
21
20
19
4
4
4
3.1
20
9
7
2
0
0
Source: RHP, Angel Research
Source: RHP, Angel Research
As per the WHO, of the total healthcare expense in India, 58% is borne by
consumers directly (without insurance coverage or reimbursements). This
proportion is relatively higher at 86% in case of private healthcare services. Higher
out-of-pocket spend in terms of private healthcare services can be attributed to
lower penetration of health insurance. Growing affordability on account of higher
insurance penetration, growing overall population, improvement in income levels,
and growing working population coupled with changing lifestyles which are
leading to higher lifestyle related chronic diseases, are expected to be the key
drivers for the hospital industry in the country.
Exhibit 12: Government’s contribution on healthcare as
Exhibit 13: Proportion of out-of-pocket spending on
% of total healthcare spend
healthcare (2013)
100
92
90
83.5
86
85
80.1
90
80
80
75
77
80
70
70
58
58
57
56
60
55.8
54.8
60
49
48
48.2
48.1
46
47.1
50
50
41.9
39.0
36
34
40
40
30
32.2
30
22
30
20
12
11
20
9
10
10
0
0
OOP % of Total Healthcare Expend. OOP % of Pvt. Healthcare Expend.
Source: RHP, Angel Research
Source: RHP, Angel Research
December 16, 2015
7
Narayana Hrudayalaya | IPO Note
Outlook and Valuation
The company has registered a CAGR of 30% in revenues over FY2011-15 to
`1,364cr and its EBITDA has grown at a CAGR of 23.0% to `1,29cr over the same
period. For FY2015, the company has reported a net loss of ~`11cr on account of
loss posted in its subsidiary (HCCI Cayman island associate).
Currently, NHL’s operating margin is lower than its close peer Apollo Hospitals on
account of lower realizations (with focus on affordable healthcare) and has lower
occupancy rates. Since the hospital business has a longer gestation period, we
expect the occupancy and overall profitability to improve over a longer period of
time. On the valuation front, at the upper end of the price band, FY2016E
annualized EV/Sales multiple works out to 3.4x for NHL which is not at a
significant discount to Apollo (which trades at 3.6x). Hence we have a Neutral view
on the IPO from a short term perspective. However, investors with a longer term
investment horizon can subscribe to the issue considering that hospital businesses
take longer to perform at optimum levels.
Exhibit 14: Valuations
Sales OPM PAT EV/Operational Bed
EV/Sales
NHL
FY2016E*
1,567
11.1
25
1.0
3.4
Apollo Hospitals FY2016E*
5,945
13.8
378
2.4
3.6
Source: Company, Angel Research; Note: *Mcap based on post IPO O/s Shares at upper price
band and based on annualized numbers
Key risks/concerns
Lower capacity utilization can impact profitability: The company has laid out plans
to increase its presence in Eastern India while also growing its presence in Western
and Central Indian markets. The company expects to commence 3 hospitals in a
span of 2 years which will add 864 beds. Since hospitals take ~5 years to reach
the matured state, lower than expected utilization levels at newer hospitals can
impact profitability. Although the Vaishno Devi hospital will be EBITDA neutral, the
impact on profitability is not expected to be severe.
Retention and shortage of skilled doctors: Attrition of reputed doctors can have an
impact on the financials. Of the 2,563 doctors, 1,750 were engaged on a
consultancy basis. The company has not entered into employment contracts with
these doctors and there is no assurance that these doctors will continue to provide
their services. Failure to seek their services on a long term basis may impact the
revenue and profitability of the company.
December 16, 2015
8
Narayana Hrudayalaya | IPO Note
Consolidated Profit & Loss Statement
Y/E March (` cr)
FY2012
FY2013
FY2014
FY2015
1HFY16
Total operating income
658
839
1,095
1,364
783
% chg
37.7
27.6
30.5
24.5
Total Expenditure
576
758
975
1,235
696
Purchase of Consumables
196
233
281
341
190
Personnel Expenses
113
157
198
277
160
Others Expenses
267
369
495
617
346
EBITDA
82
81
120
129
87
% chg
47.7
(1.2)
47.8
7.6
(32.5)
(% of Net Sales)
12.5
9.7
11.0
9.5
11.1
Depreciation& Amortisation
37
46
57
67
35
EBIT
45
35
63
63
52
% chg
91.2
(21.6)
77.7
(0.2)
(% of Net Sales)
6.8
4.2
5.7
4.6
6.6
Interest & other Charges
9
17
28
41
17
Other Income
3
15
22
8
5
(% of PBT)
7.5
44.8
39.5
26.4
13.0
Recurring PBT
39
34
57
29
40
% chg
85.6
(12.6)
67.7
(48.2)
36.5
Extraordinary Items
-
-
-
-
-
PBT (reported)
39
34
57
29
40
Tax
13
10
21
18
15
(% of PBT)
33.5
29.5
37.7
59.7
37.1
PAT (reported)
26
24
35
12
25
Minority Interest
0
1
2
2
0
Share in profit of Associates
-
0
(6)
(25)
(13)
PAT after MI (reported)
26
25
32
(11)
12
Extraordinary Items
-
-
-
-
-
ADJ. PAT
26
25
32
(11)
12
% chg
88.8
(3.7)
27.9
-
(% of Net Sales)
3.9
3.0
2.9
(0.8)
1.6
Basic EPS (`)
1.3
1.2
1.6
(0.5)
0.6
Fully Diluted EPS (`)
1.3
1.2
1.6
(0.5)
0.6
% chg
88.8
(3.7)
27.9
-
December 16, 2015
9
Narayana Hrudayalaya | IPO Note
Consolidated Balance Sheet
Y/E March (` cr)
FY2012
FY2013
FY2014
FY2015
1HFY16
SOURCES OF FUNDS
Equity Share Capital
0
0
0
200
200
Reserves& Surplus
515
547
580
565
581
Shareholders Funds
515
547
580
765
781
Minority Interest
2
5
3
1
0
Total Loans
116
219
279
305
201
Deferred Tax Liability
18
19
25
29
26
Other LT Liabilities
1
2
2
5
2
Long-term provisions
5
6
6
11
10
Total Liabilities
657
797
896
1,115
1,021
APPLICATION OF FUNDS
Gross Block
616
791
962
1,156
1,213
Less: Acc. Depreciation
125
171
225
312
346
Net Block
491
620
737
843
867
Capital Work-in-Progress
87
44
20
20
15
Goodwill
-
-
1
59
59
Investments
-
7
51
52
70
Current Assets
129
176
239
261
298
Inventories
28
38
49
51
54
Sundry Debtors
67
91
134
143
157
Cash
19
25
28
30
44
Loans & Advances
10
13
14
26
31
Other Assets
4
7
13
11
13
Current liabilities
126
166
260
245
411
Net Current Assets
3
10
(21)
16
(113)
LT loans and advances
76
114
106
123
121
Other non-current assets
-
1
1
1
2
Deferred Tax Asset
-
-
-
-
-
Mis. Exp. not written off
-
-
-
-
-
Total Assets
657
797
896
1,115
1,021
December 16, 2015
10
Narayana Hrudayalaya | IPO Note
Consolidated Cash flow statement
Y/E March (` cr)
FY2012
FY2013
FY2014
FY2015
1HFY16
Profit before tax
39
34
57
29
40
Depreciation
37
46
57
67
35
Change in Working Capital
(19)
(22)
7
(39)
47
Interest / Dividend (Net)
9
16
28
40
16
Direct taxes paid
(13)
(17)
(20)
(22)
(16)
Others
0
(12)
(19)
2
1
Cash Flow from Operations
53
45
110
77
125
(Inc.)/ Dec. in Fixed Assets
(121)
(140)
(124)
(221)
(65)
(Inc.)/ Dec. in Investments
(30)
(7)
(45)
(1)
(18)
Cash Flow from Investing
(91)
(147)
(168)
(222)
(83)
Issue of Equity
10
10
-
194
-
Inc./(Dec.) in loans
37
-
-
-
-
Dividend Paid (Incl. Tax)
-
-
-
-
-
Interest / Dividend (Net)
(12)
108
61
146
(28)
Cash Flow from Financing
35
108
61
146
(28)
Inc./(Dec.) in Cash
(3)
6
3
1
14
Opening Cash balances
22
19
25
28
30
Closing Cash balances
19
25
28
30
44
December 16, 2015
11
Narayana Hrudayalaya | IPO Note
Key Ratios
Y/E March
FY2012
FY2013
FY2014
FY2015
Valuation Ratio (x)
P/E (on FDEPS)
198.4
206.0
161.1
-
P/CEPS
81.2
73.2
55.1
65.1
P/BV
9.9
9.3
8.8
6.7
Dividend yield (%)
0.0
0.0
0.0
0.0
EV/Sales
7.9
6.3
4.8
3.9
EV/EBITDA
63.3
65.2
44.2
41.3
EV / Total Assets
6.6
5.5
4.6
3.9
Per Share Data (`)
EPS (Basic)
1.3
1.2
1.6
(0.5)
EPS (fully diluted)
1.3
1.2
1.6
(0.5)
Cash EPS
3.1
3.4
4.5
3.8
DPS
0.0
0.0
0.0
0.0
Book Value
25.2
26.8
28.4
37.4
Returns (%)
ROCE
7.1
4.6
7.3
5.8
Angel ROIC (Pre-tax)
7.3
4.8
8.0
6.3
ROE
5.0
4.5
5.5
(1.4)
Turnover ratios (x)
Asset Turnover (Gross Block)
1.1
1.2
1.2
1.3
Inventory / Sales (days)
16
17
16
14
Receivables (days)
37
40
45
38
Payables (days)
39
34
51
37
Working capital cycle (ex-cash) (days)
14
23
10
15
December 16, 2015
12
Narayana Hrudayalaya | IPO Note
Research Team Tel: 022 - 39357800
DISCLAIMER
Angel Broking Private Limited (hereinafter referred to as “Angel”) is a registered Member of National Stock Exchange of India Limited,
Bombay Stock Exchange Limited and Metropolitan Stock Exchange of India Limited. It is also registered as a Depository Participant with
CDSL and Portfolio Manager with SEBI. It also has registration with AMFI as a Mutual Fund Distributor. Angel Broking Private Limited is
a registered entity with SEBI for Research Analyst in terms of SEBI (Research Analyst) Regulations, 2014 vide registration number
INH000000164. Angel or its associates has not been debarred/ suspended by SEBI or any other regulatory authority for accessing
/dealing in securities Market. Angel or its associates including its relatives/analyst do not hold any financial interest/beneficial
ownership of more than 1% in the company covered by Analyst. Angel or its associates/analyst has not received any compensation /
managed or co-managed public offering of securities of the company covered by Analyst during the past twelve months. Angel/analyst
has not served as an officer, director or employee of company covered by Analyst and has not been engaged in market making activity
of the company covered by Analyst.
This document is solely for the personal information of the recipient, and must not be singularly used as the basis of any investment
decision. Nothing in this document should be construed as investment or financial advice. Each recipient of this document should
make such investigations as they deem necessary to arrive at an independent evaluation of an investment in the securities of the
companies referred to in this document (including the merits and risks involved), and should consult their own advisors to determine
the merits and risks of such an investment.
Reports based on technical and derivative analysis center on studying charts of a stock's price movement, outstanding positions and
trading volume, as opposed to focusing on a company's fundamentals and, as such, may not match with a report on a company's
fundamentals.
The information in this document has been printed on the basis of publicly available information, internal data and other reliable
sources believed to be true, but we do not represent that it is accurate or complete and it should not be relied on as such, as this
document is for general guidance only. Angel Broking Pvt. Limited or any of its affiliates/ group companies shall not be in any way
responsible for any loss or damage that may arise to any person from any inadvertent error in the information contained in this report.
Angel Broking Pvt. Limited has not independently verified all the information contained within this document. Accordingly, we cannot
testify, nor make any representation or warranty, express or implied, to the accuracy, contents or data contained within this document.
While Angel Broking Pvt. Limited endeavors to update on a reasonable basis the information discussed in this material, there may be
regulatory, compliance, or other reasons that prevent us from doing so.
This document is being supplied to you solely for your information, and its contents, information or data may not be reproduced,
redistributed or passed on, directly or indirectly.
Neither Angel Broking Pvt. Limited, nor its directors, employees or affiliates shall be liable for any loss or damage that may arise from
or in connection with the use of this information.
Note: Please refer to the important ‘Stock Holding Disclosure' report on the Angel website (Research Section). Also, please refer to the
latest update on respective stocks for the disclosure status in respect of those stocks. Angel Broking Pvt. Limited and its affiliates may
have investment positions in the stocks recommended in this report.
December 16, 2015
13