2QFY2016 Result Update | Infrastructure
November 13, 2015
NCC
NEUTRAL
CMP
`77
Performance Highlights
Target Price
-
Quarterly Highlights - Standalone
Investment Period
-
Y/E March (` cr)
2QFY16 2QFY15 1QFY16
% chg (yoy)
% chg (qoq)
Net sales
2,096
2,246
1,723
(6.6)
(21.7)
Stock Info
EBITDA
184
181
158
1.6
(16.4)
Net profit
55
22
41
148.4
(33.4)
Sector
Infrastructure
Source: Company, Angel Research;
Market Cap (` cr)
4,303
Net Debt (` cr)
1,813
For 2QFY2016, NCC reported a favorable standalone earnings performance,
Beta
1.7
reflecting better than expected execution, and lower yoy interest expenses owing to
decline in debt.
52 Week High / Low
118/53
Avg. Daily Volume
730,596
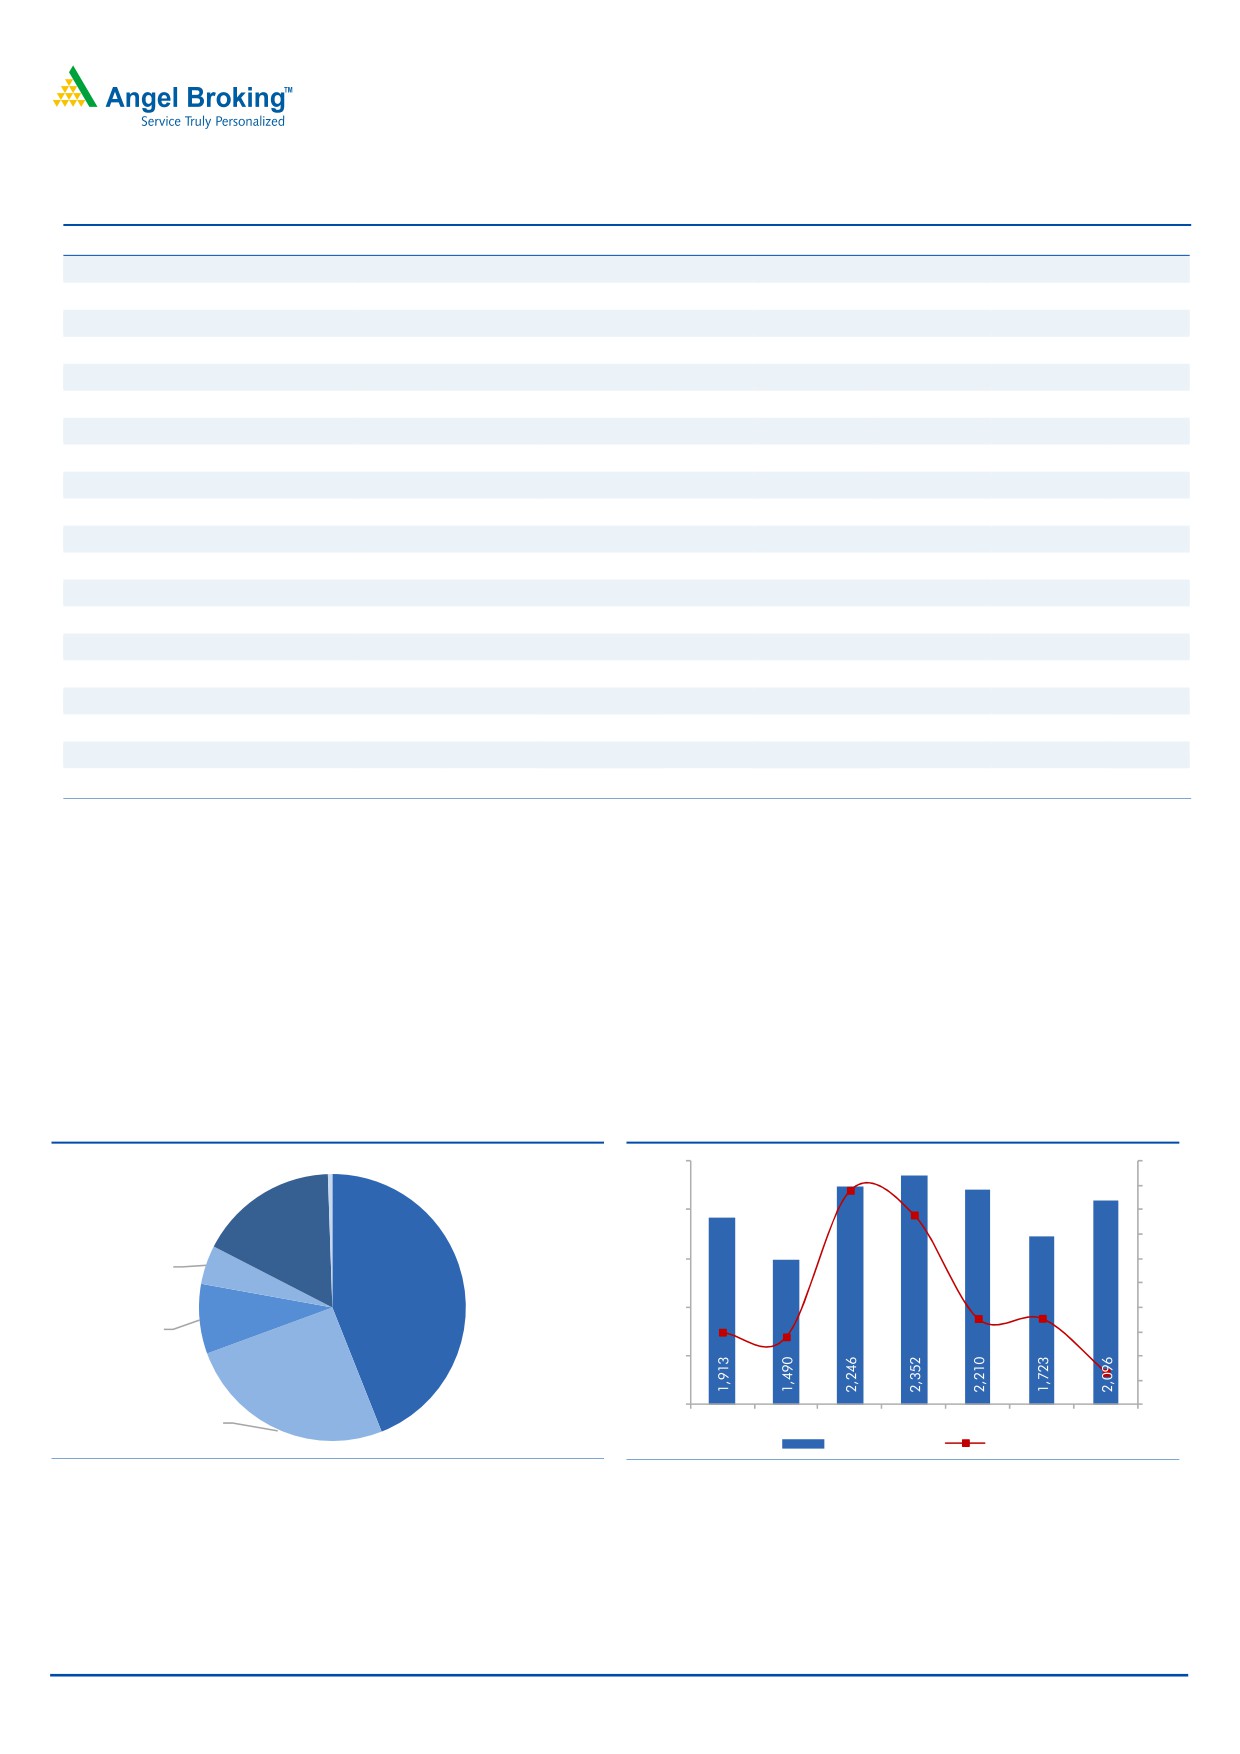
On the top-line front, NCC (standalone) reported a 6.6% yoy decline to `2,096cr.
Face Value (`)
2
On a sequential basis, the top-line grew 21.7%. Stronger execution seen across
BSE Sensex
25,867
Water, Environment & Railways (WER) and the Buildings and Roads (B&R)
Nifty
7,825
segment, and sale of a land parcel (worth `29.9cr), contributed to the better-than-
expected 2QFY2016 revenues.
Reuters Code
NGCN.BO
Bloomberg Code
NJCC@IN
NCC reported a 72bp yoy EBITDA margin improvement to 8.8%, owing to 21.3%
yoy decline in raw material expenses and real estate transaction. Expansion in
EBITDA margin on yoy basis coupled with lower yoy interest expenses led to PAT
Shareholding Pattern (%)
coming in at `55cr for the quarter as against `22cr in 2QFY2015.
Promoters
20.5
NCC’s outstanding order book as of 2QFY2016 stands at `17,487cr (exc.
MF / Banks / Indian Fls
14.5
international business, order book to LTM sales ratio stands at 1.8x), indicating a
FII / NRIs / OCBs
26.6
14.3% yoy decline.
Indian Public / Others
38.4
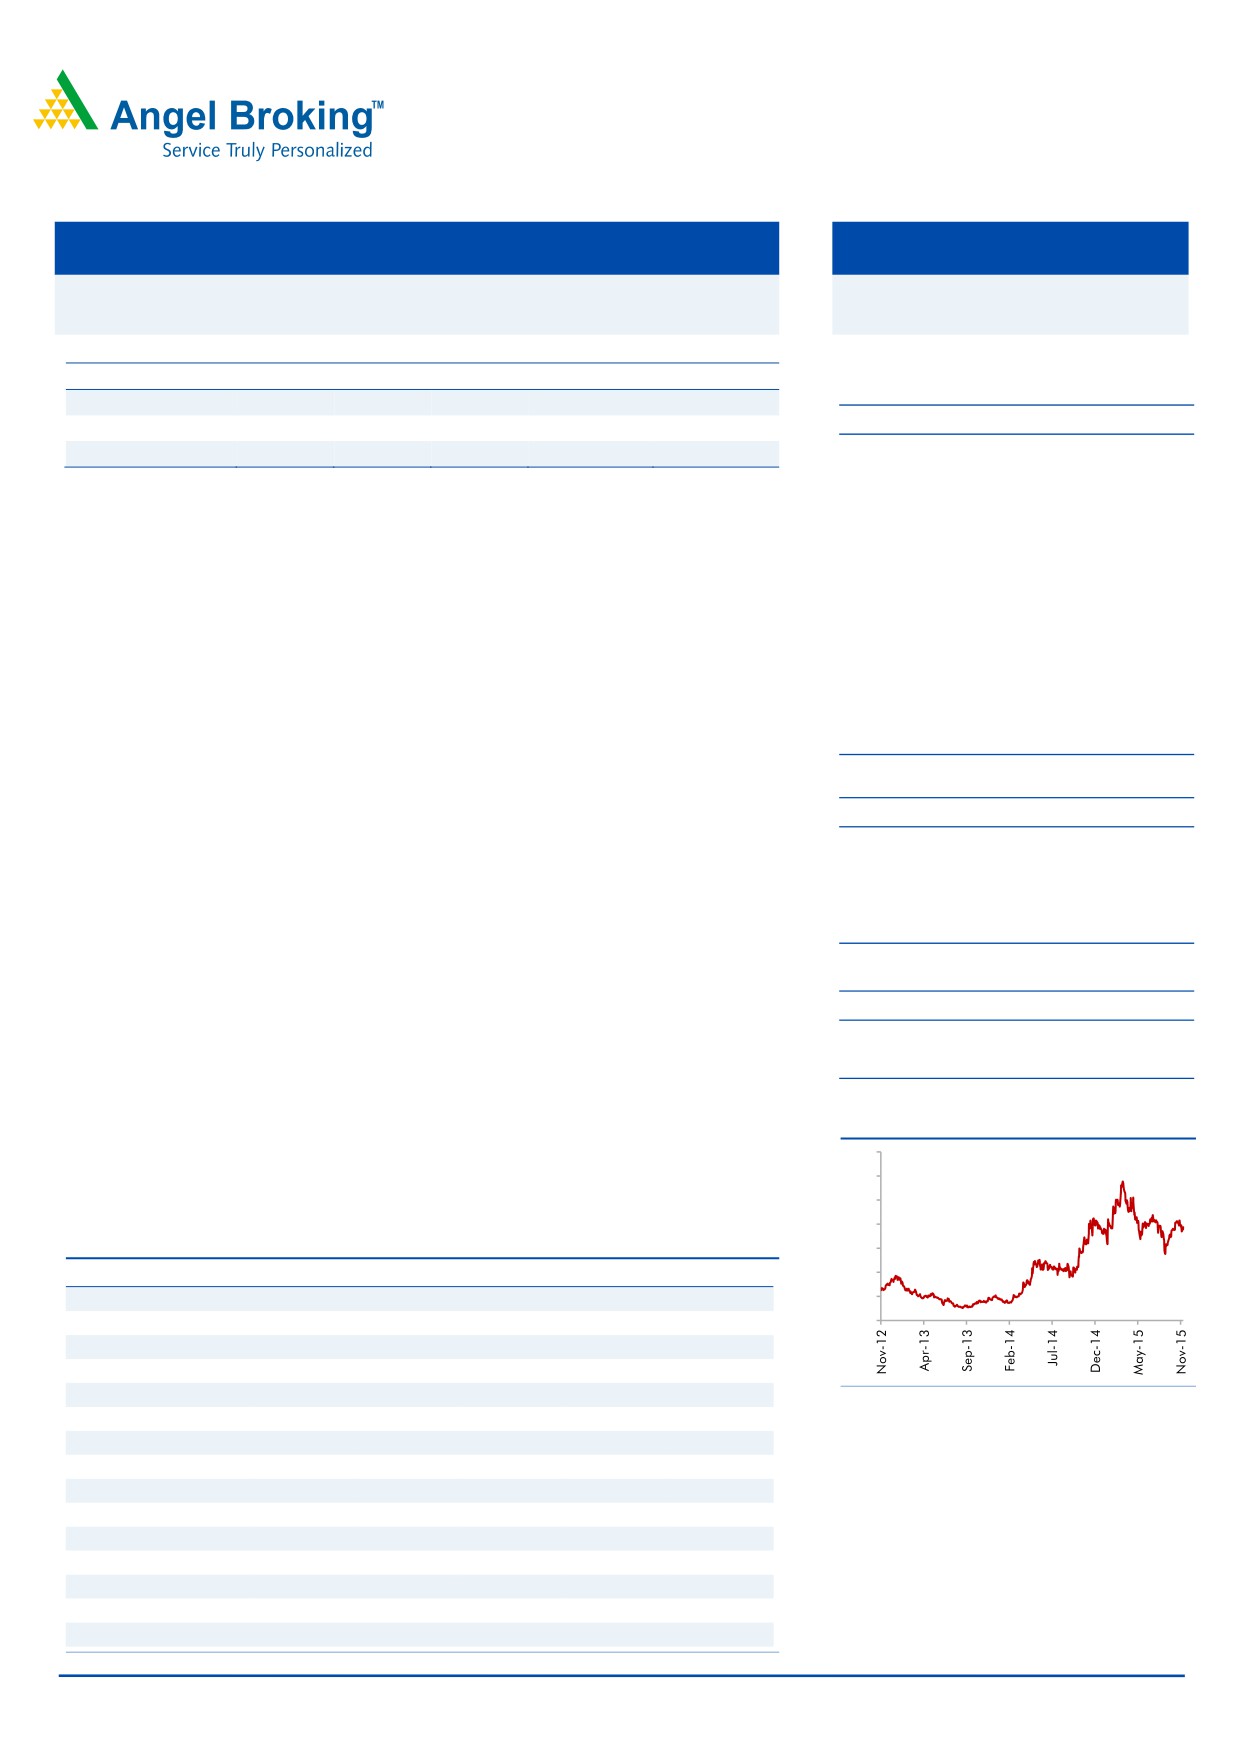
Outlook and valuation: NCC’s stock price has run-up by 36.9% in the last
12 months, mainly owing to the balance sheet de-leveraging exercise pursued by
Abs. (%)
3m 1yr
3yr
the company. NCC aims to repay debt by around `200-300cr through proceeds
Sensex
(6.0)
(7.6)
38.5
of stake sale. However stretched working capital cycle will likely inhibit the
NCC
6.3
36.9
208.6
company from cutting down its debt in FY2016E. We are of the view that the next
leg of re-rating in the stock would come from improvement in the EBITDA margin,
and further compression in working capital cycle. Since we estimate this to happen
3-year price chart
in FY2017E only, we assign a 14.0x P/E multiple to the standalone EPC business,
140
120
which in-turn has restricted the target price at `90/share. Given that all positives
100
are captured in the current market price, we assign a Neutral rating on the stock.
80
Key financials (Standalone)
60
Y/E March (` cr)
FY13
FY14
FY15
FY16E
FY17E
40
Net Sales
5,725
6,117
8,297
7,892
8,842
20
0
% chg
9.0
6.9
35.6
(4.9)
12.0
Net Profit
63
41
112
165
297
% chg
74.2
(35.3)
175.9
47.5
79.9
EBITDA (%)
8.2
6.6
7.8
8.8
9.1
Source: Company, Angel Research
EPS (`)
2.4
1.6
2.0
3.0
5.3
P/E (x)
31.7
49.0
38.5
26.1
14.5
P/BV (x)
0.8
0.8
1.3
1.3
1.2
RoE (%)
2.6
1.6
3.9
5.0
8.5
RoCE (%)
8.4
6.7
10.8
11.0
12.7
EV/Sales (x)
0.7
0.7
0.7
0.8
0.7
EV/EBITDA (x)
8.4
10.4
9.4
8.9
7.2
OB/ LTM Sales (x)
3.3
3.4
2.3
2.4
2.1
Santosh Yellapu
Order Inflows
4,017
8,512
6,659
7,900
9,600
022-39357800 Ext: 6811
% chg
(56.6)
111.9
(21.8)
18.6
21.5
Source: Company, Angel Research; Note: CMP as of November 11, 2015
Please refer to important disclosures at the end of this report
1
NCC | 2QFY2016 Result Update
Exhibit 1: Quarterly performance (Standalone)
Particulars (` cr)
2QFY16
1QFY16
% chg (qoq) 2QFY15
% chg (yoy) 1HFY2016
1HFY2015
% chg
Net Sales
2,096
1,723
21.7
2,246
(6.6)
3,819
3,735
2.2
Total Expenditure
1,912
1,564
22.2
2,064
(7.4)
3,476
3,445
0.9
Cost of materials consumed
1,074
758
41.7
1,365
(21.3)
1,833
2,000
(8.4)
Construction & Sub-Contracting exp.
703
690
1.8
585
20.2
1,393
1,216
14.5
Employee benefits Expense
77
69
11.6
66
16.2
146
127
15.1
Other Expenses
58
46
25.0
48
20.4
104
102
2.7
EBITDA
184
158
16.4
181
1.6
343
290
18.0
EBIDTA %
8.8
9.2
8.1
9.0
7.8
Depreciation
28
27
3.2
28
(0.8)
55
57
(2.7)
EBIT
156
131
19.1
153
2.1
288
234
23.1
Interest and Financial Charges
131
126
3.7
158
(17.1)
257
296
(13.0)
Other Income
52
52
(0.9)
39
33.3
104
84
22.8
PBT before Exceptional Items
77
57
34.9
34
127.6
134
22
500.0
Exceptional Items
0
0
0
0
0
PBT
77
57
34.9
34
127.6
134
22
500.0
Tax
22
16
39.0
12
38
3
% of PBT
28.6
27.7
34.5
28.2
14.5
PAT
55
41
33.4
22
148.4
96
19
403.7
PAT %
2.6
2.4
1.0
2.5
0.5
Dil. EPS
0.99
0.74
33.8
0.86
15.1
1.73
0.74
133.8
Note: nmf- not meaningful; Source: Company, Angel Research
Revenues de-grew 6.6% yoy
For 2QFY2016, NCC reported a 6.6% yoy decline in its revenues to `2,096cr.
However, the reported revenues were ahead of our estimate of `1,979cr. Reported
revenues for the quarter include, (1) `312cr of in-house power project execution
(v/s `389cr in 1QFY2016 and `288cr in 2QFY2015), and (2) `29.9cr from sale of
a land parcel. On adjusting for real estate transaction, adj. revenues in 2QFY2016
de-grew 8.0% yoy.
Exhibit 2: BR segment leads quarterly revenues...
Exhibit 3: Revenues de-grow 6.6% yoy...
Mining, 1%
2,500
80
70
68
2,000
60
58
Power, 23%
50
Irrigation,
5%
1,500
40
Building &
30
Roads, 44%
1,000
20
Electrical,,
10
16
16
10
7%
8
500
0
(7)
(10)
Water,
0
(20)
Environment &
4QFY14
1QFY15
2QFY15
3QFY15
4QFY15
1QFY16
2QFY16
Railways, 25%
Revenues (` cr)
y/y change (%)
Source: Company, Angel Research
Source: Company, Angel Research
In 2QFY2016, the Buildings and Roads (B&R) and Water, Environment, & Railways
(WER) segment, accounted for 44% and 25% of standalone revenues booked,
respectively.
November 13, 2015
2
NCC | 2QFY2016 Result Update
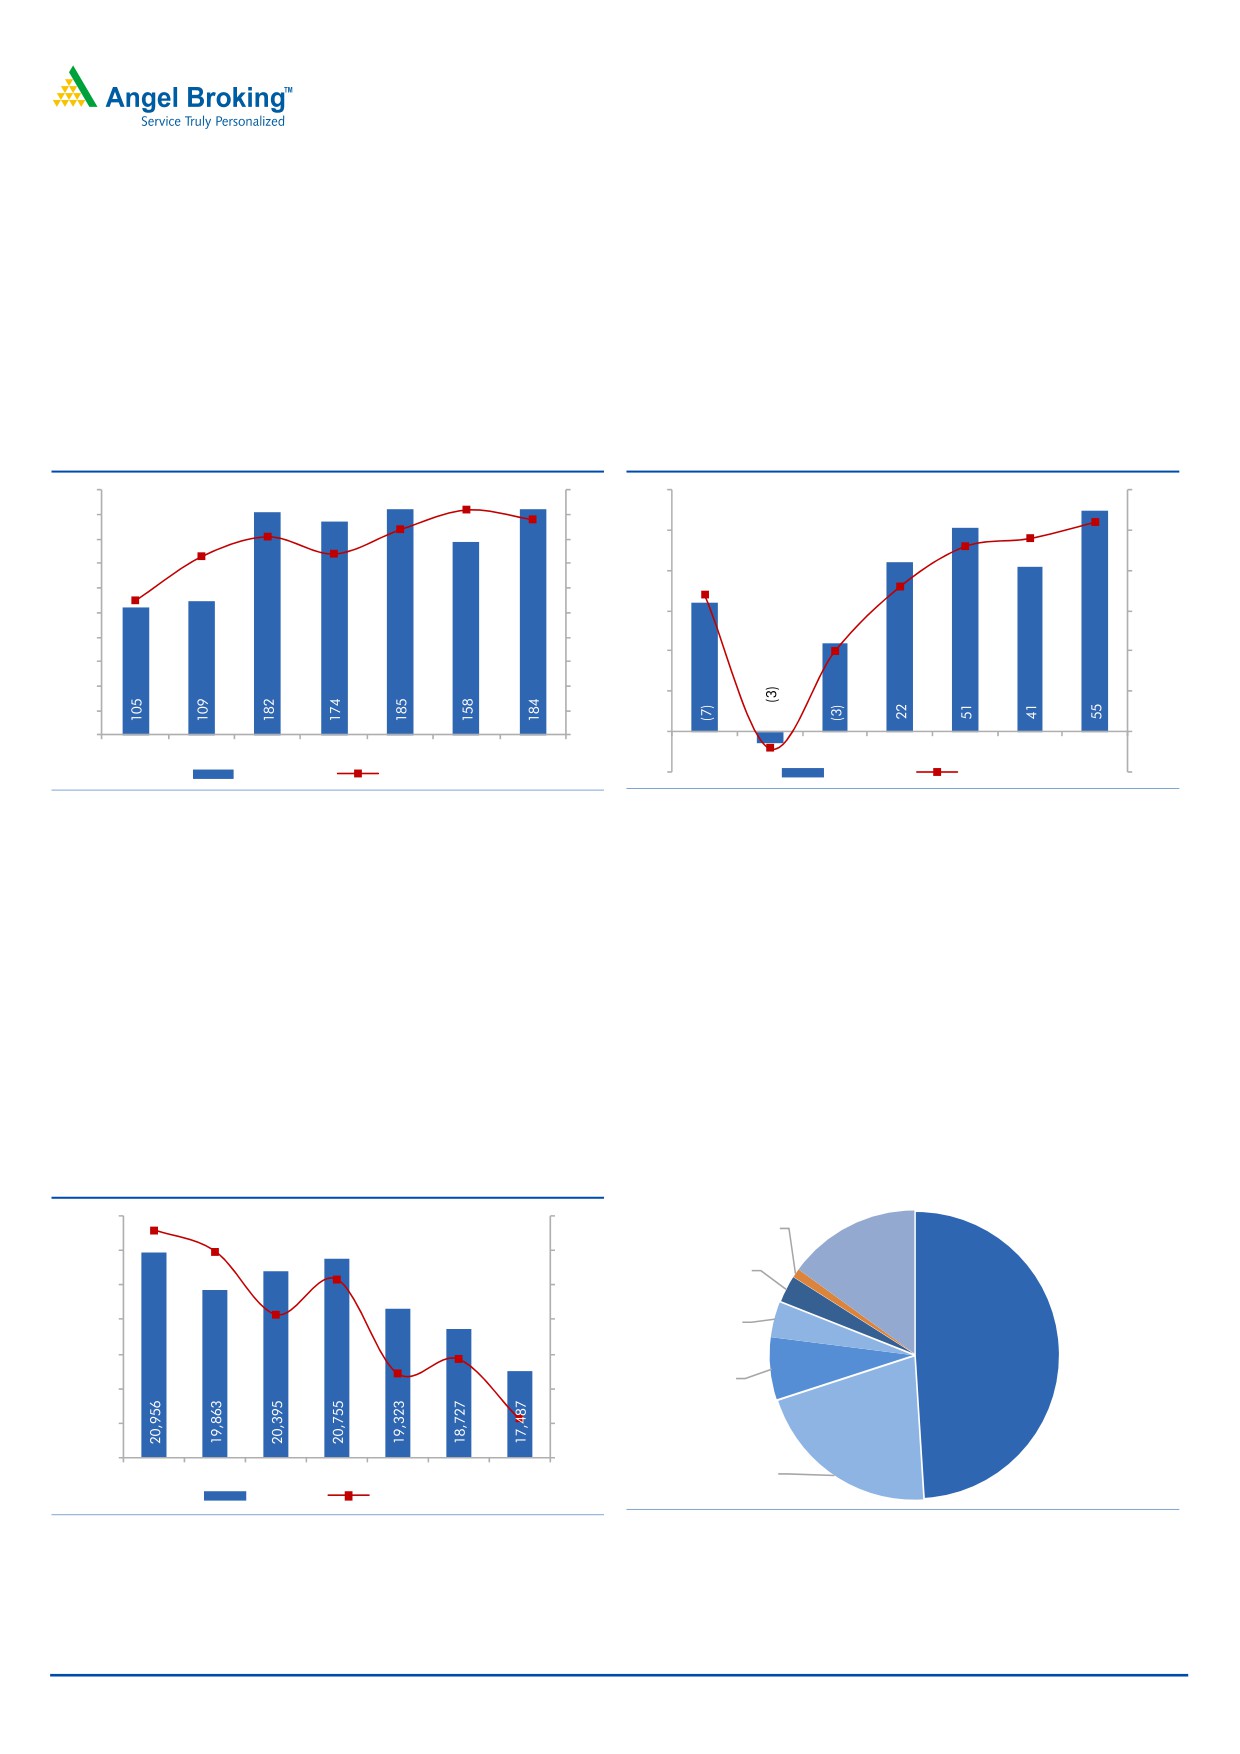
EBITDA margins expand on yoy basis
NCC reported an EBITDA of `184cr for the quarter, up 1.6% yoy. For the quarter
NCC reported EBITDA margin of 8.8%, against our expectation of 8.5% and year
ago levels of 8.1%. Surge in the yoy EBITDA margins is on account of (1) profit of
`29.9cr from a real estate transaction, and (2) 21.3% decrease in construction and
sub-contracting expenses. On adjusting for the real estate transaction (reported
under revenues), EBITDA margins would stand at 7.5%.
Exhibit 4: EBITDA margin at 8.8%
Exhibit 5: PAT margin aided by lower interest exp.
200
8.4
9.2
10
60
3.0
8.8
8.1
7.4
2.6
180
9
2.4
7.3
50
2.5
160
8
2.3
140
7
40
2.0
5.5
120
6
1.8
1.7
100
5
30
1.5
80
4
20
1.0
1.0
60
3
40
2
10
0.5
20
1
(0.2)
0
0
0
0.0
4QFY14
1QFY15
2QFY15
3QFY15
4QFY15
1QFY16
2QFY16
4QFY14
1QFY15
2QFY15
3QFY15
4QFY15
1QFY16
2QFY16
EBITDA (` cr)
EBITDA Margins (%)
(10)
PAT (` cr)
PAT Margins (%)
(0.5)
Source: Company, Angel Research
Source: Company, Angel Research
NCC reported a PAT of `55cr in 2QFY2016, ahead of our estimates of `44cr.
EBITDA margin expansion and decline in interest expenses led to a sharp PAT
margin expansion, from 1.0% in 2QFY2015 to 2.6% in 2QFY2016. On adjusting
for the real estate transaction, the adj. PAT margin would stand at 1.2%. Decline in
yoy interest expenses is attributable to decline in the average cost of borrowings
and decline in debt to `2,100.9cr (vs `2,675.2cr in 2QFY2015).
Order book analysis
NCC‘s order book (including international business) stands at `17,487cr as of
2QFY2016, indicating a 14.3% yoy decline.
Exhibit 6: Order book stands at `18,727cr
Exhibit 7: B&R contribute 49% of the current order book
22,000
15.0
Mining, 1%
12.9
21,000
9.8
10.0
Power, 3%
International,
20,000
5.8
5.0
15%
19,000
0.7
0.0
Irrigation,
4%
Building &
Roads, 49%
18,000
(5.0)
(5.7)
(14.3)
(7.8)
Electrical,,
17,000
(10.0)
7%
16,000
(15.0)
15,000
(20.0)
Water,
4QFY14 1QFY15 2QFY15 3QFY15 4QFY15 1QFY16 2QFY16
Environment &
Railways, 21%
OB (` cr)
y/y change (%)
Source: Company, Angel Research
Source: Company, Angel Research
NCC has secured orders worth
`1,015cr in 2QFY2016. On excluding the
international business, the current order book to Last Twelve Month (LTM) sales
November 13, 2015
3
NCC | 2QFY2016 Result Update
ratio stands at 1.8x. Out of the current order book, `536cr is from the company’s
in-house power project, which is expected to be completed in 2HFY2016.
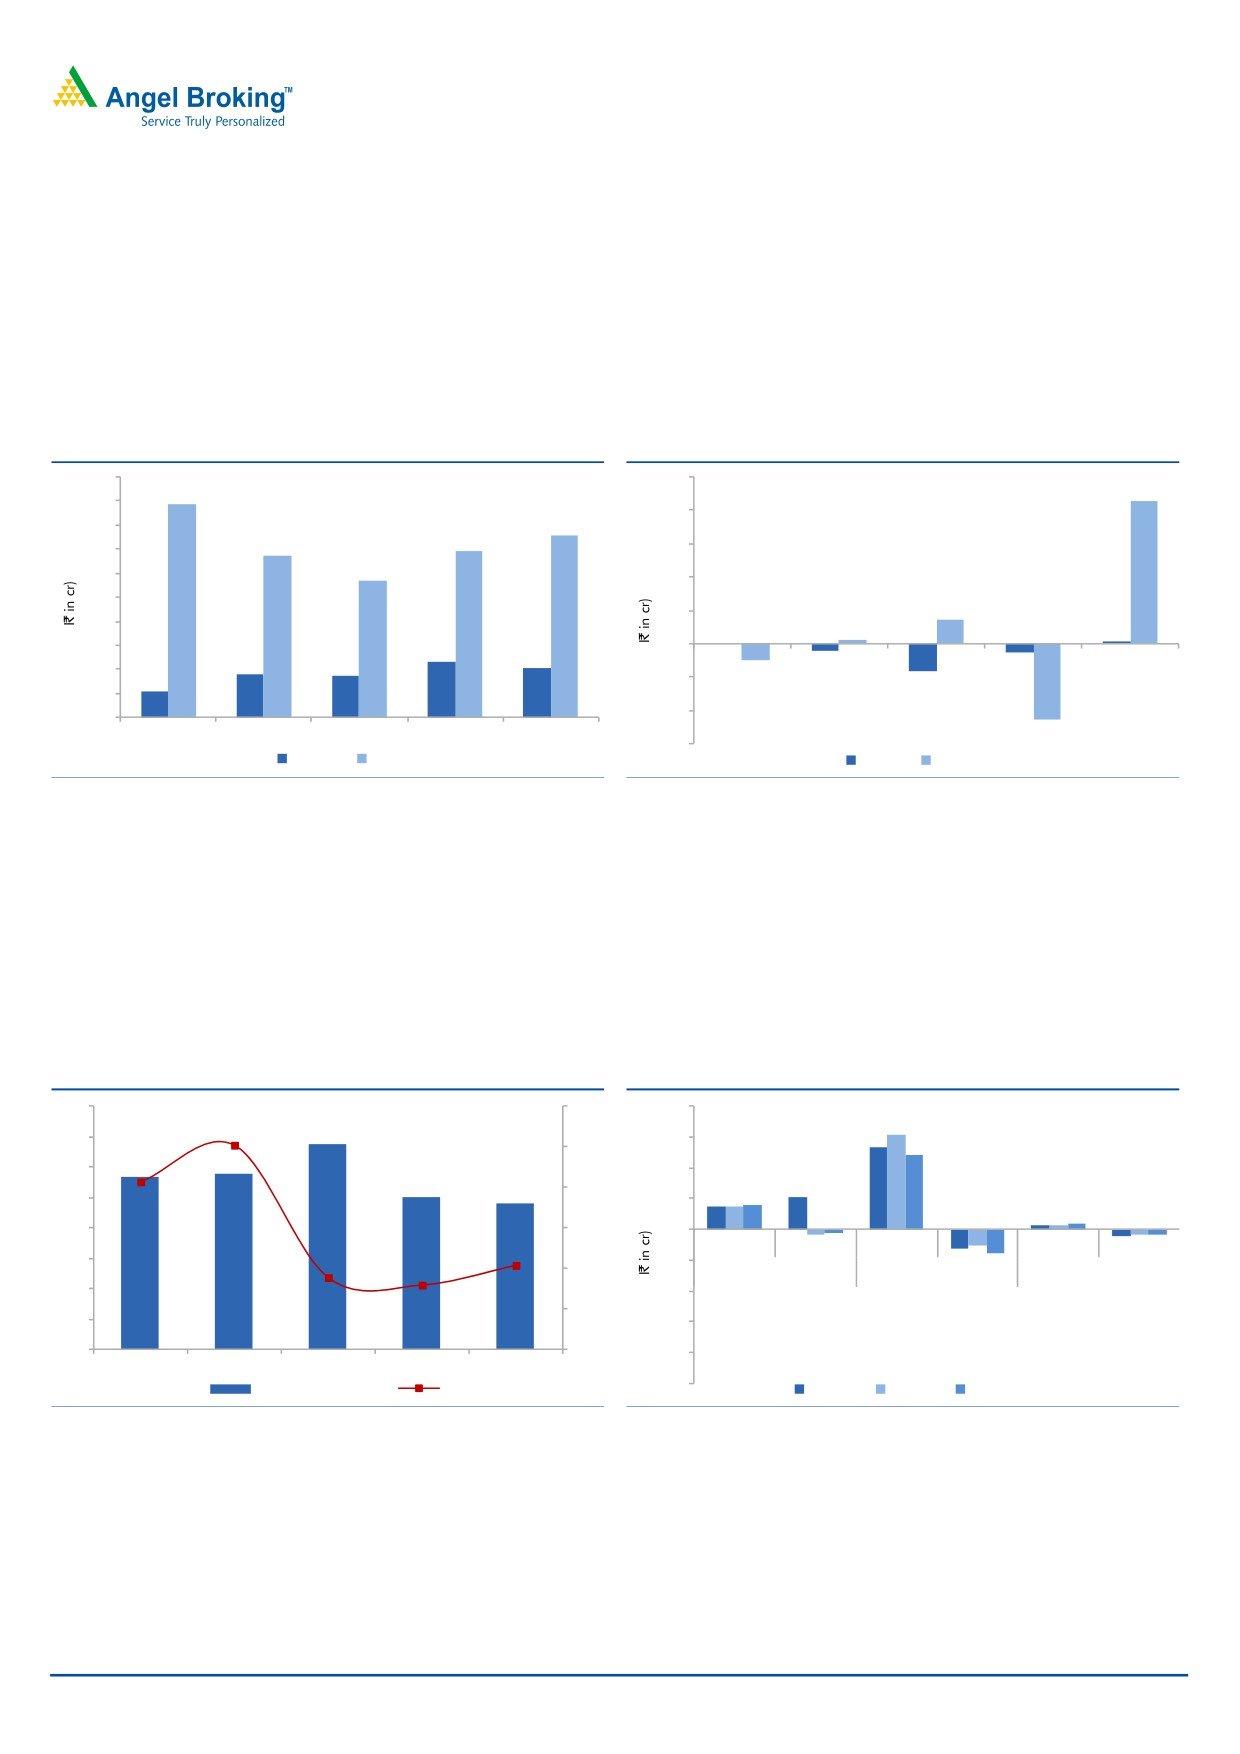
International business update
NCC International LLC (Oman), NCC’s largest international subsidiary, reported a
15.2% yoy decline in revenue to `151cr, as Batinah Express project (Package-II,
worth `2,287.6cr) is yet to gain traction from operations.
Exhibit 8: Muted Revenues in 2QFY2016
Exhibit 9: Oman subsidiaries reports profit
200
50
178
43
180
40
151
160
139
134
30
140
114
120
20
100
7
10
80
1
0
1
60
46
0
41
36
35
2QFY15
3QFY15
4QFY15
1QFY16
2QFY16
40
22
(10)
(5)
(2)
(8)
(3)
20
(20)
0
2QFY15
3QFY15
4QFY15
1QFY16
2QFY16
(23)
(30)
UAE
Oman
UAE
Oman
Source: Company, Angel Research
Source: Company, Angel Research
Notably, only the Omanese subsidiary reported a PAT of `43cr for 2QFY2016, on
account of higher revenue booking.
Real Estate business update
NCC Urban Infra, the company’s real estate subsidiary, reported a 15.8% yoy
decline in segment revenues to `48cr. Decline in yoy Real Estate segment revenues
led to PAT margin compression to 1.0% in 2QFY2016 (vs 2.1% in 2QFY2015).
Exhibit 10: Real Estate Business financials
Exhibit 11: BOT projects’ performance
80
3.0
40
31
26
70
30
24
2.5
2.5
60
20
10.3
2.1
2.0
7
8
8
50
10
1
1
2
40
1.5
0
Revenues
PAT
Revenues
PAT
Revenues
PAT
30
(10)
(2.1)
(1.9)
0.8
1.0
1.0
(1.5)
(6.0)
0.9
BETL
WUTL
PTTL
(1.9)
(1.4)
(7.6)
20
(20)
(5.0)
0.5
10
(30)
57
58
67
50
48
0
0.0
(40)
2QFY15
3QFY15
4QFY15
1QFY16
2QFY16
(50)
Revenues (` cr)
PAT %
4QFY15
1QFY16
2QFY16
Source: Company, Angel Research
Source: Company, Angel Research
BOT Projects Update
For the quarter, BETL (Bangalore Elevated Tollway Ltd) reported a revenue of
~`8cr (up 14.3% yoy) and and a PAT loss of `1.4cr (higher than year ago level
losses of `1.2cr), respectively.
November 13, 2015
4
NCC | 2QFY2016 Result Update
WUTL (Western UP Tollway Ltd) reported a 7.7% yoy decline in revenues to `24cr,
for the quarter. Losses at WUTL widened from `5cr to `7.6cr on a yoy basis.
Management Guidance & Our View
The company’s Management has maintained its order inflow guidance at `8,000cr
for FY2016, reflecting a 20% yoy growth. Considering `2,293cr of order inflows in
1HFY2016, and another
`2,058cr of order inflows in the current quarter
(3QFY2016) (takes the YTD total to `4,351cr), when coupled with uptick in the
awarding activity, indicates that NCC should attain its order inflow guidance for
FY2016E. Accordingly, we modeled
`7,900cr/`9,600cr of order inflows for
FY2016E/FY2017E, respectively.
The Management has given a revenue guidance of `7,800-`7,900cr for FY2016E.
Considering the bid pipeline, income from strategic sale of real estate and
execution cycle of current order book, we expect NCC to report a 3.2% revenue
CAGR during FY2016-17E, to `8,842cr.
NCC has guided for an EBITDA margin of 8.8-9% for FY2016E (reflecting 92-
117bp yoy improvement), and 9-9.25% for FY2017E. Considering 1HFY2016’s
performance and declining share of the low margin Power segment in the order
book, we model 127bp EBITDA margin expansion during FY2015-17E to 9.1%.
Other Key developments
NCC earlier announced sale of its stake in the 1,320MW Krishnapatnam Power
plant to Sembcorp. NCC’s Management has confirmed that it has received
`468.6cr of mobilization advances and another `317.8cr of retention money.
NCC is exploring to monetize its already operational BOT assets. The
Management highlighted that due diligence for Western UP Tollways is ongoing
and deal should get closed in the next few months. Further, the Management also
highlighted that it is exploring an alternative to monetize Bangalore Elevated
Tollways.
The Management highlighted that they have not made any fresh loans and
advances to their subsidiaries. Long-term loans and advances to subsidiaries as of
2QFY2016 stand at `135.9cr. On a qoq basis, loans and advances have
increased as interest from one of the subsidiaries has accrued but is not paid to the
parent. NCC Urban Infra, the real estate subsidiary, has repaid `71cr of debt to
the parent entity during YTDFY2016 and expects
~`29cr to be paid in
2HFY2016E.
Revision of Estimates
Considering income booked from Real Estate transactions (expected to contribute
in 3Q also), we are increasing our EBITDA and PAT estimates for FY2016E.
November 13, 2015
5
NCC | 2QFY2016 Result Update
Exhibit 12: Revised Earnings Estimates
FY2016E
FY2017E
Old
New
Chg. (%)
Old
New
Chg. (%)
Net Sales
7,892
7,892
0.0%
8,842
8,842
0.0%
EBITDA
651
695
6.8%
805
805
0.0%
EBITDA %
8.2
8.8
9.1
9.1
PAT
136
165
21.3%
297
297
0.0%
PAT %
1.7
2.1
3.4
3.4
Source: Company, Angel Research
November 13, 2015
6
NCC | 2QFY2016 Result Update
Outlook and Valuation
Considering the bid pipeline and emerging award activity environment, we are
optimistic that NCC should be able to report its targeted `8,000cr of order inflows
for FY2016E. Accordingly, we expect NCC to report `7,900cr/`9,600cr of order
inflows for FY2016E/ FY2017E, respectively.
Considering declining contribution of in-house power project, we have modeled a
4.9% yoy decline in revenues to `7,892cr in FY2016E. Higher contribution from
new projects should translate to 12% yoy revenue growth in FY2017E to `8,842cr.
On the whole, we expect NCC to report a
3.2% top-line CAGR during
FY2015-17E, respectively.
Considering (1) higher contribution from recently won projects (and declining
contribution from their low margin captive power project), and (2) better cost
management, we expect NCC to report a 127bp EBITDA margin expansion during
FY2015-17E to 9.1%.
Even though the Management expects NCC to repay `200-300cr of debt in
FY2016E, stretch in working capital (WC) cycle in our view should delay the debt
repayment cycle. We expect debt to decline by `290cr in FY2017E (reflecting
compression in the working capital cycle). This when coupled with lower interest
rates, should help the company report 15.5% negative CAGR in interest expenses
during FY2015-17E to `410cr. EBITDA margin expansion and decline in interest
expenses should lead to 201bp PAT margin expansion during FY2015-17E to
3.4%.
NCC’s stock price in the last 12 months has run up by 36.9%, mainly on account
of the company’s exercise of de-leveraging its balance sheet. Currently, NCC lags
behind its smaller peers on the execution front. On considering their declining
dependency on in-house power projects, we expect execution to gradually catch-up
from here on. With shift in execution mix towards higher margin orders, we expect
EBITDA margins to expand in FY2016-17E. Also, we see some leg-room for
improvement in WC as % of sales, going forward. On the whole, we expect the
next round of re-rating in the stock to come from (1) EBITDA margin expansion,
and (2) further compression in the working capital cycle.
We recommend Neutral with a price target of `90
We have valued NCC using the sum-of-the-parts method. NCC’s EPC business
(both, standalone entity and international subsidiaries) has been valued using
FY2017E P/E multiple, whereas BOT projects have been valued using “Free Cash
flow to Equity holders” method; the company’s real estate projects are valued
using Book Value.
Value of Core EPC business
We have valued NCC’s domestic EPC business (standalone entity) and Middle East
business (international subsidiaries) using P/E multiple of 14.0x and 10.0x,
respectively to arrive at an EPC business value of `81 per share.
November 13, 2015
7
NCC | 2QFY2016 Result Update
Value of BOT projects
BOT projects are valued at “Free Cash flow to Equity holders” method. Our value
for all 4 ongoing BOT projects comes to `6/share, which is 7% of the overall SOTP
value for the company.
Exhibit 13: Derivation of SOTP-based target price for NCC
FY17E PAT
Target
Target
Value/
% of
Particulars
Segment
Basis
(` cr)
Multiple
Value (` cr)
share (`)
SoTP
NCC's Domestic EPC business
Construction
297
14.0
4,155
75
83
P/E of 14x
NCC's International EPC business
Construction
32
10.0
323
6
6
P/E of 10x
Total
329
4,477
81
89
Disounted
Project
Adj. FCFE
Value/
% of
Particulars
Proj. Type
Basis
FCFE (` cr)
Stake
Value (` cr)
share (`)
SoTP
Road BOT projects
OB Infrastructure (OBIL)
Annuity
110
64%
71
1
1
Ke of 16%
Bangalore Elevated Tollway (BETL)
Toll
474
26%
123
2
2
Ke of 16%
Western UP Tollway (WUTL)
Toll
223
51%
114
2
2
Ke of 16%
Pondicherry-Tindivanam Tollway (PTTL)
Toll
107
40%
43
1
1
Ke of 16%
Total
915
350
6
7
Book Value
Target
Adj. Book
Value/
% of
Particulars
Proj. Type
Basis
(` cr)
Multiple
Value (` cr)
share (`)
SoTP
Other projects
Inv. in Real Estate proj.
Real Estate
355
0.5
178
3
4
P/BV of 0.5x
(inc. NCC Urban Infra)
Total
355
178
3
4
Grand Total
5,005
90
100
Source: Company, Angel Research
Value of Real Estate business
Real Estate business has been valued using the “Book Value” method. We have
valued the Real Estate business at 0.5x the FY2017E book value to arrive at
`4/share, which is 4% of the overall SOTP value for the company.
On combining the value of EPC business, BOT projects, and Real Estate business,
we arrive at a combined business value of `90/share. Given all the positives
captured in the stock price, we maintain our NEUTRAL rating on the stock.
Company background
NCC, having started off as a building/industrial construction company, has
emerged as an EPC contractor with a diversified portfolio. NCC’s presence across
all key Infrastructure verticals: 1) roads; 2) buildings; 3) irrigation; 4) electrical; 5)
water; 6) power; 7) oil and gas; and 8) metals, endows it with relatively de-risked
business model. NCC has also ventured in international geographies such as
Oman and UAE, which further indicates business diversification.
November 13, 2015
8
NCC | 2QFY2016 Result Update
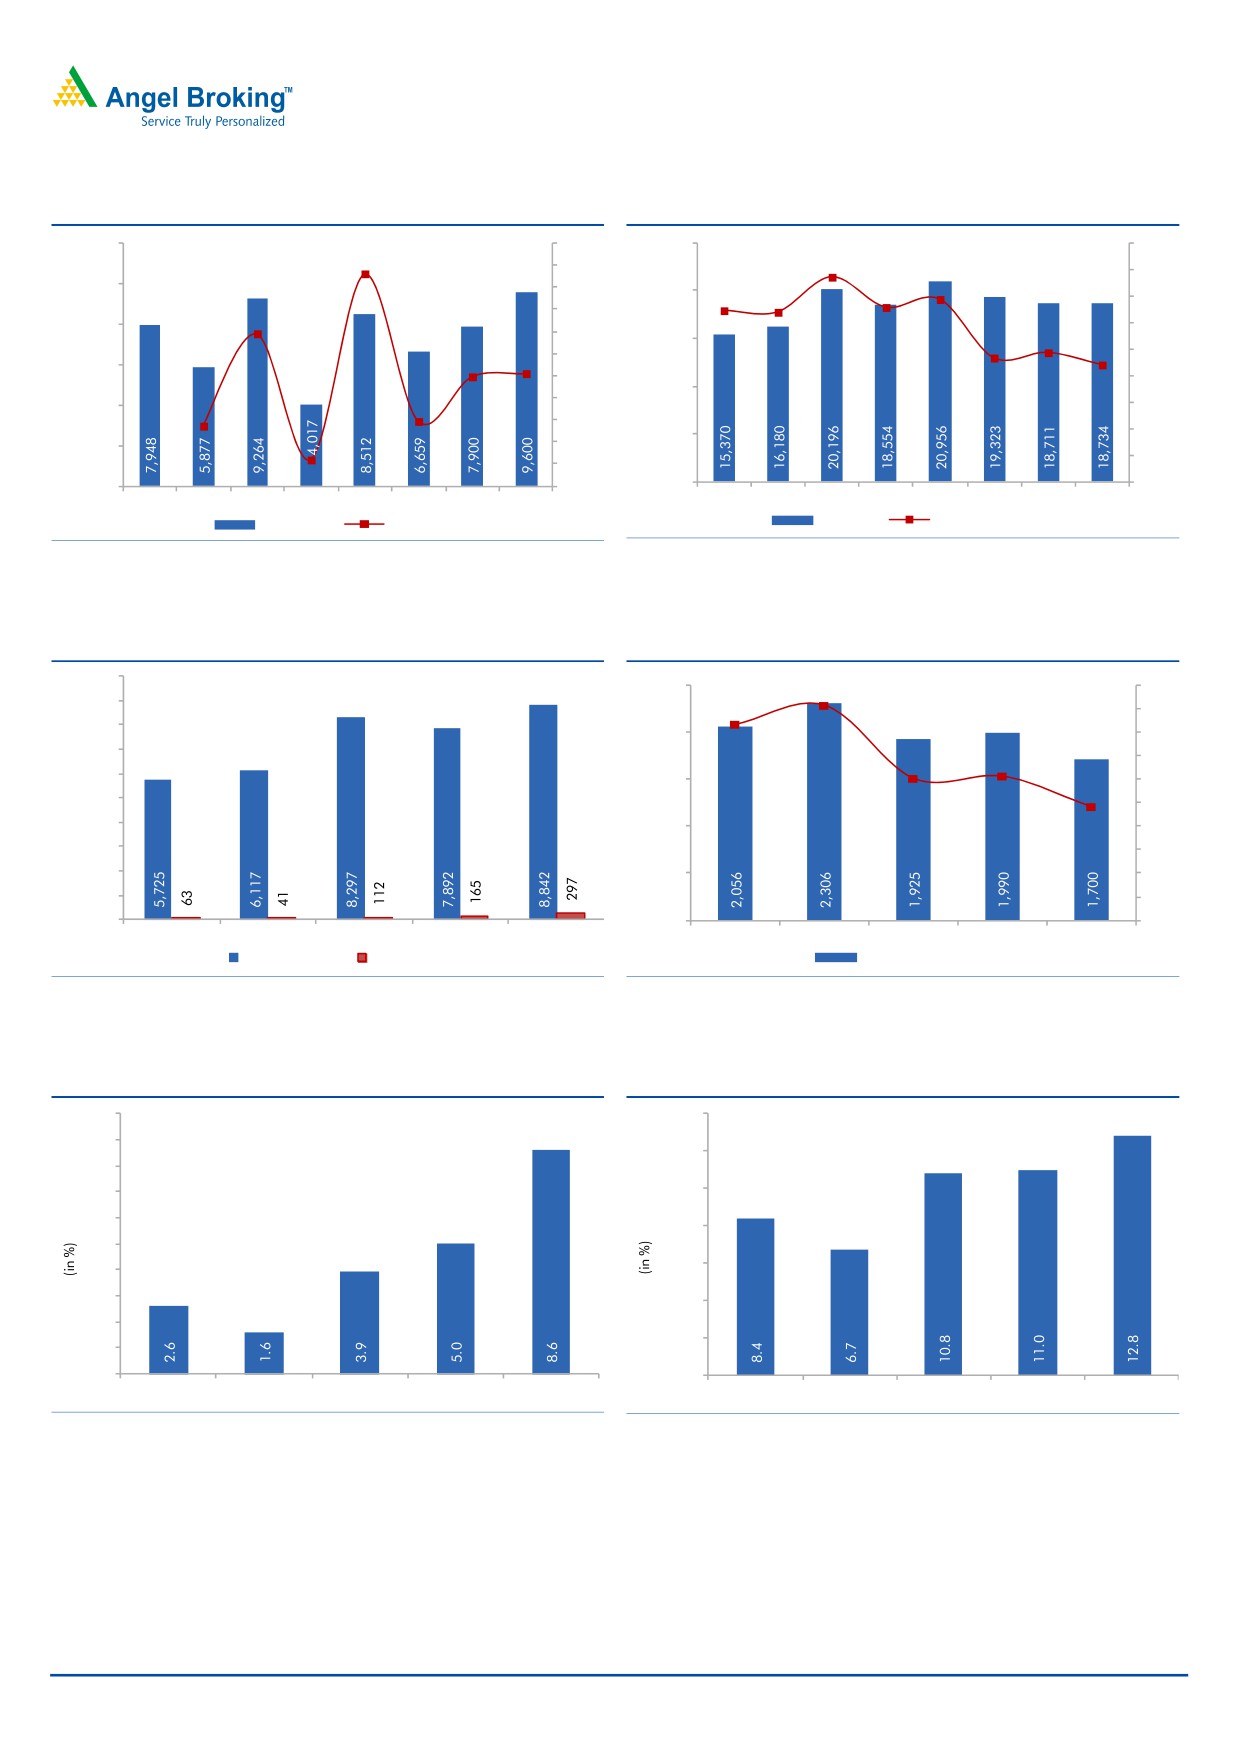
Exhibit 14: Order Inflows to report strong growth..
Exhibit 15: Order Book to see increased traction..
12,000
140
25,000
4.5x
3.9x
120
3.4x
4.0x
112
10,000
3.3x
2.3x
100
20,000
3.2x
3.2x
2.4x
2.2x
3.5x
80
8,000
3.0x
58
60
15,000
22
40
2.5x
6,000
19
20
2.0x
10,000
4,000
0
1.5x
(22)
(20)
(26)
1.0x
5,000
2,000
(40)
(57)
0.5x
(60)
0
(80)
0
0.0x
FY10
FY11
FY12
FY13
FY14
FY15
FY16E FY17E
FY10
FY11
FY12
FY13
FY14
FY15
FY16E FY17E
OI (` cr)
y/y change (%)
OB (` cr)
Execution Rate (x)
Source: Company, Angel Research
Source: Company, Angel Research
Exhibit 16: Profitability to see sharp improvement...
Exhibit 17: Std. D/E (to decline to 0.5x by FY2017E)
10,000
2,500
0.9x
1.0x
9,000
0.8x
0.9x
8,000
2,000
0.8x
7,000
0.7x
6,000
1,500
0.6x
0.6x
0.6x
5,000
0.5x
0.5x
4,000
1,000
0.4x
3,000
0.3x
2,000
500
0.2x
1,000
0.1x
0
0
0.0x
FY13
FY14
FY15
FY16E
FY17E
FY13
FY14
FY15
FY16E
FY17E
Revenues (` cr) PAT (` cr)
Standalone Debt (` cr)
Source: Company, Angel Research
Source: Company, Angel Research
Exhibit 18: RoEs set of expand to 8.6% by FY2017E
Exhibit 19: RoCE set of expand to 12.8% by FY2017E
10.0
14.0
9.0
12.0
8.0
7.0
10.0
6.0
8.0
5.0
6.0
4.0
3.0
4.0
2.0
2.0
1.0
0.0
0.0
FY13
FY14
FY15
FY16E
FY17E
FY13
FY14
FY15
FY16E
FY17E
Source: Company, Angel Research
Source: Company, Angel Research
November 13, 2015
9
NCC | 2QFY2016 Result Update
Profit & loss statement (Standalone)
Y/E March (` cr)
FY13
FY14
FY15
FY16E
FY17E
Net Sales
5,725
6,117
8,297
7,892
8,842
% Chg
9.0
6.9
35.6
(4.9)
12.0
Total Expenditure
5,254
5,712
7,648
7,197
8,038
Cost of RM Consumed
2,080
2,609
4,453
3,891
4,377
Const. & Sub-contracting Exp.
2,743
2,665
2,693
2,809
3,104
Employee benefits Expense
243
240
265
292
327
Other Expenses
188
198
237
205
230
EBITDA
471
405
649
695
805
% Chg
18.0
(14.0)
60.4
7.0
15.8
EBIDTA %
8.2
6.6
7.8
8.8
9.1
Depreciation
92
90
112
119
127
EBIT
379
315
538
575
678
% Chg
19.9
(16.8)
70.5
7.0
17.7
Interest and Fin. Charges
407
466
574
499
410
Other Income
126
154
195
170
175
PBT
98
3
159
246
443
Exceptional Items
0
0
0
0
0
Prior Period Adjustments
0
0
0
0
0
Tax
35
(38)
47
81
146
% of PBT
35.9
nmf
29.7
33.0
33.0
PAT
63
41
112
165
297
% Chg
74.2
(35.3)
175.9
47.5
79.9
PAT %
1.1
0.7
1.3
2.1
3.4
Basic EPS
2.4
1.6
2.0
3.0
5.3
Diluted EPS
2.4
1.6
2.0
3.0
5.3
% Chg
74.2
(35.3)
27.4
47.5
79.9
November 13, 2015
10
NCC | 2QFY2016 Result Update
Balance sheet (Standalone)
Y/E March (` cr)
FY13
FY14
FY15
FY16E
FY17E
SOURCES OF FUNDS
Equity Capital
51
51
111
111
111
Reserves Total
2,417
2,469
3,093
3,229
3,493
Shareholders Funds
2,468
2,520
3,204
3,340
3,604
Total Debt
2,056
2,306
1,925
1,990
1,700
Other Long-term Liabilities
54
63
53
63
66
Long-term Provision & Def. Tax Liab.
41
32
35
38
40
Total Liabilities
4,619
4,922
5,218
5,431
5,409
APPLICATION OF FUNDS
Gross Block
1,107
1,155
1,215
1,305
1,413
Accumulated Depreciation
389
463
575
694
822
Net Block
719
692
640
610
592
Capital WIP
6
10
1
6
7
Investments
1,254
1,164
1,157
1,157
1,157
Inventories
1,426
1,599
1,803
1,862
1,927
Sundry Debtors
1,143
1,444
1,363
1,424
1,522
Cash and Bank Balance
80
69
113
134
199
Short-term Loans & Advances
2,113
2,817
2,755
2,785
2,810
Other Current Assets
916
957
1,314
1,335
1,384
Trade Payables
1,399
1,539
1,766
1,731
1,915
Other Current Liabilities
2,070
2,654
2,415
2,410
2,528
Short-term Provisions
40
13
34
22
25
Net Current Assets
2,170
2,680
3,134
3,378
3,374
Long-term Loans & Advances
320
256
140
130
130
Other Assets
151
119
148
150
150
Total Assets
4,619
4,922
5,218
5,431
5,409
November 13, 2015
11
NCC | 2QFY2016 Result Update
Cash flow statement (Standalone)
Y/E March (` cr)
FY13
FY14
FY15
FY16E
FY17E
Profit before tax
98
3
159
246
443
Depreciation
92
90
112
119
127
Other Adjustments
(111)
(114)
(203)
(41)
(24)
Change in Working Capital
(59)
(92)
(92)
(204)
73
Interest & Financial Charges
407
466
574
499
410
Direct taxes paid
(58)
17
(36)
(81)
(146)
Cash Flow from Operations
369
370
514
539
883
(Inc)/ Dec in Fixed Assets
(45)
(68)
(50)
(95)
(110)
(Inc)/ Dec in Invest. & Int. received
112
(105)
(29)
83
24
Cash Flow from Investing
67
(173)
(79)
(12)
(86)
Inc./ (Dec.) in Borrowings
(9)
250
(479)
65
(290)
Issue/ (Buy Back) of Equity
0
0
594
0
0
Dividend Paid (Incl. Tax)
(9)
(9)
(6)
(29)
(33)
Finance Cost
(405)
(457)
(518)
(499)
(410)
Cash Flow from Financing
(423)
(217)
(409)
(464)
(732)
Inc./(Dec.) in Cash
13
(20)
26
63
65
Opening Cash balances
52
65
45
71
134
Closing Cash balances
65
45
71
134
199
November 13, 2015
12
NCC | 2QFY2016 Result Update
Key ratios
Y/E March
FY13
FY14
FY15
FY16E
FY17E
Valuation Ratio (x)
P/E (on FDEPS)
31.7
49.0
38.5
26.1
14.5
P/CEPS
12.8
15.3
19.2
15.1
10.2
Dividend yield (%)
2.6
3.9
1.9
1.7
1.5
EV/Sales
0.7
0.7
0.7
0.8
0.7
EV/EBITDA
8.4
10.4
9.4
8.9
7.2
EV / Total Assets
0.9
0.9
1.2
1.1
1.1
Per Share Data (`)
EPS (Basic)
1.4
1.6
2.0
3.0
5.3
EPS (fully diluted)
1.4
1.6
2.0
3.0
5.3
Cash EPS
6.0
5.1
4.0
5.1
7.6
DPS
0.3
0.2
0.4
0.5
0.5
Book Value
96
98
58
60
65
Returns (%)
RoCE (Pre-tax)
8.4
6.7
10.8
11.0
12.7
Angel RoIC (Pre-tax)
8.5
6.6
10.7
11.1
13.3
RoE
2.6
1.6
3.9
5.0
8.5
Turnover ratios (x)
Asset Turnover (Gross Block) (x)
5.1
5.4
7.0
6.3
6.5
Inventory / Sales (days)
86
90
75
85
78
Receivables (days)
79
77
62
64
61
Payables (days)
243
246
201
212
196
NWC days
113
124
108
126
115
Leverage Ratios (x)
D/E ratio (x)
0.8
0.9
0.6
0.6
0.5
Debt/ EBITDA ratio (x)
4.4
5.7
3.0
2.9
2.1
Interest Coverage Ratio (x)
0.9
0.7
0.9
1.2
1.7
November 13, 2015
13
NCC | 2QFY2016 Result Update
Research Team Tel: 022 - 39357800
DISCLAIMER
Angel Broking Private Limited (hereinafter referred to as “Angel”) is a registered Member of National Stock Exchange of India Limited,
Bombay Stock Exchange Limited and Metropolitan Stock Exchange of India Limited. It is also registered as a Depository Participant with
CDSL and Portfolio Manager with SEBI. It also has registration with AMFI as a Mutual Fund Distributor. Angel Broking Private Limited is
a registered entity with SEBI for Research Analyst in terms of SEBI (Research Analyst) Regulations, 2014 vide registration number
INH000000164. Angel or its associates has not been debarred/ suspended by SEBI or any other regulatory authority for accessing
/dealing in securities Market. Angel or its associates including its relatives/analyst do not hold any financial interest/beneficial
ownership of more than 1% in the company covered by Analyst. Angel or its associates/analyst has not received any compensation /
managed or co-managed public offering of securities of the company covered by Analyst during the past twelve months. Angel/analyst
has not served as an officer, director or employee of company covered by Analyst and has not been engaged in market making activity
of the company covered by Analyst.
This document is solely for the personal information of the recipient, and must not be singularly used as the basis of any investment
decision. Nothing in this document should be construed as investment or financial advice. Each recipient of this document should
make such investigations as they deem necessary to arrive at an independent evaluation of an investment in the securities of the
companies referred to in this document (including the merits and risks involved), and should consult their own advisors to determine
the merits and risks of such an investment.
Reports based on technical and derivative analysis center on studying charts of a stock's price movement, outstanding positions and
trading volume, as opposed to focusing on a company's fundamentals and, as such, may not match with a report on a company's
fundamentals.
The information in this document has been printed on the basis of publicly available information, internal data and other reliable
sources believed to be true, but we do not represent that it is accurate or complete and it should not be relied on as such, as this
document is for general guidance only. Angel Broking Pvt. Limited or any of its affiliates/ group companies shall not be in any way
responsible for any loss or damage that may arise to any person from any inadvertent error in the information contained in this report.
Angel Broking Pvt. Limited has not independently verified all the information contained within this document. Accordingly, we cannot
testify, nor make any representation or warranty, express or implied, to the accuracy, contents or data contained within this document.
While Angel Broking Pvt. Limited endeavors to update on a reasonable basis the information discussed in this material, there may be
regulatory, compliance, or other reasons that prevent us from doing so.
This document is being supplied to you solely for your information, and its contents, information or data may not be reproduced,
redistributed or passed on, directly or indirectly.
Neither Angel Broking Pvt. Limited, nor its directors, employees or affiliates shall be liable for any loss or damage that may arise from
or in connection with the use of this information.
Note: Please refer to the important ‘Stock Holding Disclosure' report on the Angel website (Research Section). Also, please refer to the
latest update on respective stocks for the disclosure status in respect of those stocks. Angel Broking Pvt. Limited and its affiliates may
have investment positions in the stocks recommended in this report.
Disclosure of Interest Statement
NCC
1. Analyst ownership of the stock
No
2. Angel and its Group companies ownership of the stock
No
3. Angel and its Group companies' Directors ownership of the stock
No
4. Broking relationship with company covered
No
Note: We have not considered any Exposure below ` 1 lakh for Angel, its Group companies and Directors
Ratings (Based on expected returns
Buy (> 15%)
Accumulate (5% to 15%)
Neutral (-5 to 5%)
over 12 months investment period):
Reduce (-5% to -15%)
Sell (< -15)
November 13, 2015
14