4QFY2016 Result Update | Infrastructure
May 19, 2016
NBCC
ACCUMULATE
CMP
`984
Performance Highlights
Target Price
`1,098
Quarterly Highlights - Consolidated
Investment Period
12 Months
Y/E March (` cr)
4QFY16 4QFY15 3QFY16
% chg (yoy)
% chg (qoq)
Net sales
2,251
1,622
1,358
38.8
65.8
Stock Info
Sector
Infrastructure
EBITDA
120
139
56
(13.7)
115
Net profit
141
134
57
5.9
147
Market Cap (` cr)
11,805
Source: Company, Angel Research;
Net Debt (` cr)
(1,160)
Beta
1.1
National Building Construction Corporation (NBCC) reported a strong 38.8% yoy
52 Week High / Low
1,215/707
increase in revenue for 4QFY2016 to `2,251cr, which is above our estimate of
Avg. Daily Volume
212,239
`2,130cr. Revenue growth during the quarter was on account of 45.6% yoy
Face Value (`)
10
increase in the PMC segment revenue to `2,068cr. The segment accounted for
BSE Sensex
25,705
92% of the company’s 4QFY2016 revenues. Despite strong execution, NBCC
Nifty
7,870
however disappointed us on the margin front; the EBITDA margin for the quarter
Reuters Code
NATO.NS
came in at 5.3%, lower by 324bps on a yoy basis. The miss in the operating
performance percolated down to the PAT level. The PAT at `141cr is lower than
Bloomberg Code
NBCC@IN
our expectation of `186cr while the reported PAT margin declined 196bp yoy to
6.3% for 4QFY2016.
Shareholding Pattern (%)
NBCC‘s order book stands at `37,000cr as of 4QFY2016, indicating an increase
Promoters
90.0
of over 100% on a yoy basis. The current order book to Last Twelve Month (LTM)
MF / Banks / Indian Fls
3.4
sales ratio stands at 6.3x.
FII / NRIs / OCBs
0.0
Indian Public / Others
6.6
Outlook and valuation: Considering the reviving award activity environment, we
expect NBCC to report ~`20,000cr of order inflows each year for FY2017-18E.
Also, emerging opportunities in the redevelopment space, the government’s
Abs. (%)
3m 1yr
3yr
initiative of developing ‘Smart Cities’ and the company’s cash rich status should
Sensex
8.4
(7.0)
30.7
aid its growth. We expect the company to report 27.9% and 45.5% top-line and
NBCC
14.6
21.3
594.7
bottom-line CAGR during FY2016-18E, respectively. Given the bid pipeline and
the company’s huge order book, we are convinced about the company’s earnings
growth prospects over the next few years. Accordingly, we have assigned 20.0x
3-year price chart
P/E multiple to our FY2018E EPS of `55/share to arrive at a price target of
1400
`1,098. Given the 12% upside potential in the stock from the current level, we
1200
maintain our Accumulate rating on the stock.
1000
800
Key Financials (Consolidated)
600
Y/E March (` cr)
FY14
FY15
FY16
FY17E
FY18E
400
Net Sales
4,070
4,674
5,838
7,428
9,549
200
% chg
14.8
24.9
27.2
28.5
0
Net Profit
257
278
311
490
659
% chg
8.1
11.8
57.5
34.4
EBITDA (%)
5.9
6.2
6.0
7.9
8.6
Source: Company, Angel Research
EPS (`)
21
23
26
41
55
P/E (x)
45.8
42.4
37.9
24.1
17.9
P/BV (x)
10.4
8.8
7.8
6.2
4.8
RoE (%)
22.6
22.5
21.9
28.8
30.4
RoCE (%)
36.2
39.3
39.4
50.8
50.2
Santosh Yellapu
EV/Sales (x)
2.6
2.3
1.8
1.3
1.0
022-39357800 Ext: 6811
EV/EBITDA (x)
44.1
36.8
29.7
16.4
11.0
Source: Company, Angel Research; Note: CMP as of May 18, 2016
Please refer to important disclosures at the end of this report
1
NBCC | 4QFY2016 Result Update
Exhibit 1: Quarterly Performance (Consolidated)
Particulars (` cr)
4QFY16
3QFY16
% chg (qoq)
4QFY15
% chg (yoy)
FY2016
FY2015
% chg
Net Sales
2,251
1,358
65.8
1,622
38.8
5,760
4,359
32.1
Total Expenditure
2,131
1,302
63.7
1,483
43.7
5,487
4,112
33.5
Cost of materials consumed
188
13
1,393.1
108
74.8
233
180
29.5
Changes in Inv. of FG & WIP
(240)
(42)
nmf
(96)
nmf
(301)
(155)
nmf
Employee Benefits Expense
53
54
(1.6)
47
13.0
226
195
15.6
Other Expenses
40
17
130.0
16
154.9
79
57
38.7
Work & Consultancy Expenses
2,089
1,260
65.8
1,408
48.4
5,251
3,835
36.9
EBITDA
120
56
115.0
139
(13.7)
273
247
10.4
EBIDTA %
5.3
4.1
8.6
4.7
5.7
Depreciation
1
1
15.3
0
36.0
2
2
(4.7)
EBIT
119
55
115.9
139
(13.9)
271
245
10.6
Interest and Financial Charges
14
10
41.0
9
60.6
37
40
(8.6)
Other Income
94
38
146.7
62
53.6
207
188
10.1
PBT before Exceptional Items
200
84
138.9
191
4.4
441
393
12.3
Exceptional Items
0
0
0
0
0
PBT after Exceptional Items
200
84
138.9
191
4.4
441
393
12.3
Tax
58
26
121.2
58
1.1
130
115
13.7
% of PBT
29.2
31.5
30.2
29.5
29.2
PAT bef. Minority Interest
141
57
147.0
134
5.9
311
278
11.8
Minority Interest
(0)
(0)
0
(0)
0
PAT
141
57
147.0
134
5.9
311
278
11.8
PAT %
6.3
4.2
8.2
5.4
6.4
Dil. EPS (after extra-ord. Items)
2.36
0.95
148.4
2.23
5.8
5.19
4.64
11.9
Source: Company, Angel Research; Note: nmf- Not Meaningful
Strong revenue growth driven by PMC segment
NBCC reported a strong 38.8% yoy increase in revenue for 4QFY2016 to
`2,251cr, which is ahead of our estimate of `2,130cr. Revenue growth during the
quarter was led by a 45.6% yoy increase in the PMC segment’s revenue to
`2,068cr; the segment accounted for 92% of the company’s 4QFY2016 revenues.
Further, a 54.0% yoy decline in the Real Estate segment’s revenue was offset by a
46.9% yoy increase in the EPC segment’s revenues. The East Kidwainagar
redevelopment project (reported under the PMC segment) contributed ~`300cr to
the company’s revenues for the quarter.
NBCC reported a 32.1% yoy increase in its FY2016 revenues to `5,760cr. The
surge is owing to a 32.2% yoy increase in the PMC segment’s revenues which
accounted for 90% of the company’s FY2016 revenues.
May 19, 2016
2
NBCC | 4QFY2016 Result Update
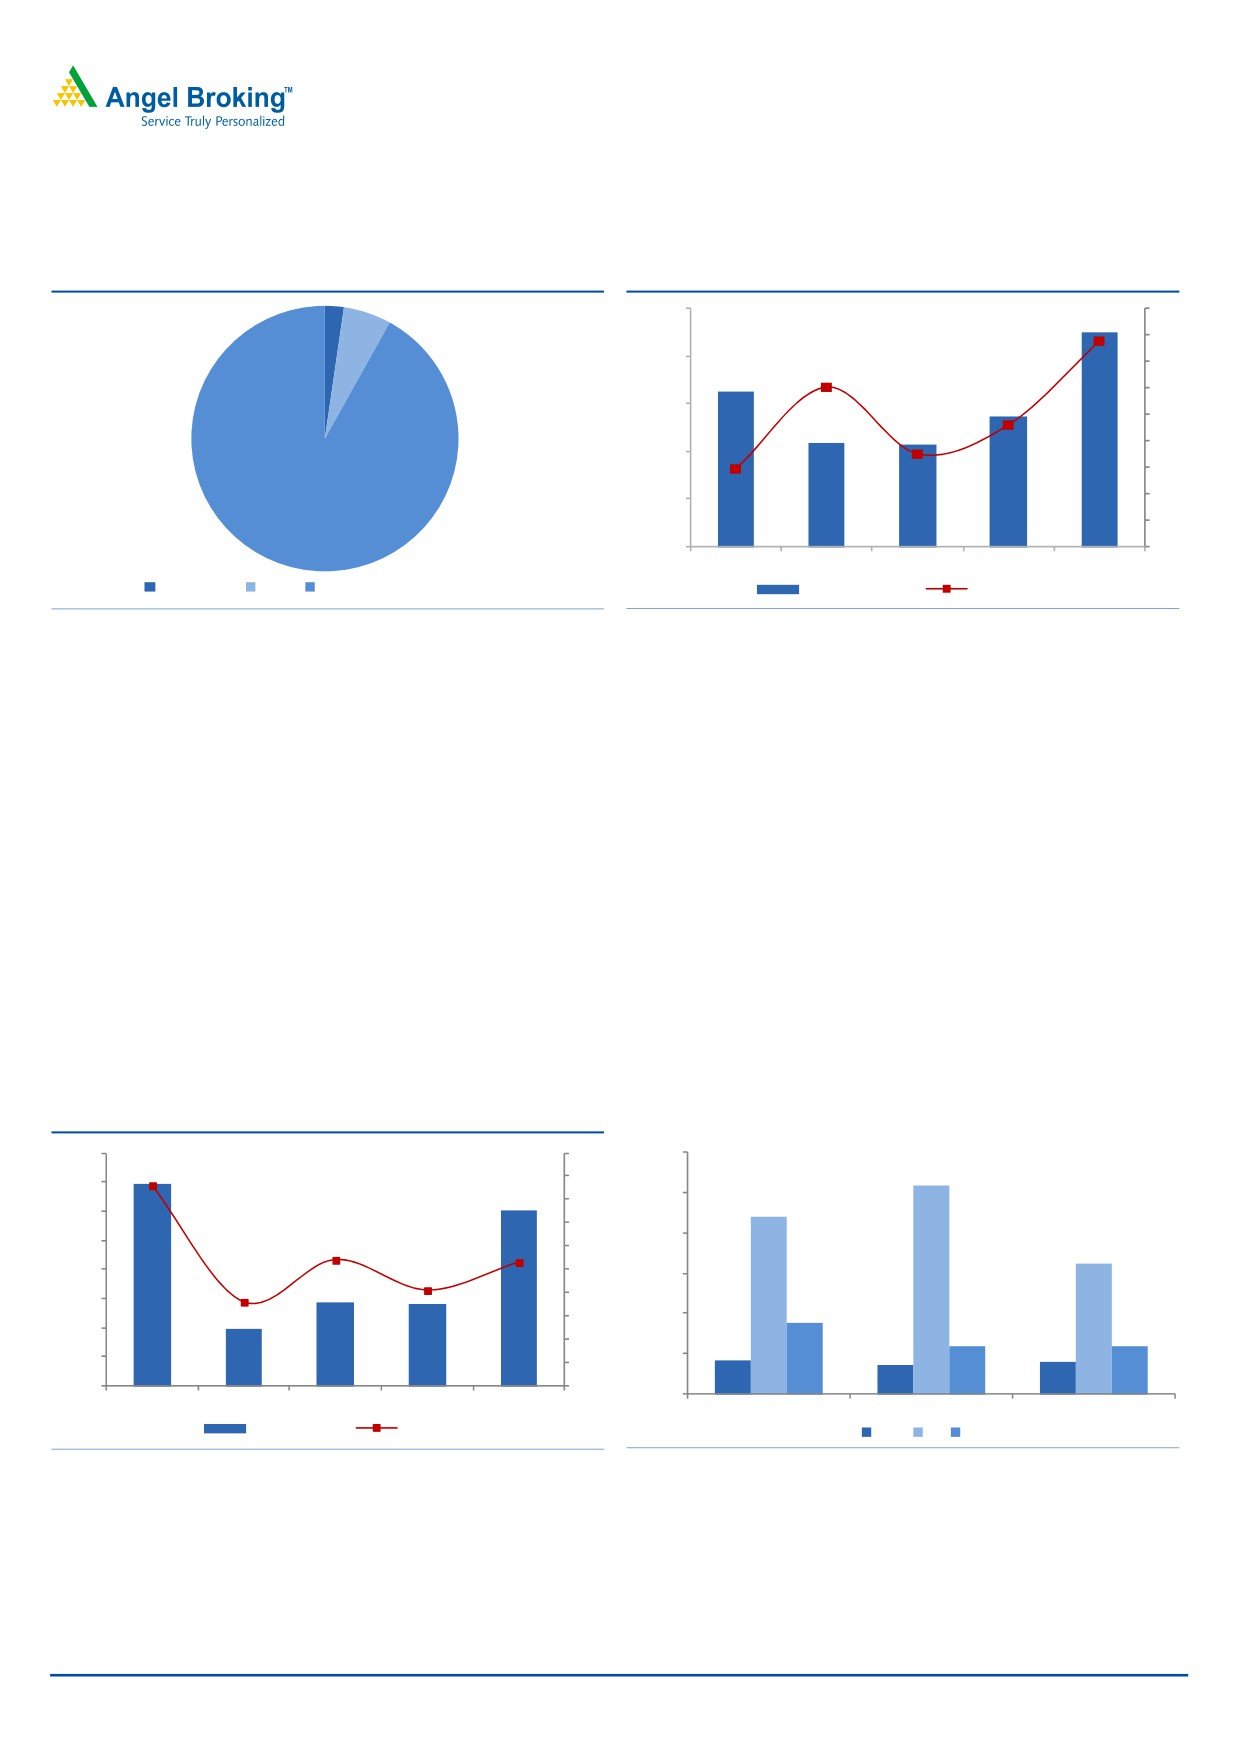
Exhibit 2: Revenue bifurcation - 4QFY2016
Exhibit 3: Quarterly revenue trend
2,500
45
2,251
2
6
40
2,000
35
30.1
38.8
1,622
30
1,500
1,358
25
1,089
1,062
14.7
23.0
20
1,000
17.5
15
10
500
5
92
0
0
4QFY2015
1QFY2016
2QFY2016
3QFY2016
4QFY2016
Real Estate
EPC
PMC (inc. Redevelopment works)
Revenue (` cr)
yoy growth (%)
Source: Company, Angel Research
Source: Company, Angel Research
EBITDA margin declines yoy
For 4QFY2016, NBCC disappointed on the margin front with the EBITDA margin
coming in at 5.3%, 324bp lower yoy. The decline in mainly attributable to (1)
74.8% increase in raw material costs, (2) 48.4% increase in work & consultancy
expenses, and (3) 154.9% increase in other expenses. The EBITDA margin for the
quarter was also impacted by a 13.0% yoy increase in employee expenses, which
is mainly on account of (1) higher provision towards post-retirement employee
medical benefits (based on actuarial valuation) and (2) one-time remuneration
made to employees on account of the company attaining Navratna status. The
Management highlighted that these 2 developments are one-time in nature.
Also, all the segments reported a decline in EBIT margins on a yoy basis. The
prime PMC segment reported a 54bp yoy decline in EBIT margin for the quarter to
7.9%.
Exhibit 4: EBITDA margin declines to 5.3%
Exhibit 5: EBITDA margin across business segments decline
160
10
60.0
8.6
51.8
140
9
5.3
50.0
8
44.1
120
7
5.4
4.1
40.0
100
32.5
6
80
5
30.0
3.6
60
4
17.6
3
20.0
40
11.9
12.0
2
8.5
7.3
7.9
20
10.0
1
139
39
58
56
120
0
0
0.0
4QFY2015
1QFY2016
2QFY2016
3QFY2016
4QFY2016
4QFY2015
3QFY2016
4QFY2016
EBITDA (` cr)
EBITDA (%)
PMC RE EPC
Source: Company, Angel Research
Source: Company, Angel Research
For the full year FY2016, the EBITDA margin declined 93bp yoy to 4.7%. The
decline is attributable to a 38.7% and 36.9% increase in other expenses and work
& consultancy expenses, respectively.
May 19, 2016
3
NBCC | 4QFY2016 Result Update
The miss on the EBITDA margin percolated down to the PAT level. The company
reported a PAT of `141cr for the quarter against our expectation of `186cr, while
the reported PAT margin declined 196bp yoy to 6.3%. Further, the company
benefitted from a 53.6% yoy increase in other income to `94cr on the back of
`16cr of provision reversal made towards payments to contractors in the previous
year.
Exhibit 6: PAT margin declines to 6.3%
160
9
8.2
6.3
140
8
7
120
5.4
6
100
4.2
5
80
3.6
4
60
3
40
2
20
1
134
45
67
57
141
0
0
4QFY2015
1QFY2016
2QFY2016
3QFY2016
4QFY2016
PAT (` cr)
PAT (%)
Source: Company, Angel Research
In-line with the EBITDA margin, the PAT margin for FY2016 declined 98bp yoy to
5.4%.
Order book analysis
NBCC reported over `25,000cr of order inflows in FY2016, indicating an over
300% yoy increase.
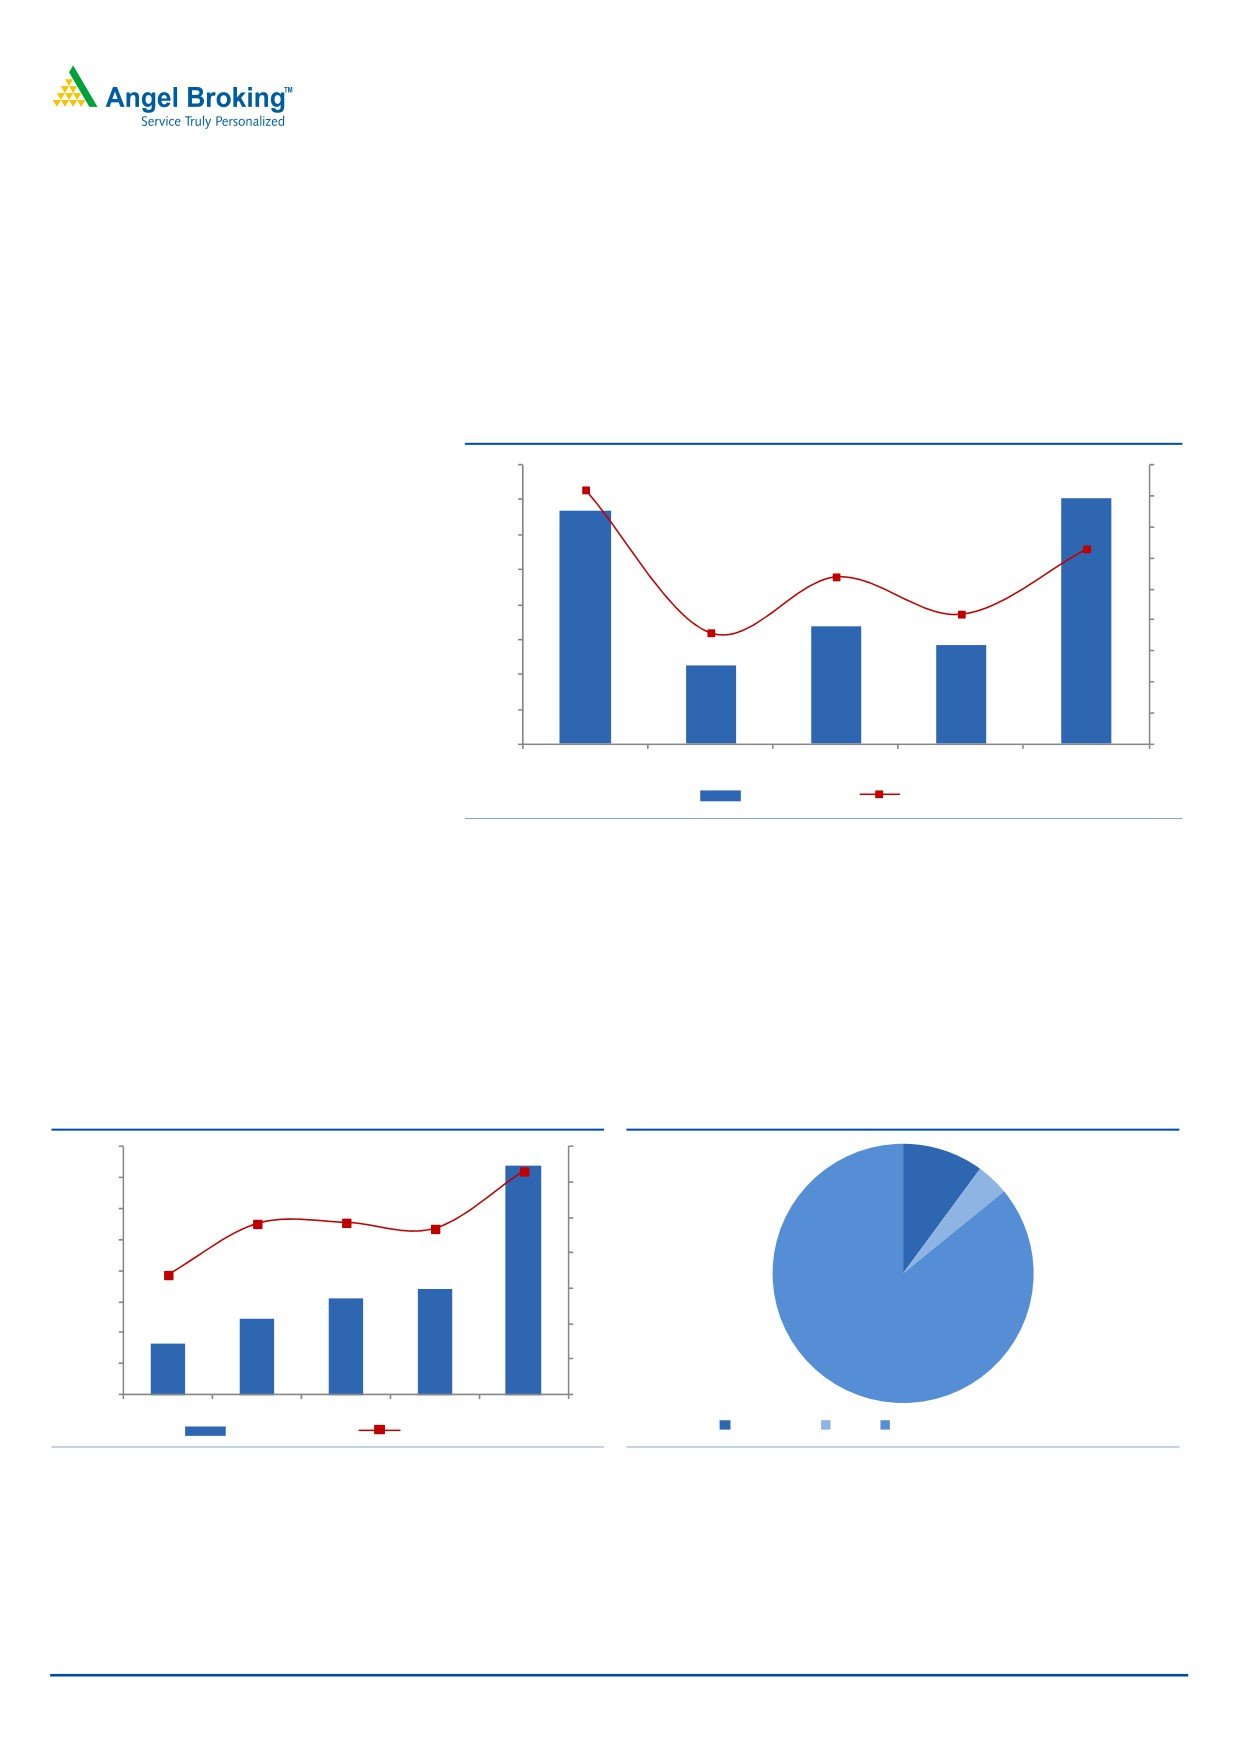
Exhibit 7: Order book stands at `37,000cr
Exhibit 8: PMC contributes 85% of Order Book
40,000
7
6.3
10
35,000
6
4
4.8
4.9
30,000
37,000
5
25,000
3.4
4.7
4
20,000
17,000
15,427
3
15,000
12,163
8,162
2
10,000
1
5,000
85
0
0
FY2012
FY2013
FY2014
FY2015
FY2016E
Real Estate
EPC
PMC (inc. Redevelopment works)
Order Book (` cr)
OB/ LTM (x)
Source: Company, Angel Research
Source: Company, Angel Research
The company’s order book stands at `37,000cr as of 4QFY2016, indicating over
100% yoy increase. A majority of the order wins were in the PMC segment, which
contributes ~85% of the total order book. The current order book to Last Twelve
Month (LTM) sales ratio stands at 6.3x.
May 19, 2016
4
NBCC | 4QFY2016 Result Update
The Management sounded optimistic in its concall interaction towards the
company being awarded 3 Delhi Re-development projects (at Sarojini Nagar,
Netaji Nagar and Nauroji Nagar) worth `25,000cr in the next 2 months, given the
recent developments and government approvals in place.
Concall Notes & Management Guidance
The company’s Board has withdrawn its earlier proposed follow-on public offer
(FPO), where the proceeds were expected to be used towards the 3 redevelopment
projects. Now the company expects to deploy internal accruals towards these 3
redevelopment projects. Initial equity requirement towards these redevelopment
projects would be in the range of `300-500cr, which in 6-12 months time period,
will be taken back from the project’s cash flows.
No major progress is seen across any works originating from Air India. Works
across 2-3 Bengaluru Waqf Board properties should start sooner and Detailed
Project Report (DPR) is being prepared for newly identified projects.
Drawings are made and DPR is being prepared for DDA and AIIMS projects.
Works for AIIMS projects would start in the next 6 months, whereas, works at DDA
would start in 4QFY2017.
Design works and DPR is being prepared for the Sanjay Lake View & Karkardooma
projects. Works are expected to start by 4QFY2017. Similarly once local bodies
approve (post design works are submitted), works across Chroma Centre project
(PMC project) would start. The Management expects this project to start by
Sep/Oct-2016.
East Kidwainagar re-development project is expected to report 8-10% margins.
The entire outstanding construction works worth `3,500cr would get completed in
the next 2-3 years. After handing over, NBCC would look after the O&M works of
this project for the next 30 years, where the billing across this duration is expected
in the range of `250cr (5% of `5,000cr). The Management has guided that they
are entitled to 20% margins on all the actual expenses incurred.
The company’s Management indicated that it would complete 51% stake purchase
of Hindustan Steelworks for ~`120-150cr in the next few months. The entire debt
outstanding of Hindustan Steelworks would be taken over by the Government of
India. The company would get access to ~`8,000cr of order book, a 7% EBITDA
margin business, and a few land parcels in addition to the existing business.
On the back of strong order inflows and current order book, the company’s
Management has guided for a 30% top-line and 20-25% bottom-line growth for
FY2017E.
The Management expects the company to report FY2017E EBITDA margins
(includes other income) in the range of 8-9%.
May 19, 2016
5
NBCC | 4QFY2016 Result Update
Revision of Estimates
On taking into consideration the company’s FY2016 results and the Management
commentary in the concall interaction, we are fine-tuning our FY2017-18E
estimates.
Exhibit 9: Revision of Estimates
FY2017E
FY2018E
Old
New change %
Old
New change %
Revenues
7,382
7,428
0.6%
9,506
9,549
0.5%
EBITDA
568
584
2.7%
818
825
0.9%
EBITDA %
7.7%
7.9%
8.6%
8.6%
PAT
478
490
2.5%
653
659
0.9%
PAT %
6.5%
6.6%
6.9%
6.9%
Source: Company, Angel Research
Outlook and Valuation
Considering the reviving award activity environment, we expect NBCC to report
~`20,000cr of order inflows each year for FY2017-18E. Post the Management’s
guidance in the recent concall interaction, we expect NBCC to report a 27.9%
top-line CAGR during FY2016-18E to `9,549cr. With expected shift in business
mix towards the high margin re-development works, we expect EBITDA margins to
improve from 6.0% in FY2016 to 8.6% in FY2018E. On back of the better
operating performance coupled with higher other income (given the cash rich
status of the company), we expect PAT margin to also improve from 5.3% in
FY2016 to 6.9% in FY2018E.
We maintain Accumulate with price target of `1,098
We have a strong positive view on NBCC, given its growth prospects as reflected
by its strong order book of `37,000cr (6.3x LTM revenues). Also, emerging
opportunities in the redevelopment space, the government’s initiative of developing
‘Smart Cities’, and the company’s cash rich status, should aid its growth. Given the
bid pipeline and huge order book, we are convinced about the strong earnings
growth potential of the company for the next few years. Accordingly, we have
conservatively assigned 20.0x P/E multiple to our FY2018E EPS of `55/share; we
arrive at a price target of `1,098. Given the 12% upside potential in the stock from
the current level, we maintain our Accumulate rating on the stock.
Company background
National Buildings Construction Corporation (NBCC) is a Navratna PSU company
engaged in the business of Project Management Consultancy (PMC), Engineering
Procurement & Construction (EPC) and Real Estate development.
The PMC business contributed ~90% of FY2016 sales and ~90% of FY2016 EBIT.
NBCC works on the entire project cycle, right from concept stage to commissioning
to civil construction works. It gets PMC contracts on nomination basis, as it is
notified as a Public Work Organization under revised Rule 126 (2) of General
Financial Rules (GFR). The real estate business involves development of residential
and commercial projects on Government/PSU land bank, through the joint
development or land bank development model.
May 19, 2016
6
NBCC | 4QFY2016 Result Update
Profit & loss statement (Consolidated)
Y/E March (` cr)
FY14
FY15
FY16
FY17E
FY18E
Net Sales
4,070
4,674
5,838
7,428
9,549
% Chg
14.8
24.9
27.2
28.5
Total Expenditure
3,831
4,386
5,487
6,844
8,724
Land & Materials Consumed
426
299
-68
502
646
Work and Consultancy Expenses
3,169
3,835
5,251
5,944
7,593
Employee benefits Expense
182
195
226
310
380
Other Expenses
55
57
79
89
105
EBITDA
239
288
351
584
825
% Chg
20.8
21.8
66.3
41.2
EBIDTA %
5.9
6.2
6.0
7.9
8.6
Depreciation
1
2
2
3
3
EBIT
237
286
349
581
822
% Chg
20.5
22.1
66.4
41.5
Interest and Financial Charges
22
40
37
50
53
Other Income
134
147
129
169
172
PBT
349
393
441
700
941
Tax
92
115
130
210
282
% of PBT
26.3
29.2
29.5
30.0
30.0
PAT before Extraordinary item
257
278
311
490
659
Extraordinary item
0
0
0
0
0
PAT before Minority Interest
257
278
311
490
659
Minority Interest
0
0
(0)
(0)
0
Share of Profit/ (Loss) of Asso.
0
0
0
0
0
PAT after MI, profit share from Asso.
257
278
311
490
659
% Chg
8.1
11.8
57.5
34.4
PAT %
6.3
6.0
5.3
6.6
6.9
Diluted EPS
21
23
26
41
55
% Chg
8.1
11.8
57.5
34.4
May 19, 2016
7
NBCC | 4QFY2016 Result Update
Balance sheet (Consolidated)
Y/E March (` cr)
FY14
FY15
FY16
FY17E
FY18E
Sources of Funds
Equity Capital
120
120
120
120
120
Reserves Total
1,021
1,218
1,385
1,776
2,320
Networth
1,141
1,338
1,505
1,896
2,440
Minority Interest
0
0
(0)
(0)
0
Total Debt
0
0
0
0
0
Long-term Liabilities
53
45
61
54
56
Total Liabilities
1,194
1,383
1,566
1,950
2,496
Application of Funds
Gross Block
35
42
49
53
56
Accumulated Depreciation
13
15
18
22
25
Net Block
23
26
31
31
31
Capital WIP
0
0
31
22
16
Investments
100
146
219
161
161
Goodwill
0
0
0
0
0
Current Assets
Inventories
1,020
1,173
1,443
1,536
2,030
Sundry Debtors
1,315
1,704
2,006
2,080
2,707
Cash and Bank Balance
1,201
1,067
1,160
2,059
2,548
Loans & Advances
515
612
616
662
860
Other Current Asset
11
16
8
17
18
Current Liabilities
3,013
3,381
3,978
4,650
5,908
Net Current Assets
1,047
1,192
1,255
1,704
2,257
Deferred Tax Asset
23
20
31
31
31
Total Assets
1,194
1,383
1,566
1,950
2,496
May 19, 2016
8
NBCC | 4QFY2016 Result Update
Cash flow statement (Consolidated)
Y/E March (` cr)
FY14 FY15 FY16E FY17E FY18E
Profit before tax
334
391
441
700
941
Depreciation & Amortisation Exp.
1
2
2
3
3
Other non-Cash Expenses
(122)
(158)
(158)
(171)
(177)
Change in Working Capital & Oth. Adj.
(619)
(342)
(7)
497
(5)
Cash Generated from Operations
(407)
(107)
278
1,030
762
Direct taxes paid
(32)
(47)
(143)
(225)
(300)
Net Cash Flow from Operations
(439)
(154)
135
805
462
(Inc)/ Dec in Fixed Assets
0
(7)
(8)
(4)
(3)
(Inc)/ Dec in Investments
718
(140)
(131)
8
(70)
(Inc)/ Dec in Other Investing Cash Flows
101
142
129
139
145
Cash Flow from Investing
818
(5)
(10)
143
72
Issue/ (Buy Back) of Equity
0
0
0
0
0
Inc./ (Dec.) in Loans
0
0
0
0
0
Dividend Paid (Incl. Tax)
(53)
(70)
(87)
(99)
(115)
Other Financing Cash Flows
0
0
0
0
0
Cash Flow from Financing
(53)
(70)
(87)
(99)
(115)
Inc./(Dec.) in Cash
327
(229)
38
849
419
Opening Cash balance & Oth. Adj.
569
896
667
705
1,554
Closing Cash balances
896
667
705
1,554
1,973
May 19, 2016
9
NBCC | 4QFY2016 Result Update
Key ratios
Y/E March
FY14
FY15
FY16
FY17E
FY18E
Valuation Ratio (x)
P/E (on FDEPS)
45.8
42.4
37.9
24.1
17.9
P/CEPS
45.6
42.1
37.7
23.9
17.8
Dividend yield (%)
0.5
0.6
0.6
0.7
0.8
EV/Sales
2.6
2.3
1.8
1.3
1.0
EV/EBITDA
44.1
36.8
29.7
16.4
11.0
EV / Total Assets
8.8
7.7
6.7
4.9
3.6
Per Share Data (`)
EPS (fully diluted)
21.5
23.2
25.9
40.8
54.9
Cash EPS
45.6
42.1
37.7
23.9
17.8
DPS
5.0
5.5
6.2
7.0
8.1
Book Value
95
112
125
158
203
Returns (%)
RoCE (Pre-tax)
36.2
39.3
39.4
50.8
50.2
Angel RoIC (Pre-tax)
32.6
32.4
31.8
39.5
40.7
RoE
22.6
22.5
21.9
28.8
30.4
Turnover ratios (x)
Inventory / Sales (days)
91
86
82
73
68
Receivables (days)
118
118
116
100
91
Payables (days)
287
266
245
230
221
Leverage Ratios (x)
D/E ratio (x)
0.0
0.0
0.0
0.0
0.0
Interest Coverage Ratio (x)
10.6
7.1
9.5
11.7
15.7
May 19, 2016
10
NBCC | 4QFY2016 Result Update
Research Team Tel: 022 - 39357800
DISCLAIMER
Angel Broking Private Limited (hereinafter referred to as “Angel”) is a registered Member of National Stock Exchange of India Limited,
Bombay Stock Exchange Limited and MCX Stock Exchange Limited. It is also registered as a Depository Participant with CDSL and
Portfolio Manager with SEBI. It also has registration with AMFI as a Mutual Fund Distributor. Angel Broking Private Limited is a
registered entity with SEBI for Research Analyst in terms of SEBI (Research Analyst) Regulations, 2014 vide registration number
INH000000164. Angel or its associates has not been debarred/ suspended by SEBI or any other regulatory authority for accessing
/dealing in securities Market. Angel or its associates including its relatives/analyst do not hold any financial interest/beneficial
ownership of more than 1% in the company covered by Analyst. Angel or its associates/analyst has not received any compensation /
managed or co-managed public offering of securities of the company covered by Analyst during the past twelve months. Angel/analyst
has not served as an officer, director or employee of company covered by Analyst and has not been engaged in market making activity
of the company covered by Analyst.
This document is solely for the personal information of the recipient, and must not be singularly used as the basis of any investment
decision. Nothing in this document should be construed as investment or financial advice. Each recipient of this document should
make such investigations as they deem necessary to arrive at an independent evaluation of an investment in the securities of the
companies referred to in this document (including the merits and risks involved), and should consult their own advisors to determine
the merits and risks of such an investment.
Reports based on technical and derivative analysis center on studying charts of a stock's price movement, outstanding positions and
trading volume, as opposed to focusing on a company's fundamentals and, as such, may not match with a report on a company's
fundamentals.
The information in this document has been printed on the basis of publicly available information, internal data and other reliable
sources believed to be true, but we do not represent that it is accurate or complete and it should not be relied on as such, as this
document is for general guidance only. Angel Broking Pvt. Limited or any of its affiliates/ group companies shall not be in any way
responsible for any loss or damage that may arise to any person from any inadvertent error in the information contained in this report.
Angel Broking Pvt. Limited has not independently verified all the information contained within this document. Accordingly, we cannot
testify, nor make any representation or warranty, express or implied, to the accuracy, contents or data contained within this document.
While Angel Broking Pvt. Limited endeavors to update on a reasonable basis the information discussed in this material, there may be
regulatory, compliance, or other reasons that prevent us from doing so.
This document is being supplied to you solely for your information, and its contents, information or data may not be reproduced,
redistributed or passed on, directly or indirectly.
Neither Angel Broking Pvt. Limited, nor its directors, employees or affiliates shall be liable for any loss or damage that may arise from
or in connection with the use of this information.
Note: Please refer to the important ‘Stock Holding Disclosure' report on the Angel website (Research Section). Also, please refer to the
latest update on respective stocks for the disclosure status in respect of those stocks. Angel Broking Pvt. Limited and its affiliates may
have investment positions in the stocks recommended in this report.
Disclosure of Interest Statement
NBCC
1. Analyst ownership of the stock
No
2. Angel and its Group companies ownership of the stock
No
3. Angel and its Group companies' Directors ownership of the stock
No
4. Broking relationship with company covered
No
Note: We have not considered any Exposure below ` 1 lakh for Angel, its Group companies and Directors
Ratings (Based on expected returns
Buy (> 15%)
Accumulate (5% to 15%)
Neutral (-5 to 5%)
over 12 months investment period):
Reduce (-5% to -15%)
Sell (< -15)
May 19, 2016
11