IPO Note | Media
March 1, 2017
Music Broadcast Limited
SUBSCRIBE
sue Open: March 06, 2017
Is
Playing the growth tune
Issue Close: March 08, 2017
Music Broadcast Limited (MBL) owns and operates FM radio stations under the
brand names Radio City and Radio Mantra. MBL has 39 radio stations and
operates in 37 Indian cities. The company has a strong listenership base in cities
Issue Details
like Mumbai, Delhi and Bangalore. Moreover it also has presence in the Internet
Radio Space with PlanetRadioCity.com - 40 web radio stations in 8 languages.
Face Value: `10
Strong leadership position in large markets: Radio City is ranked No. 1 in terms
Present Eq. Paid up Capital: `45.0cr
of number of listeners, total 49.6mn listeners across top 23 cities (according to a
survey conducted by AZ Research), whereas, its competitor, Entertainment
Offer for Sale: **0.26cr Shares
Network India Ltd (ENIL) is at 2nd place with 40.5mn listeners. Even in the metro
cities like Mumbai, Bangalore and Delhi, MBL enjoys a leadership position.
Fresh issue: `400 cr
Ability to charge premium advertising rates: Radio City’s wide listenership despite
Post Eq. Paid up Capital: `57cr
operating fewer stations has enabled the company to charge ~30% higher
advertising rates than its peers and 12-15% higher charges than its closest peer.
Issue size (amount): *`486cr -**489 cr
Owing to this, Radio City enjoys healthy 34% operating margin, much better than
ENIL’s ~30% margin in FY2016.
Price Band: `324-333
Volume growth outperforms peers as well as Industry: Radio City’s advertising
volumes have grown at a CAGR of ~12.5% over FY2011-16, while, ENIL
Lot Size: 45 shares and in multiple
reported ~9% CAGR in advertising volumes during the same period. Radio City’s
thereafter
advertising volumes have witnessed higher growth (CAGR of 10.4% over the
Post-issue implied mkt. cap: *`1,859cr -
same period) than the industry due to its higher listenership.
**`1,900cr
Higher revenue share despite operating lesser radio markets: Radio City operates
Promoters holding Pre-Issue: 96%
20 markets, while ENIL operates a total of 38 markets. Despite this, Radio City
Promoters holding Post-Issue: 71%
has 23% revenue share compared to 24% share of ENIL. We attribute this to its
dominant position in listenership and ability to charge premium advertising rates.
*Calculated on lower price band
Track record of healthy financial performance: Radio City, with ~19% CAGR in
** Calculated on upper price band
revenue, has outperformed its closest peer ENIL, which reported ~14% CAGR in
revenues over FY2013-16. In profitability too, Radio City, with ~54% CAGR in PAT over
Book Building
FY13-16, has performed much better than ENIL (~17% CAGR in PAT over FY2013-16).
QIBs
50% of issue
Outlook and Valuation: In terms of valuations, the pre-issue P/E works out to
25.2x its annualised 1HFY2017 earnings (at the upper end of the issue price
Non-Institutional
15% of issue
band), which is lower compared to its peers (ENIL is trading at 79.5x its
Retail
35% of issue
annualised 1HFY17 earnings). Also, MBL’s EV/sales multiple 6.2x, works out to be
at discount to ENIL’s 8.2x. On EV/EBITDA front too, Radio City’s issue appears to
be attractive 18.7x v/s. ENIL’s 37.4x. Moreover, MBL has a better margin and
Post Issue Shareholding Pattern
ROE profile than its comparable peers. Hence, considering the above positives
coupled with attractive valuations, we recommend a SUBSCRIBE on the issue.
Promoters
71%
Key Financials
Others
29%
Y/E March (` cr)
FY2014
FY2015
FY2016
1HFY17
Net Sales
154
201
232
137
% chg
11.7
30.3
15.7
-
Net Profit
24
47
43
30
% chg
109.4
93.5
(9.7)
-
OPM (%)
27.5
31.0
33.8
33.2
EPS (`)
5.4
10.4
9.4
6.6
P/E (x)
61.7
31.9
35.3
-
P/BV (x)
141.2
26.0
14.0
-
RoE (%)
229.0
81.7
39.6
-
RoCE (%)
23.6
13.6
17.0
-
Amarjeet S Maurya
EV/Sales (x)
10.2
8.6
7.4
-
+91 22 39357800 Ext: 6831
EV/EBITDA (x)
37.0
27.8
22.0
-
Source: Company, Angel Research; Note: Valuation ratios based on pre-issue outstanding shares and at upper end of the price band
Please refer to important disclosures at the end of this report
1
Music Broadcast | IPO Note
Company background
Music Broadcast Limited (MBL) owns and operates FM radio stations under the
brand names Radio City and Radio Mantra. The company has 39 radio stations
and operates its radio stations in 37 Indian cities. Radio City is present in 12 out of
the top 15 cities in India by population. Radio City has been ranked Number One
in Mumbai, Bangalore and Delhi in terms of number of listeners and has a total
number of 49.60mn listeners across all 23 cities (according to AZ Research). Music
Broadcast Limited operates as a subsidiary of Jagran Prakashan Limited. It also
operates 40 Web radio stations that offer Internet radio with live RJ hosted shows
through Planet Radio City in 8 languages. In addition, Music Broadcast Limited
operates 'Planet Radio City' mobile app that plays various stations such as 'Radio
City Freedom', 'Radio City Electronica', 'Radio City Metal', and 'Radio City Smaran'
in various languages on mobile and other smart devices.
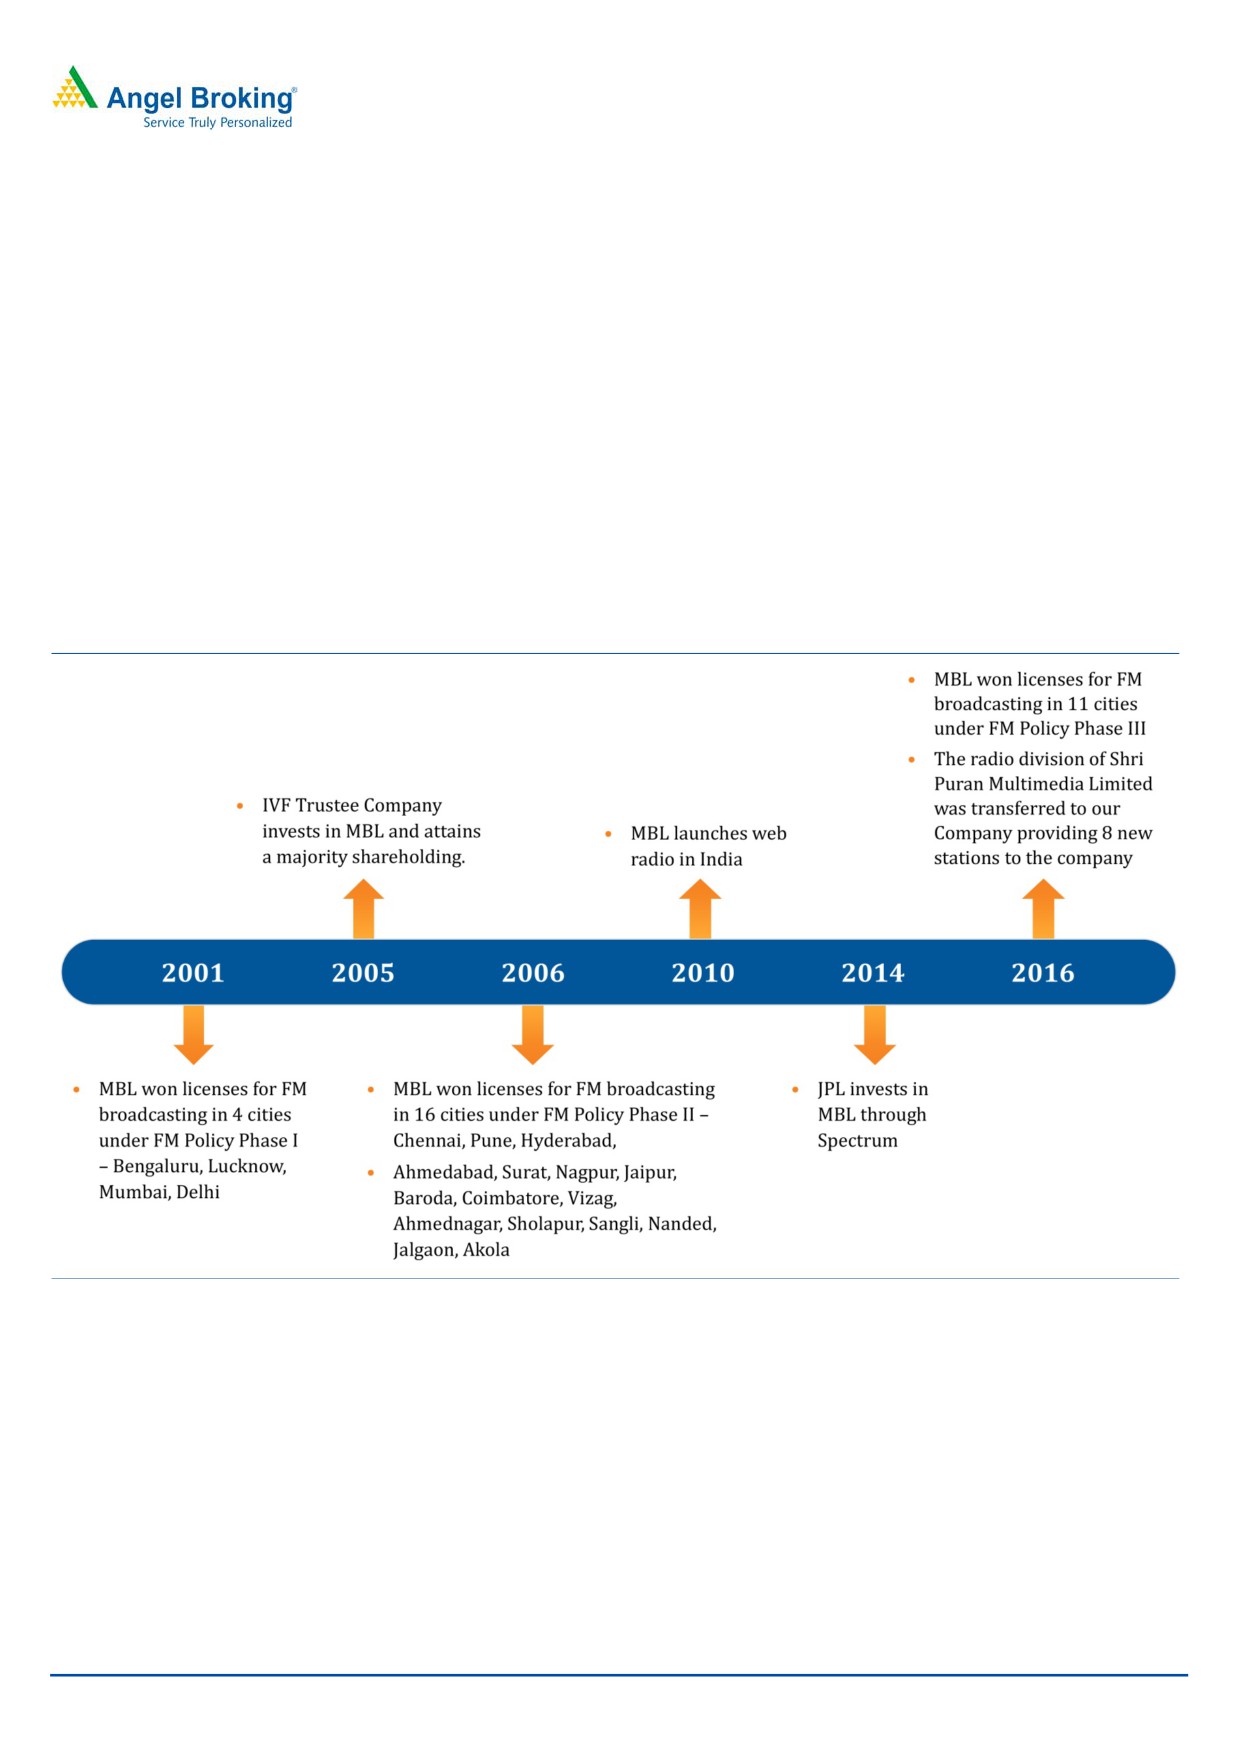
Exhibit 1: 15 years of Radio City - growing along with the FM industry’s liberalization curve
Source: Company, Angel Research
March 1, 2017
2
Music Broadcast | IPO Note
Issue details
The company is raising `400cr through a fresh issue of equity shares in the price
band of `324-333. The fresh issue will constitute 21.1% of the post-issue paid-up
equity share capital of the company, assuming the issue is subscribed at the upper
end of the price band. The company is offering 0.27cr shares that are being sold
by the promoter group.
Exhibit 2: Pre and Post-IPO shareholding pattern
No. of shares (Pre-issue)
(%) No. of shares (Post-issue)
(%)
Promoters
4,33,93,517
96%
4,07,34,999
71%
Others
16,49,250
4%
1,63,19,780
29%
4,50,42,767
100%
5,70,54,779
100%
Source: RHP, Angel Research
Note: Calculated on upper price band
Objects of the offer
Redemption of listed total NCDs of `200cr in phases. First trench of `50cr in
FY2017, next trench of `100cr in FY2018 and last trench of `50cr in FY2020.
Early redemption of the JPL NCDs and repayment/pre-payment of JPL ICDs of
`98.2cr in FY2018.
General corporate purpose.
March 1, 2017
3
Music Broadcast | IPO Note
Investment Rationale
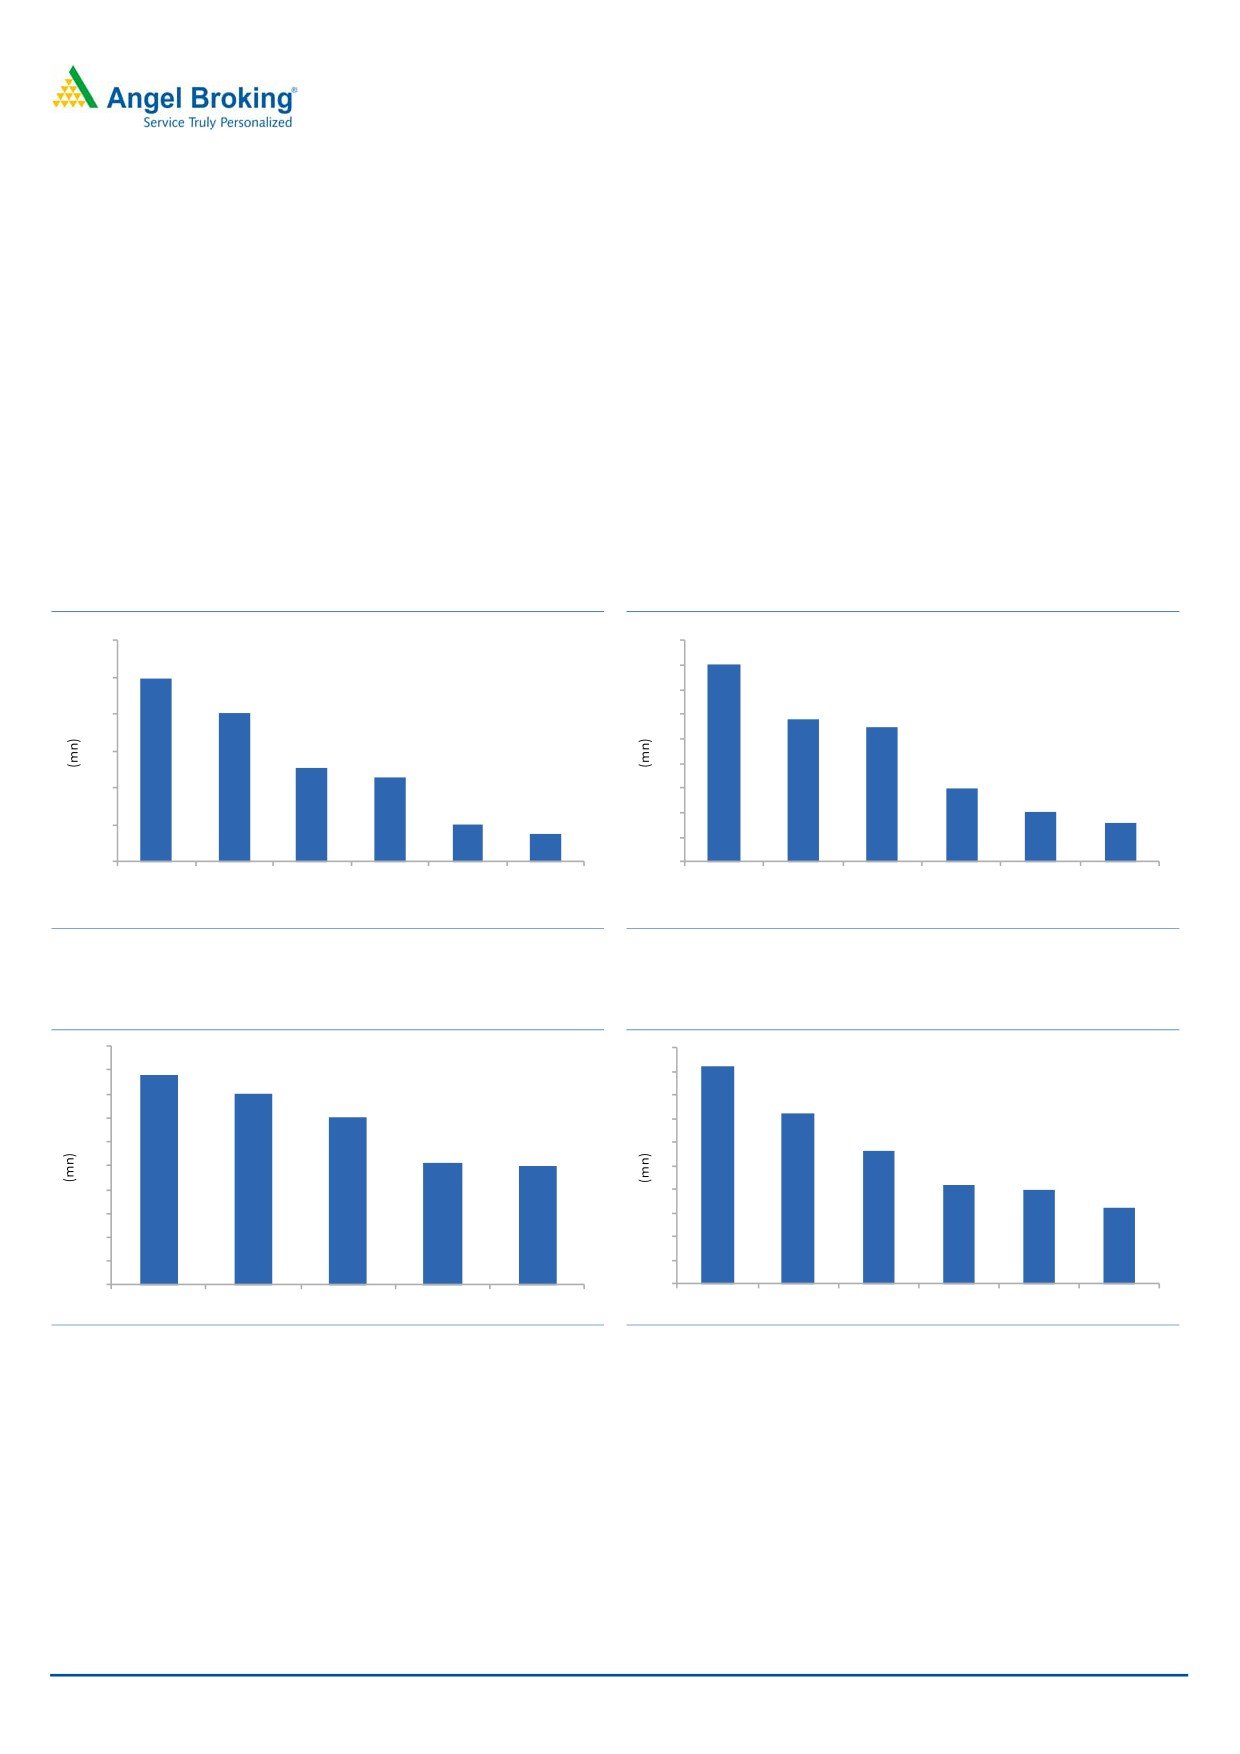
MBL has strong leadership position in large markets: Radio City is ranked No. 1 in
terms of number of listeners, total 49.6mn listeners across the 23 cities (its
competitor ENIL is at 2nd place with 40.5mn listeners). Even in the metro cities like
Mumbai, Bangalore and Delhi, MBL enjoys a leadership position.
According to a survey conducted by AZ Research in certain markets in which ‘Radio
City’ and ‘Radio Mantra’ operate, namely Delhi, Jaipur, Lucknow, Ahmedabad,
Vadodara, Surat, Mumbai, Pune, Nagpur, Ahmed Nagar, Hyderabad, Vizag,
Bengaluru, Chennai, Coimbatore, Ranchi, Varanasi, Agra, Bareilly, Gorakhpur,
Hissar, Jalandhar and Karnal, concluded that MBL has a listenership base of
49.6mn.
Exhibit 3: Listenership Across Markets
Exhibit 4: Listenership in Mumbai
60
9
8.0
49.6
8
50
7
40.5
5.8
5.5
40
6
5
30
25.3
22.9
4
3.0
20
3
2.0
10.1
1.6
7.6
2
10
1
0
0
Radio City
Radio
Big FM
Red FM
Fever
Radio One
Radio City
Big FM
Radio
Fever
Red FM
Radio One
Mirchi
Mirchi
Source: Company, Angel Research
Source: Company, Angel Research
Exhibit 5: Listenership in Delhi
Exhibit 6: Listenership in Bangalore
10
5
4.6
8.8
9
5
8.0
8
4
3.6
7.0
7
4
2.8
6
3
5.1
5.0
5
3
2.1
2.0
4
2
1.6
3
2
2
1
1
1
0
0
Radio City
Radio Mirchi
Red FM
Big FM
Fever
Radio City
Big FM Radio Mirchi Fever
Radio One Red FM
Source: Company, Angel Research
Source: Company, Angel Research
March 1, 2017
4
Music Broadcast | IPO Note
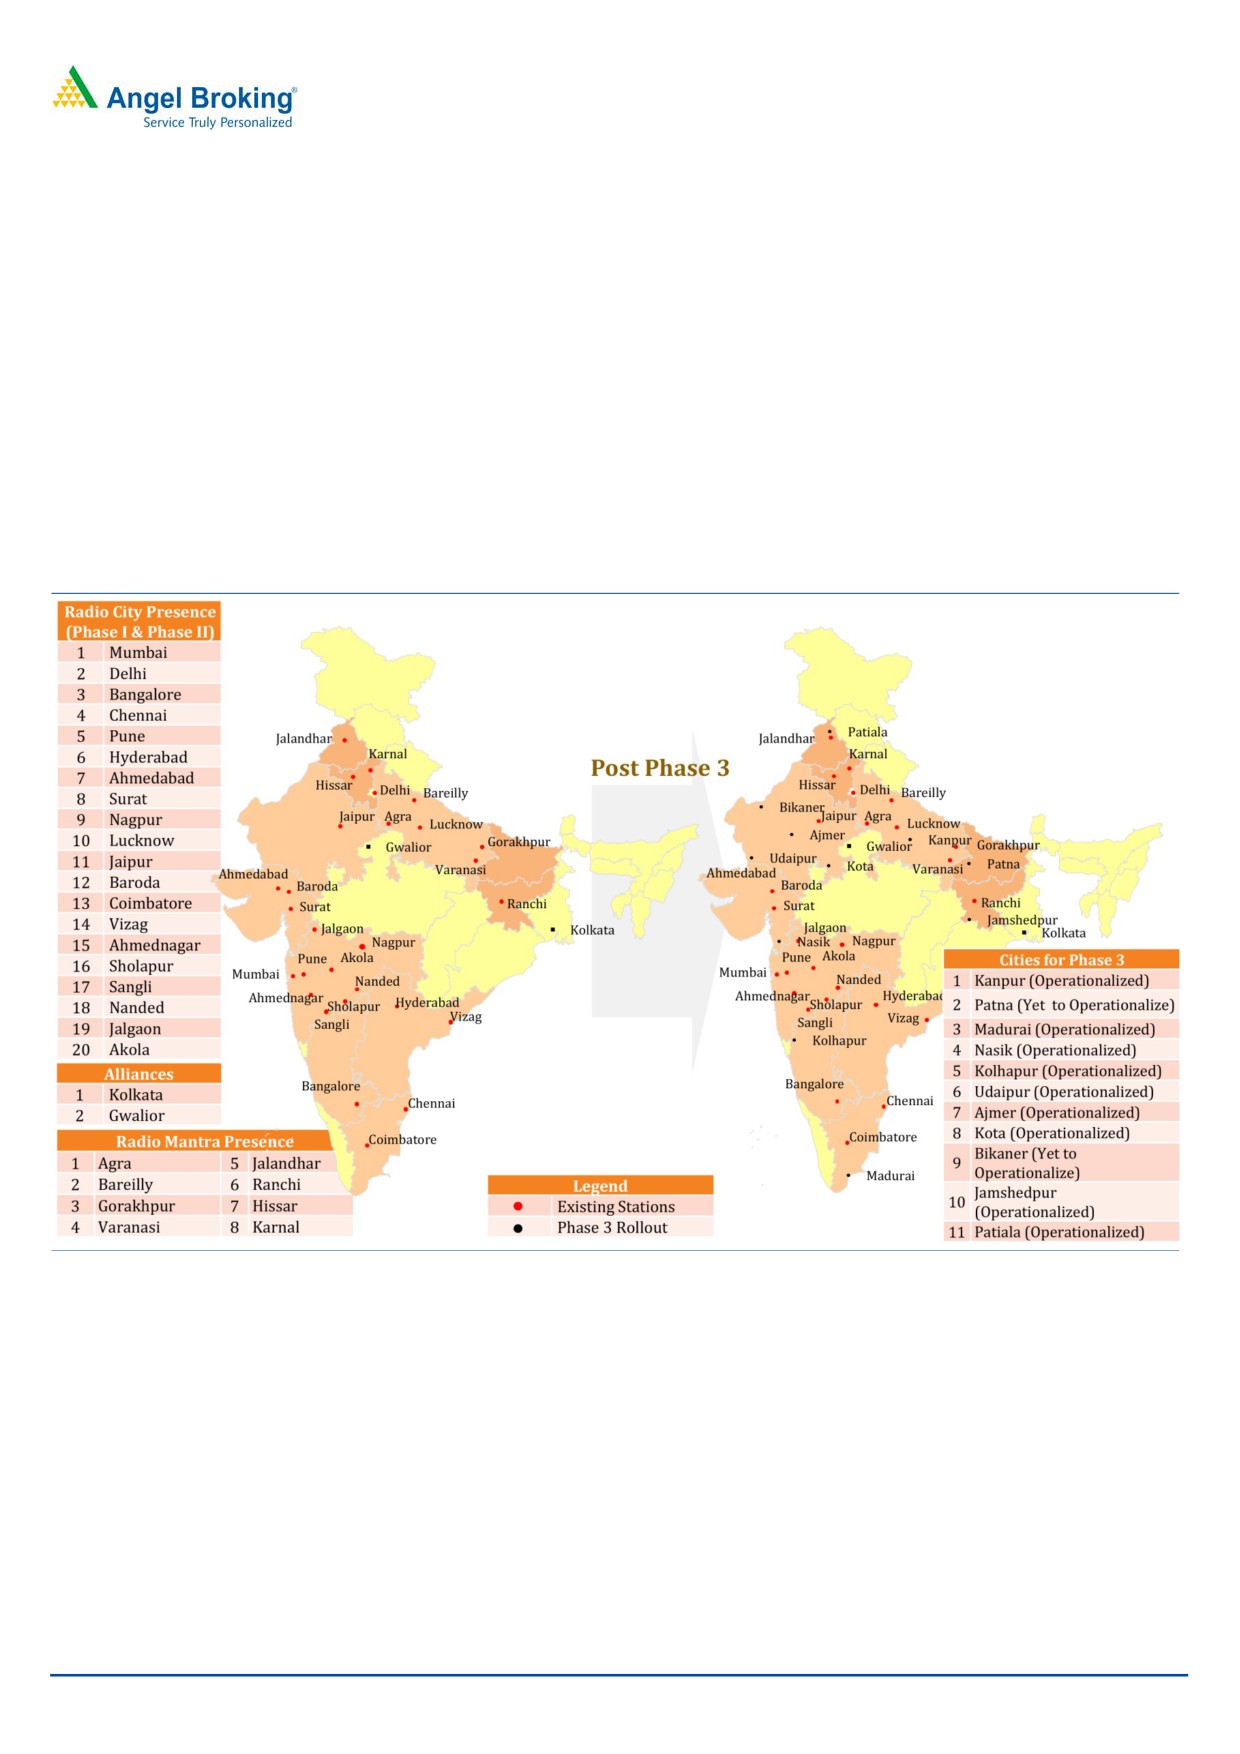
Pan-India presence to propel growth
The company operates total 39 radio stations out of which 29 are through ‘Radio
City’ brand, 8 radio stations are through ‘Radio Mantra’ brand and for the
remaining
2, the company has two sales alliances with ITM Software &
Entertainment Private Ltd., which operates ‘Suno Lemon’ in Gwalior and Ananda
Offset Private Ltd., which operates ‘Friends FM’ in Kolkata. MBL also expects to
operationalize two new Radio City Stations, namely Bikaner and Patna, by
March/ April 2017. Further, the company is in the process of re-branding the
Radio Mantra Stations as ‘Radio City’ stations. In this regards, it has made an
application dated January 11, 2017 to MIB for approval of rebranding the Radio
Mantra Stations as ‘Radio City’ stations.
Exhibit 7: Pan-India Presence in the Right Markets
Source: Company, Angel Research
Ability to charge premium advertising rates
Radio City’s wide listenership despite operating fewer stations has enabled the
company to charge ~30% higher advertising rates than its peers and 12-15%
higher charges than its closest peer. Owing to this, Radio City enjoys healthy 34%
operating margin, much better than ENIL’s ~30% margin in FY2016.
March 1, 2017
5
Music Broadcast | IPO Note
Volume growth outperforms peers as well as Industry
Radio City’s advertising volumes have grown at a CAGR of ~12.5% over
FY2011-16, while, ENIL reported ~9% CAGR in advertising volumes during the
same period. Radio City’s advertising volumes have witnessed higher growth
(CAGR of 10.4% over the same period) than the industry due to its higher
listenership.
Exhibit 8: Strong leadership in listener base over FY2011-16 aided
higher growth in advertisements
14.0%
12.5%
12.0%
10.9%
10.4%
10.0%
9.0%
8.0%
6.8%
6.0%
4.0%
2.0%
0.0%
Radio City
Radio Mirchi
Big FM
Red FM
Industry
Source: Company, Angel Research
Higher revenue share despite operating lesser radio markets
Radio City operates 20 markets, while ENIL operates a total of 38 markets. Despite
this, Radio City has 23% revenue share compared to 24% share of ENIL. We
attribute this to its dominant position in listenership and ability to charge premium
advertising rates.
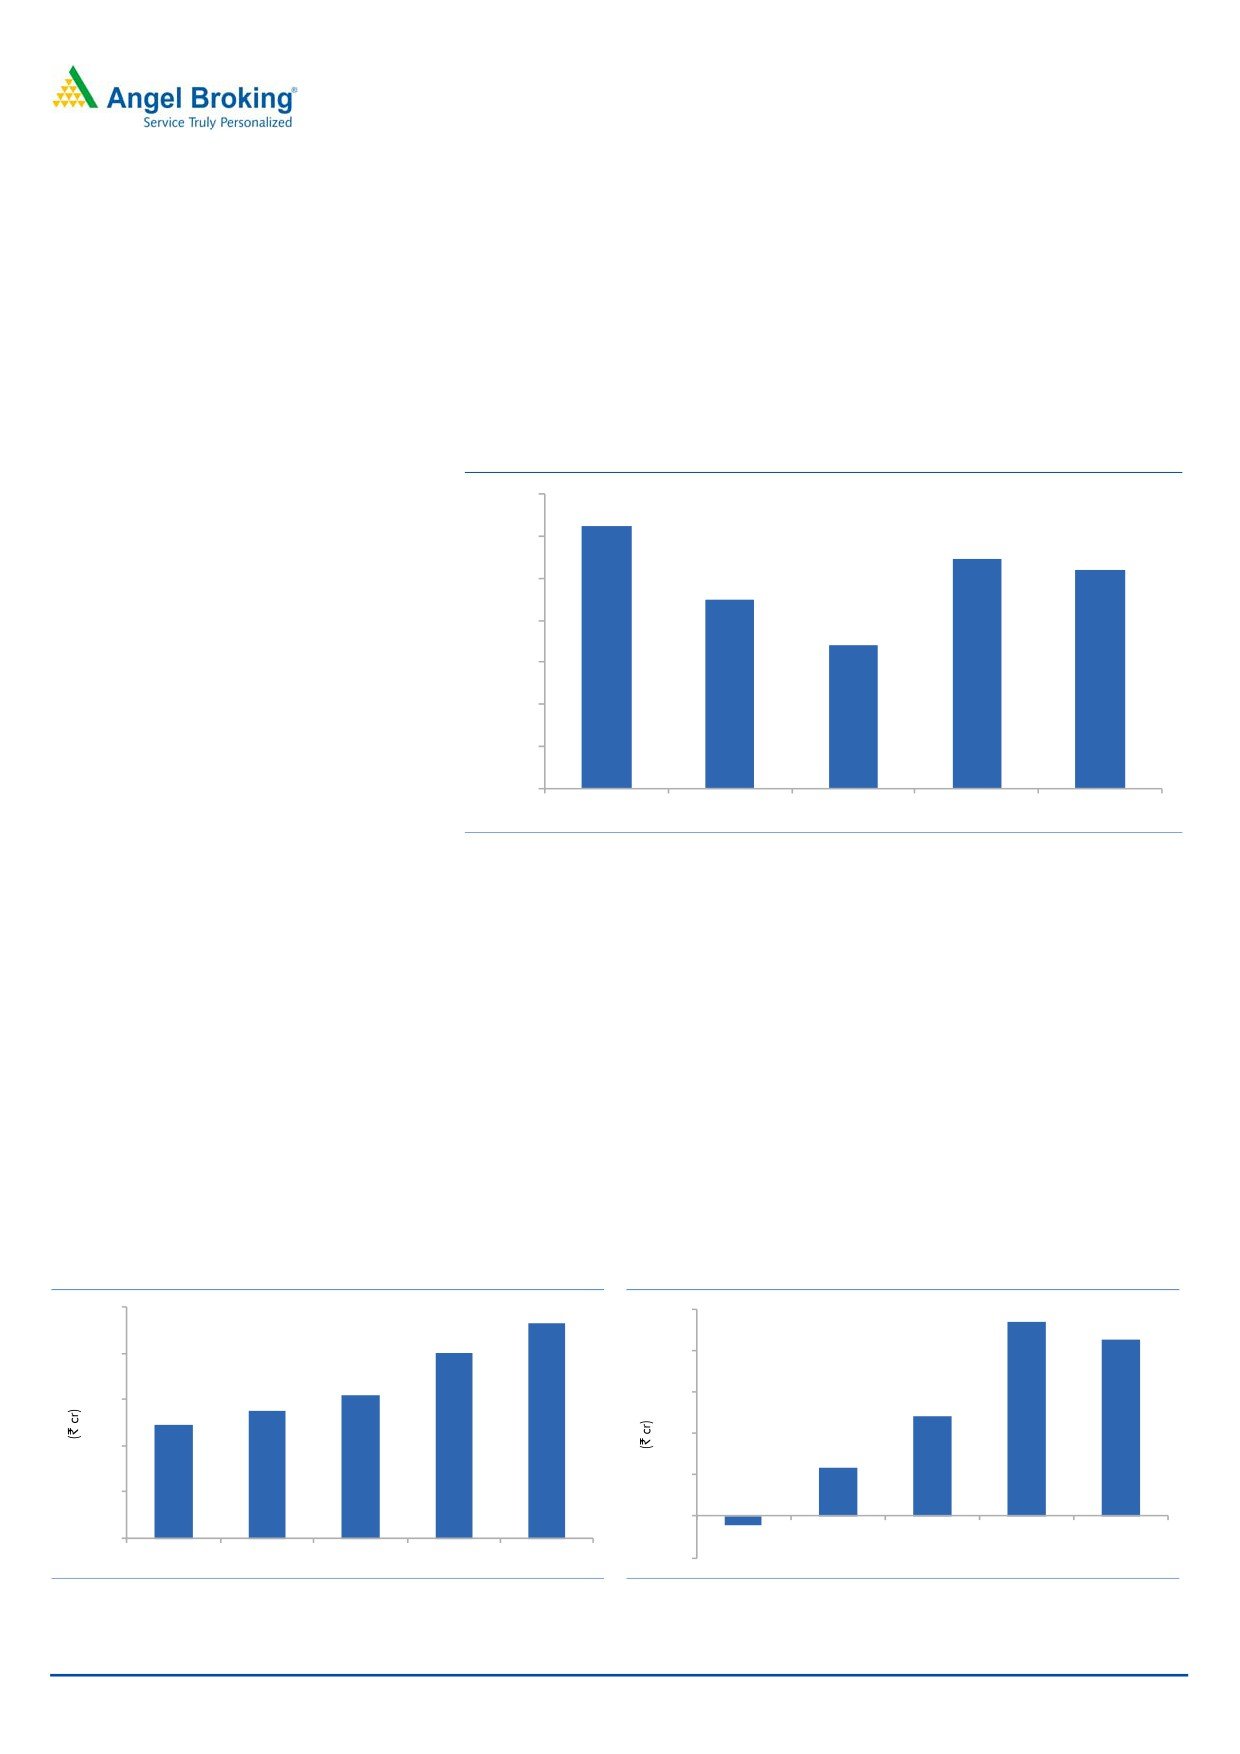
Track record of healthy financial performance
Radio City, with 19% CAGR in revenue, has outperformed its closest peer ENIL,
which reported 14% CAGR in revenues over FY2013-16. In profitability too, Radio
City, with 54% CAGR in PAT over FY2013-16, has performed much better than
ENIL (17% CAGR in PAT over FY2013-16).
Exhibit 9: Historical revenue trend
Exhibit 10: Historical PAT trend
250
232
50
47
43
201
200
40
154
138
30
150
24
122
20
100
12
10
50
(2)
0
FY2012
FY2013
FY2014
FY2015
FY2016
0
FY2012
FY2013
FY2014
FY2015
FY2016
-10
Source: Company, Angel Research
Source: Company, Angel Research
March 1, 2017
6
Music Broadcast | IPO Note
Outlook and Valuation
In terms of valuations, the pre-issue P/E works out to 25.2x its annualised
1HFY2017 earnings (at the upper end of the issue price band), which is lower
compared to its peers (ENIL is trading at 79.5x its annualised 1HFY17 earnings).
Also, MBL’s EV/sales multiple 6.2x, works out to be at discount to ENIL’s 8.2x. On
EV/EBITDA front too, Radio City’s issue appears to be attractive 18.7x v/s. ENIL’s
37.4x. Moreover, MBL has a better margin and ROE profile than its comparable
peers. Hence, considering the above positives coupled with attractive valuations,
we recommend a SUBSCRIBE on the issue
Key risks
Slowdown in Indian economy would impact overall ad spends
A slowdown in the economy could affect the spending from the clients, which in
turn would affect the company’s overall earnings.
Increase in content price
Inability to effectively source music content from third party music production
entities/associations can increase the input cost for the company, and hence, may
result in the dip in margins.
March 1, 2017
7
Music Broadcast | IPO Note
Income Statement
Y/E March (` cr)
FY2013
FY2014
FY2015
FY2016
1HFY17
Total operating income
138
154
201
232
137
% chg
13.0
11.7
30.3
15.7
-
Total Expenditure
104
112
139
154
91
License fees
8
8
9
17
9
Personnel
35
36
43
52
32
Others Expenses
62
67
86
85
50
EBITDA
34
42
62
79
46
% chg
30.3
25.1
47.1
26.1
(% of Net Sales)
24.5
27.5
31.0
33.8
33.2
Depreciation& Amortisation
20
15
16
17
9
EBIT
14
27
47
61.9
37
% chg
450.9
92.5
73.4
32.8
(% of Net Sales)
10.1
17.4
23.2
26.6
26.7
Interest & other Charges
5
6
6
19
8
Other Income
2
3
7
13
1
(% of PBT)
21.1
12.8
14.2
31.0
4.4
Extraordinary Items
-
-
-
14
-
Share in profit of Associates
-
-
-
-
-
Recurring PBT
12
24
47
43
30
% chg
109.4
93.5
(9.7)
Tax
-
-
-
-
-
PAT (reported)
12
24
47
43
30
% chg
109.4
93.5
(9.7)
(% of Net Sales)
8.4
15.8
23.4
18.3
21.7
Basic & Fully Diluted EPS (`)
2.6
5.4
10.4
9.4
6.6
% chg
109.4
93.5
(9.7)
March 1, 2017
8
Music Broadcast | IPO Note
Balance Sheet
Y/E March (` cr)
FY2013
FY2014
FY2015
FY2016
1HFY17
SOURCES OF FUNDS
Equity Share Capital
39
39
39
39
42
Reserves& Surplus
(53)
(28)
19
68
98
Shareholders Funds
(14)
11
58
107
140
Total Loans
118
103
285
256
250
Total Liabilities
104
114
342
363
390
APPLICATION OF FUNDS
Net Block
42
32
19
230
222
Capital Work-in-Progress
1
0
0
66
69
Investments
0
0
0
14
16
Current Assets
127
138
379
175
221
Inventories
-
-
-
-
-
Sundry Debtors
65
63
77
95
114
Cash
22
34
54
16
30
Loans & Advances
32
36
234
60
73
Other Assets
9
6
13
4
4
Current liabilities
66
56
55
122
137
Net Current Assets
61
82
323
53
83
Mis. Exp. not written off
-
-
-
-
-
Total Assets
104
114
342
363
390
March 1, 2017
9
Music Broadcast | IPO Note
Cash Flow Statement
Y/E March (` cr)
FY2013
FY2014
FY2015
FY2016
1HFY17
Profit before tax
12
24
47
56
30
Depreciation
20
15
16
17
9
Change in Working Capital
0
(8)
(5)
11
1
Interest / Dividend (Net)
5
6
6
19
8
Direct taxes paid
(2)
(0)
1
(11)
(3)
Others
(0)
(1)
1
(26)
(2)
Cash Flow from Operations
34
36
65
66
42
(Inc.)/ Dec. in Fixed Assets
(3)
(4)
(3)
(286)
(16)
(Inc.)/ Dec. in Investments
1
(1)
(198)
217
(6)
Cash Flow from Investing
(2)
(5)
(201)
(69)
(23)
Issue of Equity
0
0
0
0
0
Inc./(Dec.) in loans
2
0
200
83
0
Others
(29)
(26)
(40)
(111)
(14)
Cash Flow from Financing
(27)
(26)
160
(28)
(14)
Inc./(Dec.) in Cash
6
6
24
(31)
5
Opening Cash balances
8
13
19
43
13
Closing Cash balances
13
19
43
13
18
Key Ratios
Y/E March
FY2013
FY2014
FY2015
FY2016
Valuation Ratio (x)
P/E (on FDEPS)
129.1
61.7
31.9
35.3
P/CEPS
47.6
37.7
23.9
25.3
P/BV
-
141.2
26.0
14.0
EV/Sales
11.6
10.2
8.6
7.4
EV/EBITDA
47.1
37.0
27.8
22.0
EV / Total Assets
15.3
13.8
5.1
4.8
Per Share Data (`)
EPS (Basic)
2.6
5.4
10.4
9.4
EPS (fully diluted)
2.6
5.4
10.4
9.4
Cash EPS
7.0
8.8
13.9
13.1
Book Value
-
2.4
12.8
23.8
Returns (%)
ROCE
13.4
23.6
13.6
17.0
Angel ROIC (Pre-tax)
17.0
33.7
16.2
18.6
ROE
-
229.0
81.7
39.6
Turnover ratios (x)
Inventory / Sales (days)
-
-
-
-
Receivables (days)
171
149
140
149
Payables (days)
77
55
62
62
WC cycle (ex-cash) (days)
93
94
79
87
Note: Valuation ratios based on pre-issue outstanding shares and at upper end of the price band
March 1, 2017
10
Music Broadcast | IPO Note
Research Team Tel: 022 - 39357800
DISCLAIMER
Angel Broking Private Limited (hereinafter referred to as “Angel”) is a registered Member of National Stock Exchange of India Limited,
Bombay Stock Exchange Limited and Metropolitan Stock Exchange Limited. It is also registered as a Depository Participant with CDSL
and Portfolio Manager with SEBI. It also has registration with AMFI as a Mutual Fund Distributor. Angel Broking Private Limited is a
registered entity with SEBI for Research Analyst in terms of SEBI (Research Analyst) Regulations, 2014 vide registration number
INH000000164. Angel or its associates has not been debarred/ suspended by SEBI or any other regulatory authority for accessing
/dealing in securities Market. Angel or its associates/analyst has not received any compensation / managed or co-managed public
offering of securities of the company covered by Analyst during the past twelve months.
This document is solely for the personal information of the recipient, and must not be singularly used as the basis of any investment
decision. Nothing in this document should be construed as investment or financial advice. Each recipient of this document should
make such investigations as they deem necessary to arrive at an independent evaluation of an investment in the securities of the
companies referred to in this document (including the merits and risks involved), and should consult their own advisors to determine
the merits and risks of such an investment.
Reports based on technical and derivative analysis center on studying charts of a stock's price movement, outstanding positions and
trading volume, as opposed to focusing on a company's fundamentals and, as such, may not match with a report on a company's
fundamentals. Investors are advised to refer the Fundamental and Technical Research Reports available on our website to evaluate the
contrary view, if any.
The information in this document has been printed on the basis of publicly available information, internal data and other reliable
sources believed to be true, but we do not represent that it is accurate or complete and it should not be relied on as such, as this
document is for general guidance only. Angel Broking Pvt. Limited or any of its affiliates/ group companies shall not be in any way
responsible for any loss or damage that may arise to any person from any inadvertent error in the information contained in this report.
Angel Broking Pvt. Limited has not independently verified all the information contained within this document. Accordingly, we cannot
testify, nor make any representation or warranty, express or implied, to the accuracy, contents or data contained within this document.
While Angel Broking Pvt. Limited endeavors to update on a reasonable basis the information discussed in this material, there may be
regulatory, compliance, or other reasons that prevent us from doing so.
This document is being supplied to you solely for your information, and its contents, information or data may not be reproduced,
redistributed or passed on, directly or indirectly.
Neither Angel Broking Pvt. Limited, nor its directors, employees or affiliates shall be liable for any loss or damage that may arise from
or in connection with the use of this information.
March 1, 2017
11