Initiating Coverage | Media
July 20, 2017
Music Broadcast Limited
BUY
CMP
`368
Rhythm of profitable investment
Target Price
`434
Music Broadcast Limited (MBL) owns and operates FM radio stations under the
Investment Period
12 Months
brand names Radio City and Radio Mantra. MBL has 39 radio stations and
operates in 37 Indian cities. The company has a strong listenership base in cities
Stock Info
like Mumbai, Delhi and Bengaluru.
Long term barriers a positive for Industry: Radio Industry is protected by licenses
Sector
Media
for 15 years, thereby restricting the entry of new players. This would support the
Market Cap (` cr)
2,107
existing companies to strengthen their position and maintain a healthy growth
Beta
0.3
rate. The new radio stations are being added in the semi-urban areas which is
positive for the industry as this will increase the listener base. As radio
52 Week High / Low
420/329
broadcasting enjoys pricing advantage over other ways of broadcasting such as
Avg. Daily Volume
71,162
TV, print, etc. we believe that the industry is expected to see faster revenue growth
going ahead, benefitting all the players. KPMG-FICCI expects the Radio Industry
Face Value (`)
10
to grow at a CAGR of 16.9% over FY2015-20.
BSE Sensex
31,904
Higher listenership, wider reach to fetch premium advertisement rates: As on
Nifty
9,873
March 31, 2017, Radio City reached out to over 52.2mn listeners in 23 cities
(ENIL- 42.1mn). It grabbed the Number 1 position in Mumbai, Bengaluru and
Reuters Code
MUSI.NS
Delhi in terms of number of listeners. Leadership position in top markets, wider
Bloomberg Code
RADIOCIT@IN
reach (62% of population) and better quality of content has enabled MBL to
charge ~30% higher advertising rates than its peers and 12-15% higher charges
than its closest peer. Owing to this, Radio City enjoys healthy 33.6% operating
Shareholding Pattern (%)
margin, much better than ENIL’s ~22% margin in FY2017.
Leading the industry owing to better financials: MBL outperformed its closest peer
Promoters
71.4
with 18.4% CAGR in revenue over FY2013-17 (ENIL reported 13.2% CAGR in
MF / Banks / Indian Fls
7.5
revenue). On the profitability front too, MBL, with 32.3% CAGR in PAT over
FII / NRIs / OCBs
4.1
FY2013-17, has performed much better than ENIL (-5.2% CAGR in PAT).
Moreover, Radio City posted a six year CAGR of 12.1% v/s. 9.1% of industry
Indian Public / Others
17.0
owing to higher advertising volumes.
Capex for next 15 years done, paving the way for healthy free cash flow: Capex
for 39 licenses have been done for the next 15 years, hence no heavy incremental
Abs.(%)
3m 1yr 3yr
Capex requirement would emerge. Moreover, the maintenance Capex would be
Sensex
8.9
15.0
24.6
as low as `5-10cr. This would leave sufficient cash flow to distribute as dividend.
Outlook & Valuation: We expect MBL to report Revenue/EBITDA/PAT CAGR of
Music Broadcast Ltd
9.3
-
-
17%/19.2%/47.6% respectively over FY2017-19E driven by launches of new
stations, increase in advertising rates and improvement in utilization of radio
stations. MBL is trading at relatively lower valuations compared to its peer ENIL on
Price chart
FY19E, (MBL is trading at P/E-26.3, P/B-3.1, EV/EBITDA-14.2 as compared to
ENIL P/E-34.3,P/B-4.3,EV/EBITDA-18.6). Considering sustainable growth
380
opportunities over the next 5-7 years, most of the capex already through and
370
strong parentage, we initiate coverage on MBL with a BUY recommendation and
360
350
a Target Price of `434 (31x of FY19E EPS `14/-.)
340
Key financials
330
Y/E March (` cr)
FY2015
FY2016
FY2017
FY2018E
FY2019E
320
Net Sales
201
225
271
317
372
% chg
30
12
20
17
18
Net Profit
47
27
36
56
80
% chg
93
(42)
30
57
43
Source: Company, Angel Research
EBITDA (%)
31
35
34
34
35
EPS (Rs)
8
5
6
10
14
P/E (x)
45
77
59
38
26
P/BV (x)
36
10
4
3
3
RoE (%)
82
13
6
9
12
Jaikishan J Parmar
RoCE (%)
14
16
10
13
14
022 39357600, Extn: 6810
EV/EBITDA
37
29
20
18
14
Source: Company, Angel Research, Note: CMP as of July 20, 2017
Please refer to important disclosures at the end of this report
1
Music Broadcast ltd | Initiating Coverage
Story in Charts
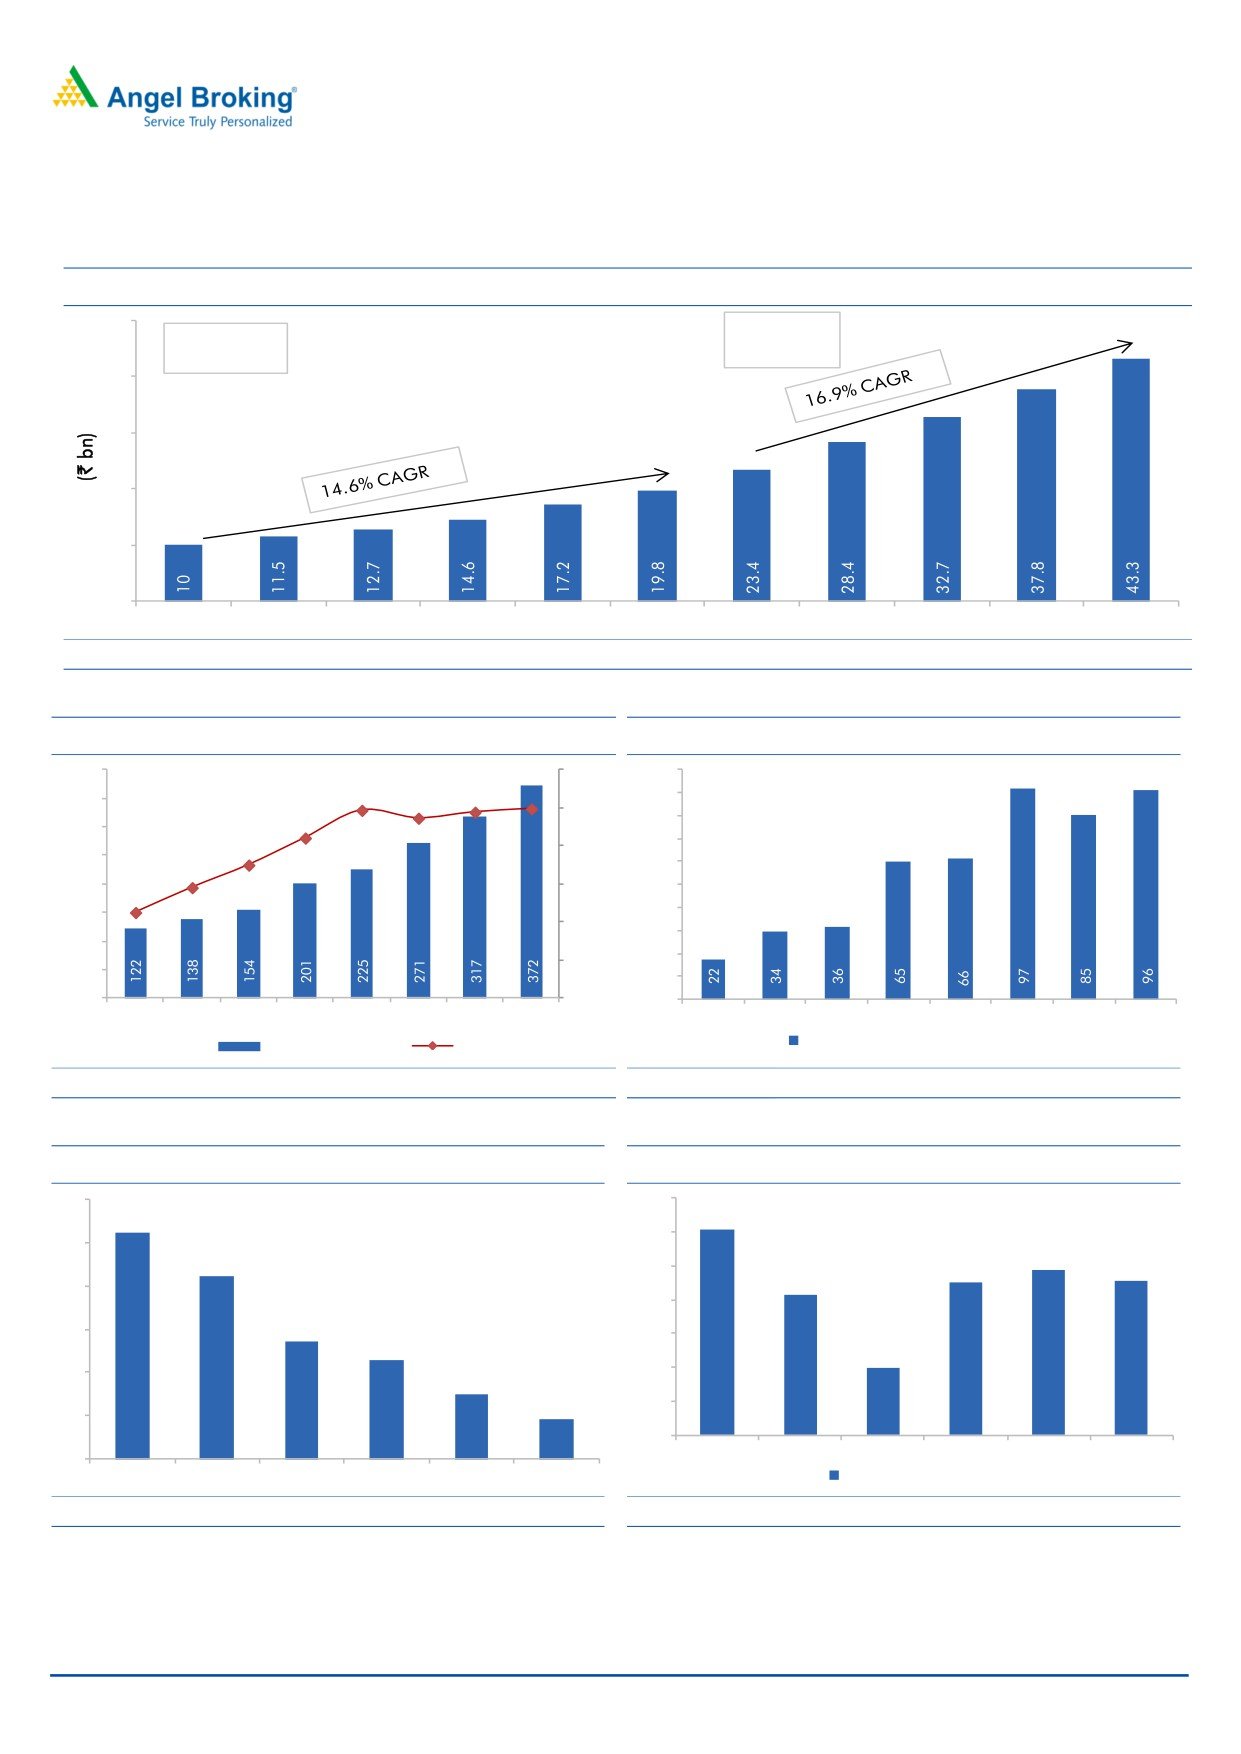
Exhibit 1: Radio Industry’s Historical & Projected trend
50
Phase III
Phase II
302 towns
86 towns
40
30
20
10
0
2010
2011
2012
2013
2014
2015
2016
2017
2018
2019
2020
Source: Company, Angel Research, KPMG-FICCI Report
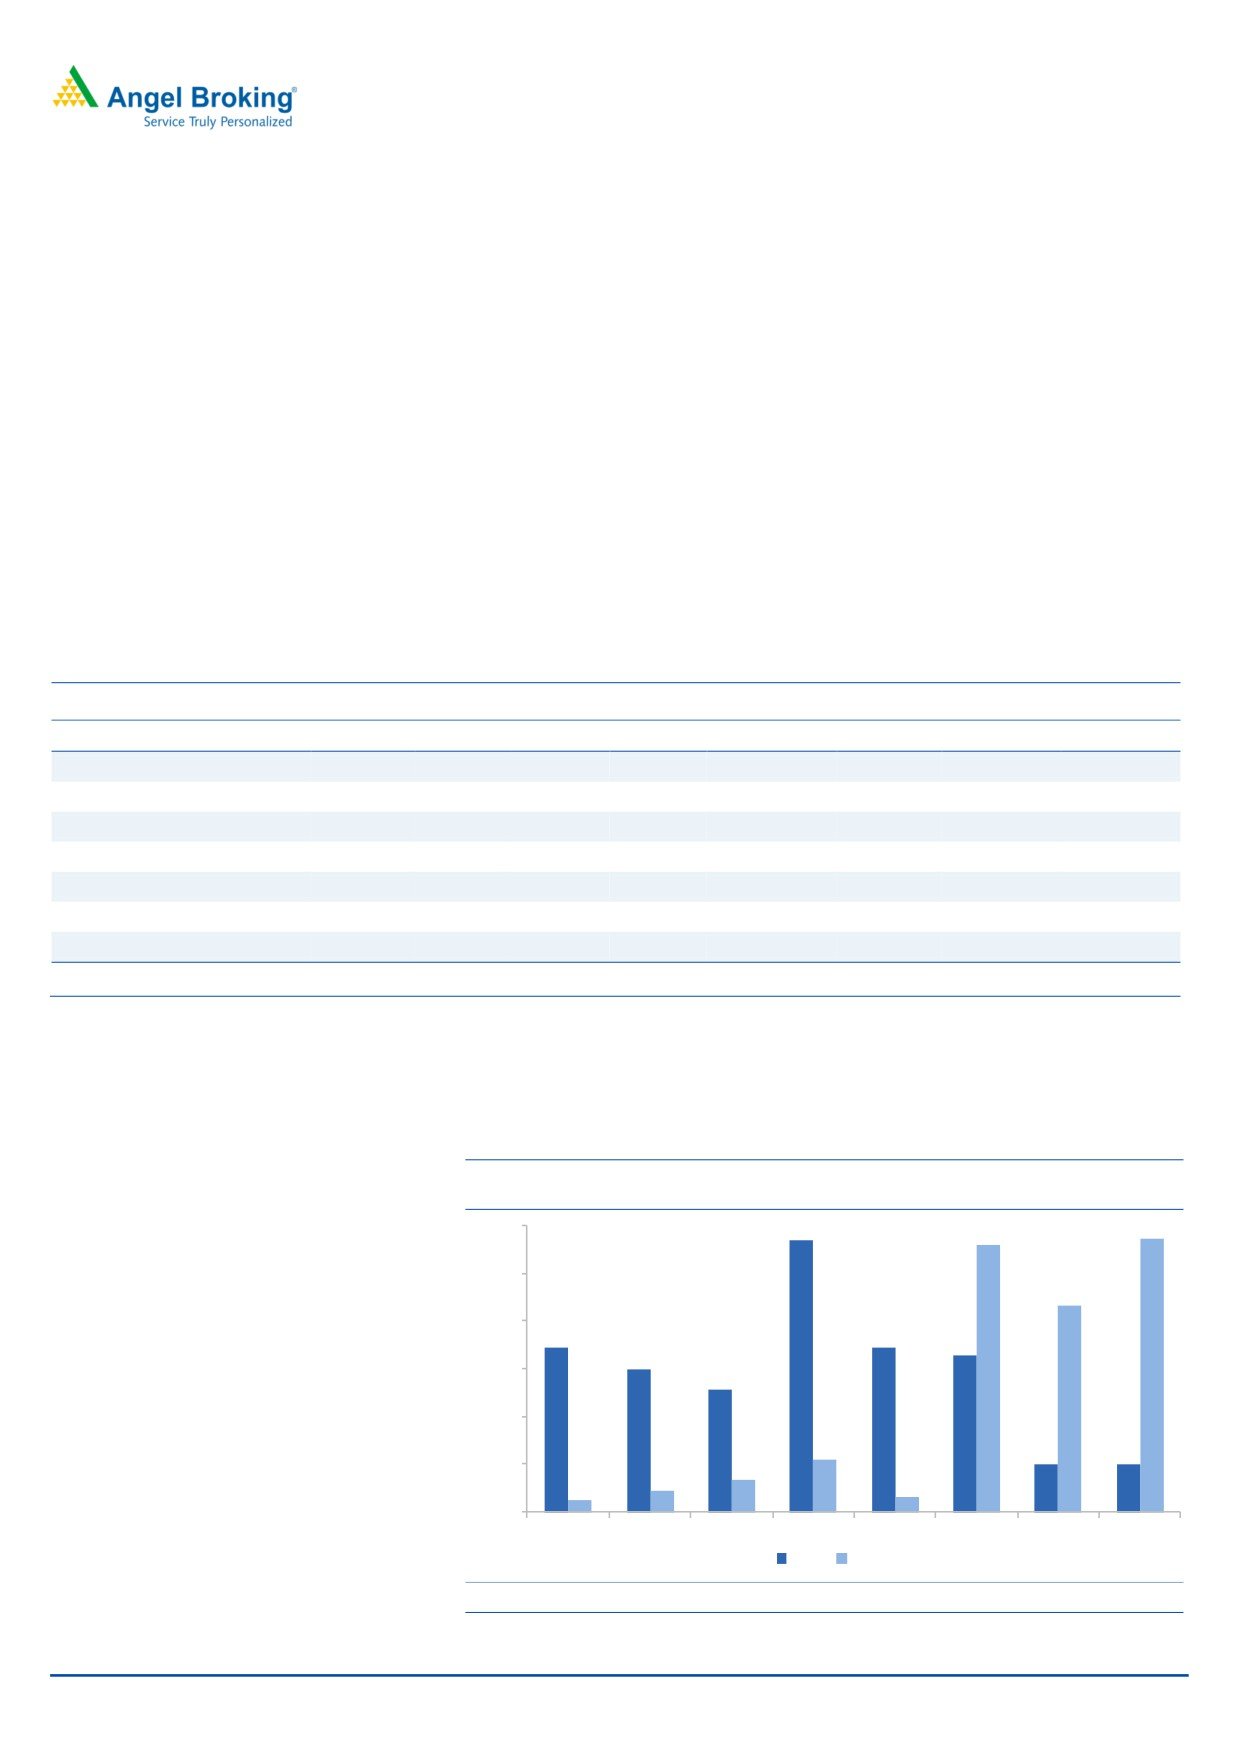
Exhibit 2: Revenue & EBITDA Margin Trend
Exhibit 3: Healthy Cash Flow From Operations
400
40%
105
34.9%
34.7%
34.4%
95
350
33.6%
35%
31.0%
85
300
27.5%
75
30%
250
24.5%
65
200
25%
55
21.3%
150
45
20%
35
100
25
15%
50
15
-
10%
5
FY12
FY13
FY14
FY15
FY16
FY17
FY18E FY19E
FY12
FY13
FY14
FY15
FY16
FY17
FY18E FY19E
Cash Flow fromOperation(` in cr)
Revenue (` in cr)
EBITDA (%)
Source: Company, Angel Research
Source: Company, Angel Research
Exhibit 4: Leadership Across Market
Exhibit 5: Advertising Volume
60
14%
52.5
12.10%
12%
50
In mn
9.70%
42.1
10%
9.00%
9.10%
8.30%
40
8%
30
27.2
6%
22.7
4.00%
4%
20
15.1
9.1
2%
10
0%
Radio City Radio Mirchi BIG FM
Red FM
Fever
Radio One
0
Radio City Radio Mirchi
BIG FM
Red FM
Fever
Radio One
6 year CAGR (FY11-17)
Source: Company, Angel Research, AZ Research , March 2017 (23 Markets
Source: Company, Angel Research
July 20, 2017
2
Music Broadcast ltd | Initiating Coverage
Investment Argument
Long term barriers a positive for Industry
Increase in
- listener base (smaller
The allotment of radio stations in Phase III and migration from Phase II to Phase III
towns), inventory post Phase III auctions
has been licensed for the period of the 15 years, thereby, restricting the entry of
and wallet share to drive Radio
new players over the next 15 years.
Industry’s growth
Entry barriers would support the existing radio companies to strengthen their
position and help them to grow at healthy rate given - (1) new launches of radio
stations, which would increase the listener base as well as the inventory;
(2)
Considering the new launches of radio stations (increase in listener base),
especially in smaller cities, we believe that MBL’s growth would be fuelled. The
combination of increased local penetration and affordable pricing v/s. other
sources of media & entertainment coupled with an increase in the wallet share
Radio Industry is estimated
would augur well for the industry;
(3) Radio’s contribution to the total
to grow at a CAGR 16.9%
advertisement industry increased to 4.2% in CY2015 from 3.5% in CY2005, which
over FY2015-20 - KPMG-FICCI Report
is far lesser than the developed countries (7-10%) and it is expected to increase at
a faster rate.
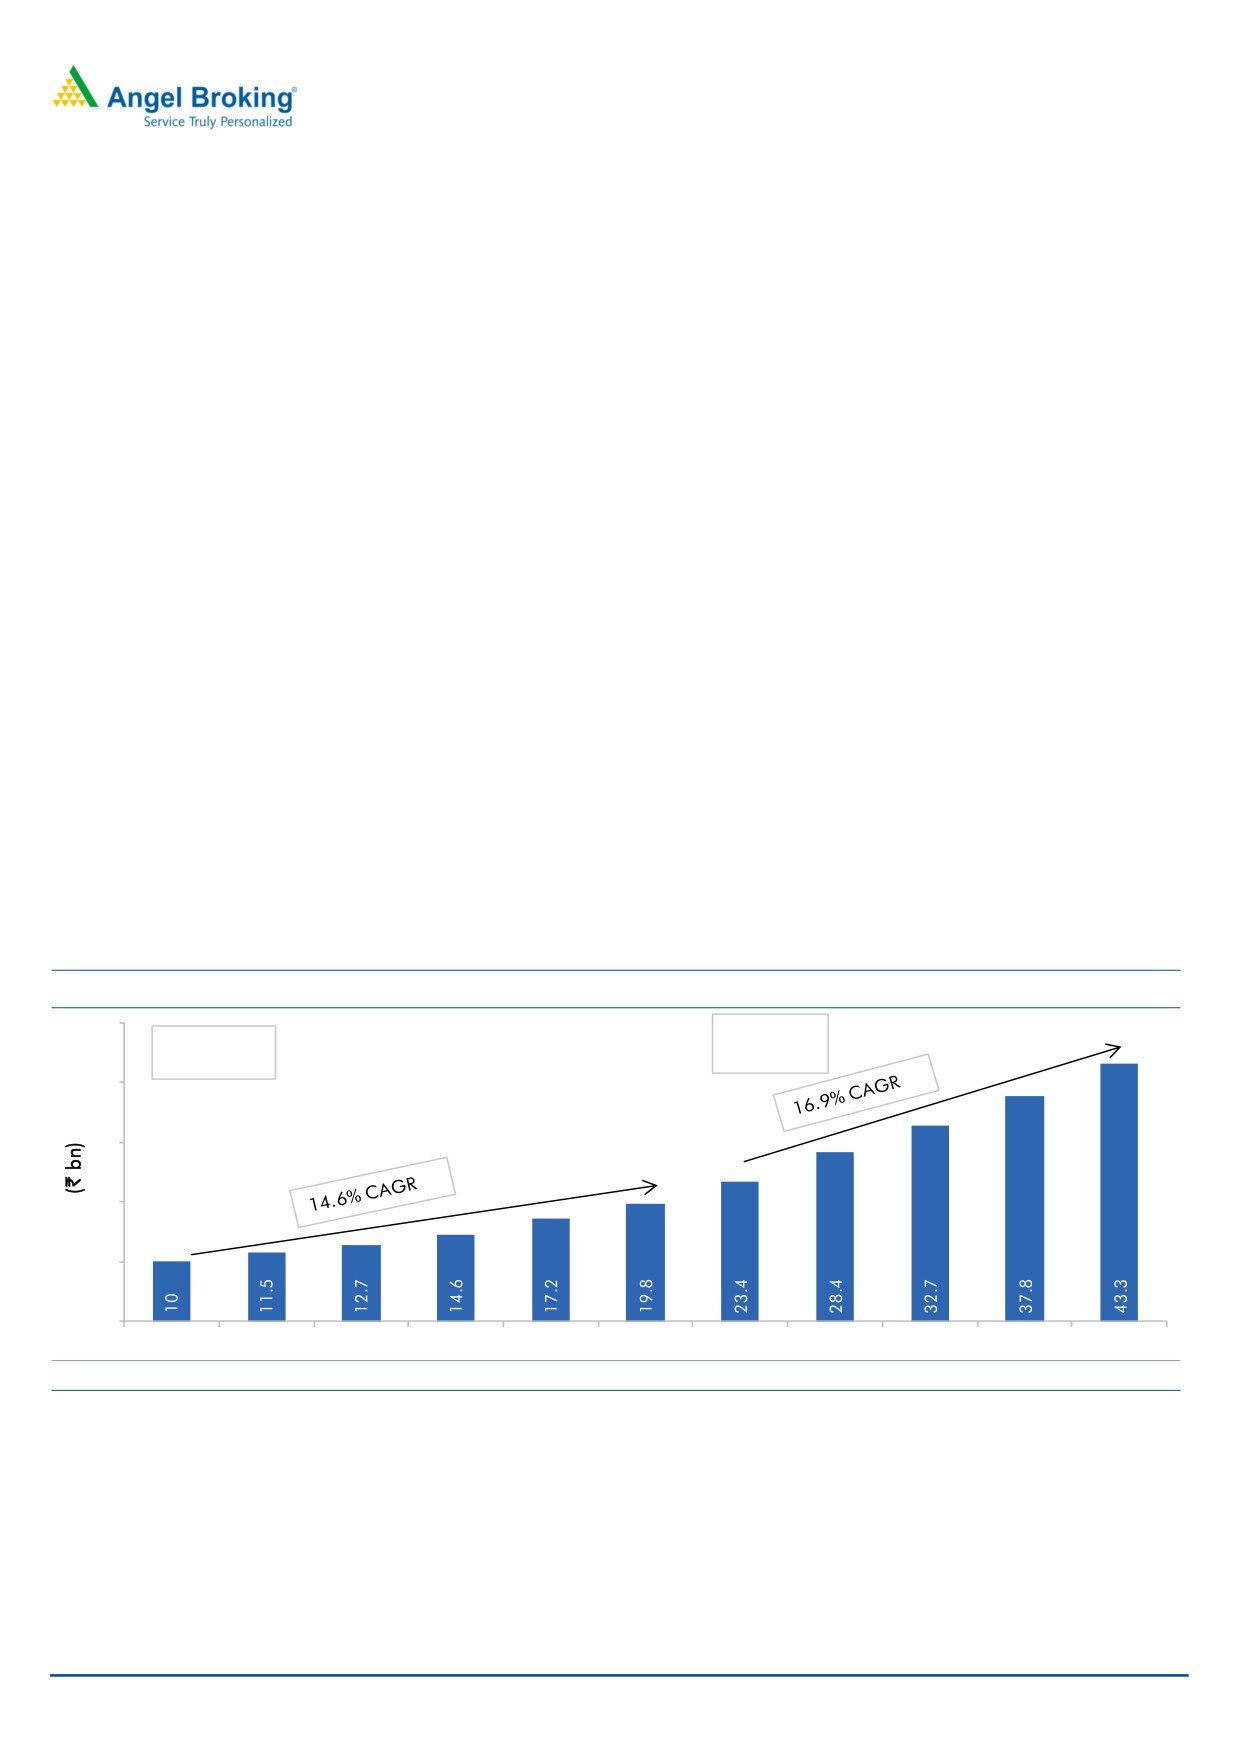
According to the KPMG-FICCI Report, the radio industry has grown at a steady
CAGR of 14.5% between the calendar year 2011 and 2015 and recorded an
estimated growth rate of 15.1% in calendar year 2015 to reach revenues of
`19.8billion. Going forward, the Radio Industry is expected to grow at a CAGR of
16.9% between the calendar year 2015 and 2020.
Exhibit 6: Radio Industry’s Historical & Projected Trend
50
Phase III
Phase II
302 towns
86 towns
40
30
20
10
0
2010
2011
2012
2013
2014
2015
2016
2017
2018
2019
2020
Source: Company, Angel Research, KPMG-FICCI Report
July 20, 2017
3
Music Broadcast ltd | Initiating Coverage
Higher listenerships, wider reach to fetch premium
advertisement rates
Leadership position in large markets
As on March 31, 2017, Radio City reached out to over 52.2mn listeners in 23
cities (ENIL- 42.1mn). It grabbed the Number 1 position in Mumbai, Bengaluru
and Delhi in terms of number of listeners. Leadership position in top markets,
wider reach (62% of population) and better quality of content has enabled MBL to
charge ~30% higher advertising rates than its peers and 12-15% higher charges
than its closest peer. Owing to this, Radio City enjoys healthy 33.6% operating
margin, much better than ENIL’s ~22% margin in FY2017.
MBL is the first and the oldest private FM radio player in India with over 15 years
of expertise in the Radio Industry. It has pan India presence spanning across
Southern, Northern, Western and Eastern geographies of India. The company is
also present in 12 of the 15 most populated cities in India and has been able to
reach out to over 42.5 million listeners and covers 62% of India’s population with
access to FM radio in 302 towns (post Phase III). Additionally, it also benefits from
the group (JAGARAN), as MBL can bring incremental advertisers on board quickly.
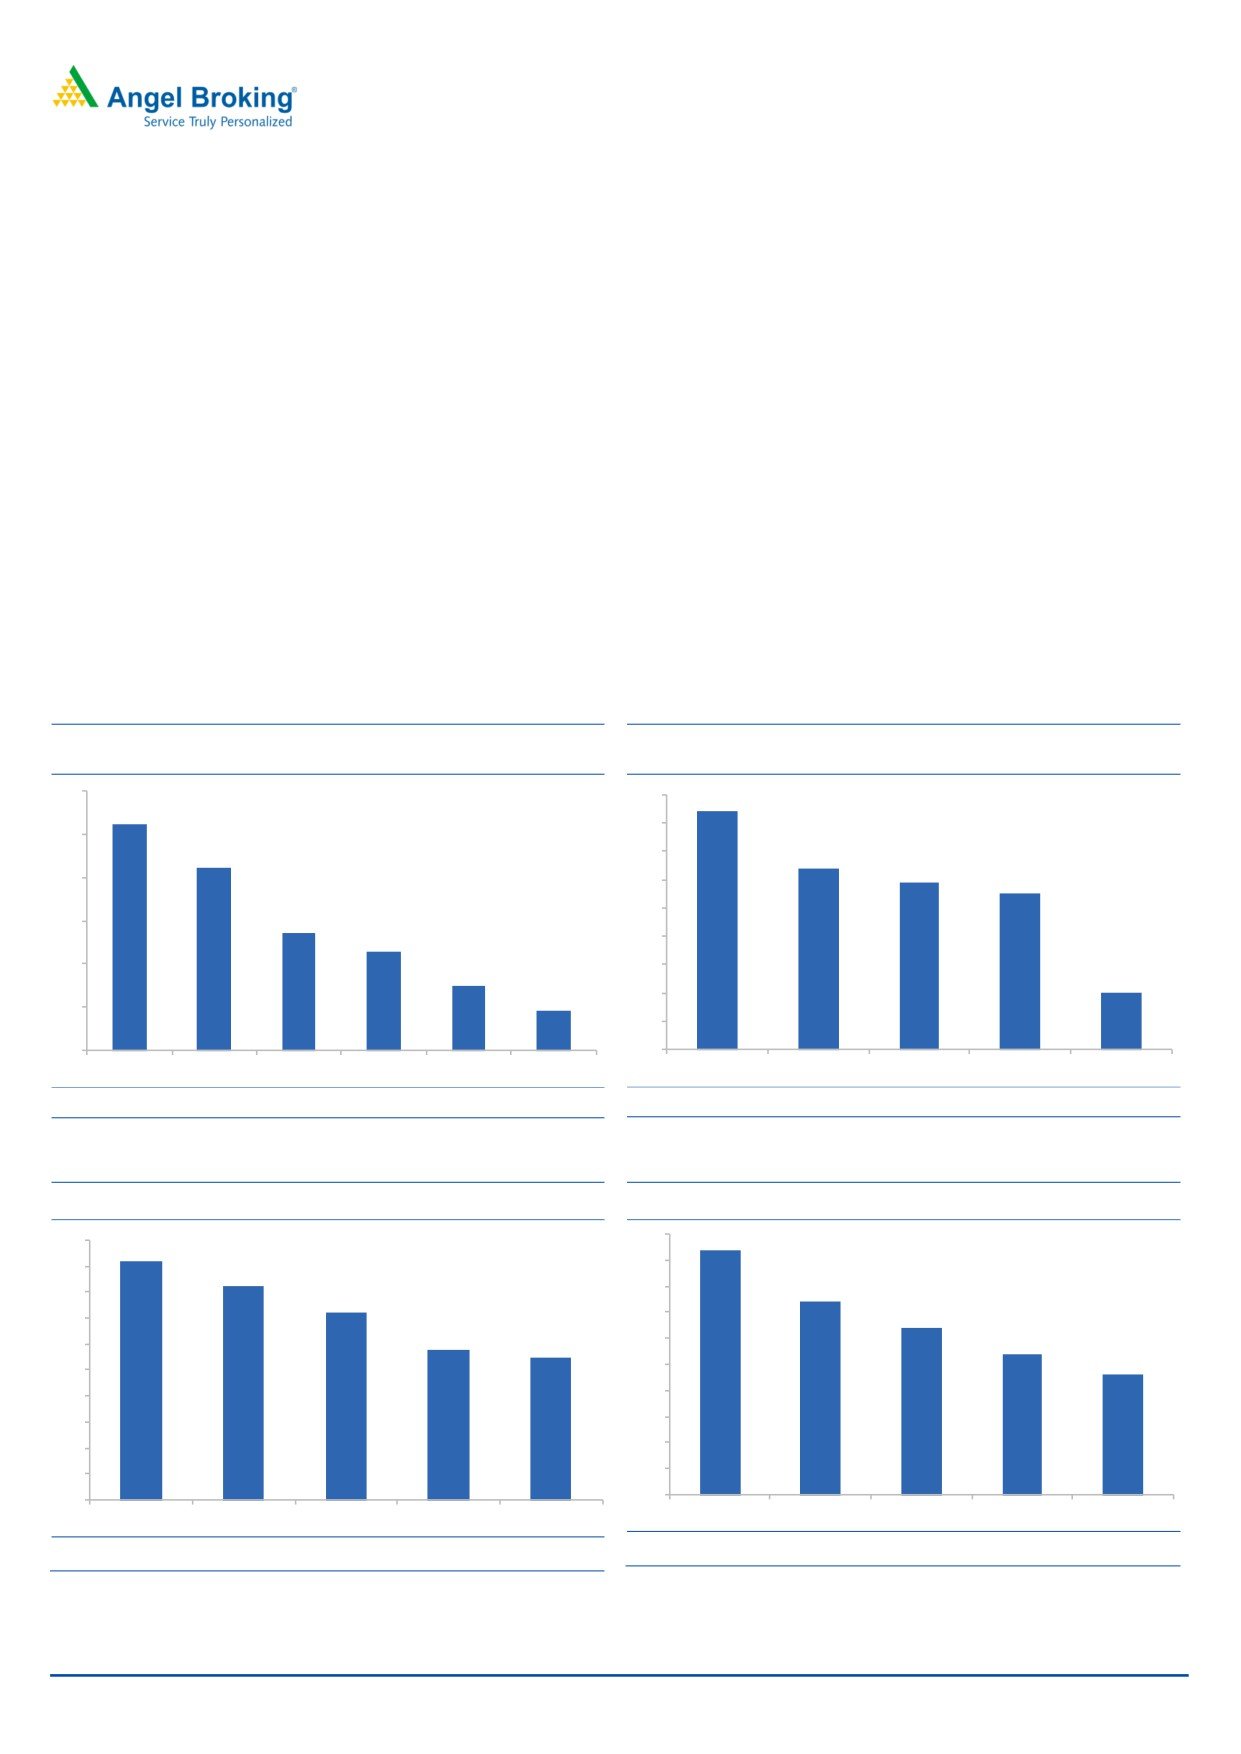
Exhibit 7: Listenership Across Market (In Mn)
Exhibit 8: Listenership in Mumbai (In Mn)
60
9
8.4
52.5
8
50
42.1
7
6.4
5.9
40
6
5.5
5
30
27.2
22.7
4
20
15.1
3
2
9.1
2
10
1
0
0
Radio City Radio Mirchi
BIG FM
Red FM
Fever
Radio One
Radio City
BIG FM
Radio Mirchi
Fever
Radio One
Source: Company, Angel Research, AZ Research, March 2017 (23 Markets)
Source: Company, Angel Research, AZ Research,March 2017 (23 Markets)
Exhibit 9: Listenership in Delhi (In Mn)
Exhibit 10: Listenership in Bengaluru (In Mn)
10
5
4.7
9.2
9
4.5
8.2
4
3.7
8
7.2
3.5
3.2
7
5.8
5.5
3
2.7
6
2.3
2.5
5
4
2
1.5
3
2
1
0.5
1
0
0
Radio City
Radio Mirchi
Red FM
BIG FM
Fever
Radio City
BIG FM
Radio Mirchi
Fever
Radio One
Source: Company,Angel Research, AZ Research, March 2017(23 Markets)
Source: Company, Angel Research,AZ Research, March 2017 (23 Markets)
July 20, 2017
4
Music Broadcast ltd | Initiating Coverage
Capex for next 15 years done, paving the way for healthy free
cash flow
Net cash position & miniscule capex
Radio business requires minuscule maintenance CAPEX once the stations are
requirement would lead to higher
operational. MBL has done CAPEX of ~`340cr for buying 11 new stations and for
dividend distribution to equity holders
migrating from Phase II to Phase III. This CAPEX has been done for the next 15
years to run the radio business of 39 stations. We believe that here on the
maintenance capital requirement would be around `5-10cr. This would leave
sufficient cash flow with the company for distribution to equity share holders.
Since 2012, MBL has been consistently reporting increased positive cash flow from
operations. CFO/EBITDA ratio has always remained higher than 75%, which
displays the company’s ability of generating consistent cash flow. As major capex
is through, we believe that MBL would generate `90cr of free cash flow in FY19,
which is 4.4% of current market cap. We estimate FCF generation of `152cr over
the next 2 years (FY2018E & FY2019E)
Exhibit 11: Healthy Cash Flow trend
FY12
FY13
FY14
FY15
FY16
FY17
FY18E
FY19E
CFO
22.4
34.3
36.4
65.0
66.3
96.8
82.1
95.7
Capex
-14.6
-2.5
-3.8
-2.7
-339.8
-35.2
-20.0
-5.0
FCF
7.8
31.8
32.6
62.3
-273.5
61.5
62.1
90.7
EBITDA
26.0
33.9
42.4
62.3
78.1
91.3
109.0
129.7
PAT
-2.2
11.6
24.3
47.1
27.3
35.6
56.0
79.8
CFO/EBITDA
81%
101%
86%
104%
85%
106%
75%
74%
FCF/EBITDA
137%
109%
95%
109%
-520%
145%
94%
78%
Source: Company, Angel Research
MBL recently concluded IPO of `400cr, primarily to pay debt, leaving a net cash
position of `120cr by the end of FY2017. Considering healthy cash position and
stable free cash flow, MBL might scout for local/smaller radio firms in places like
Kolkata, Madhya Pradesh and Chhattisgarh after the three-year lock-in period
under Phase III of radio privatization expires on March 31, 2018.
Exhibit 12: MBL To Have ~`235cr Of Net Cash On Books By FY2019E
300
285
280
285
250
216
200
173
173
163
149
150
128
100
54
50
50
50
34
22
12
16
-
FY12
FY13
FY14
FY15
FY16
FY17
FY18E FY19E
Debt Cash
Source: Company, Angel Research
July 20, 2017
5
Music Broadcast ltd | Initiating Coverage
Financial Highlights
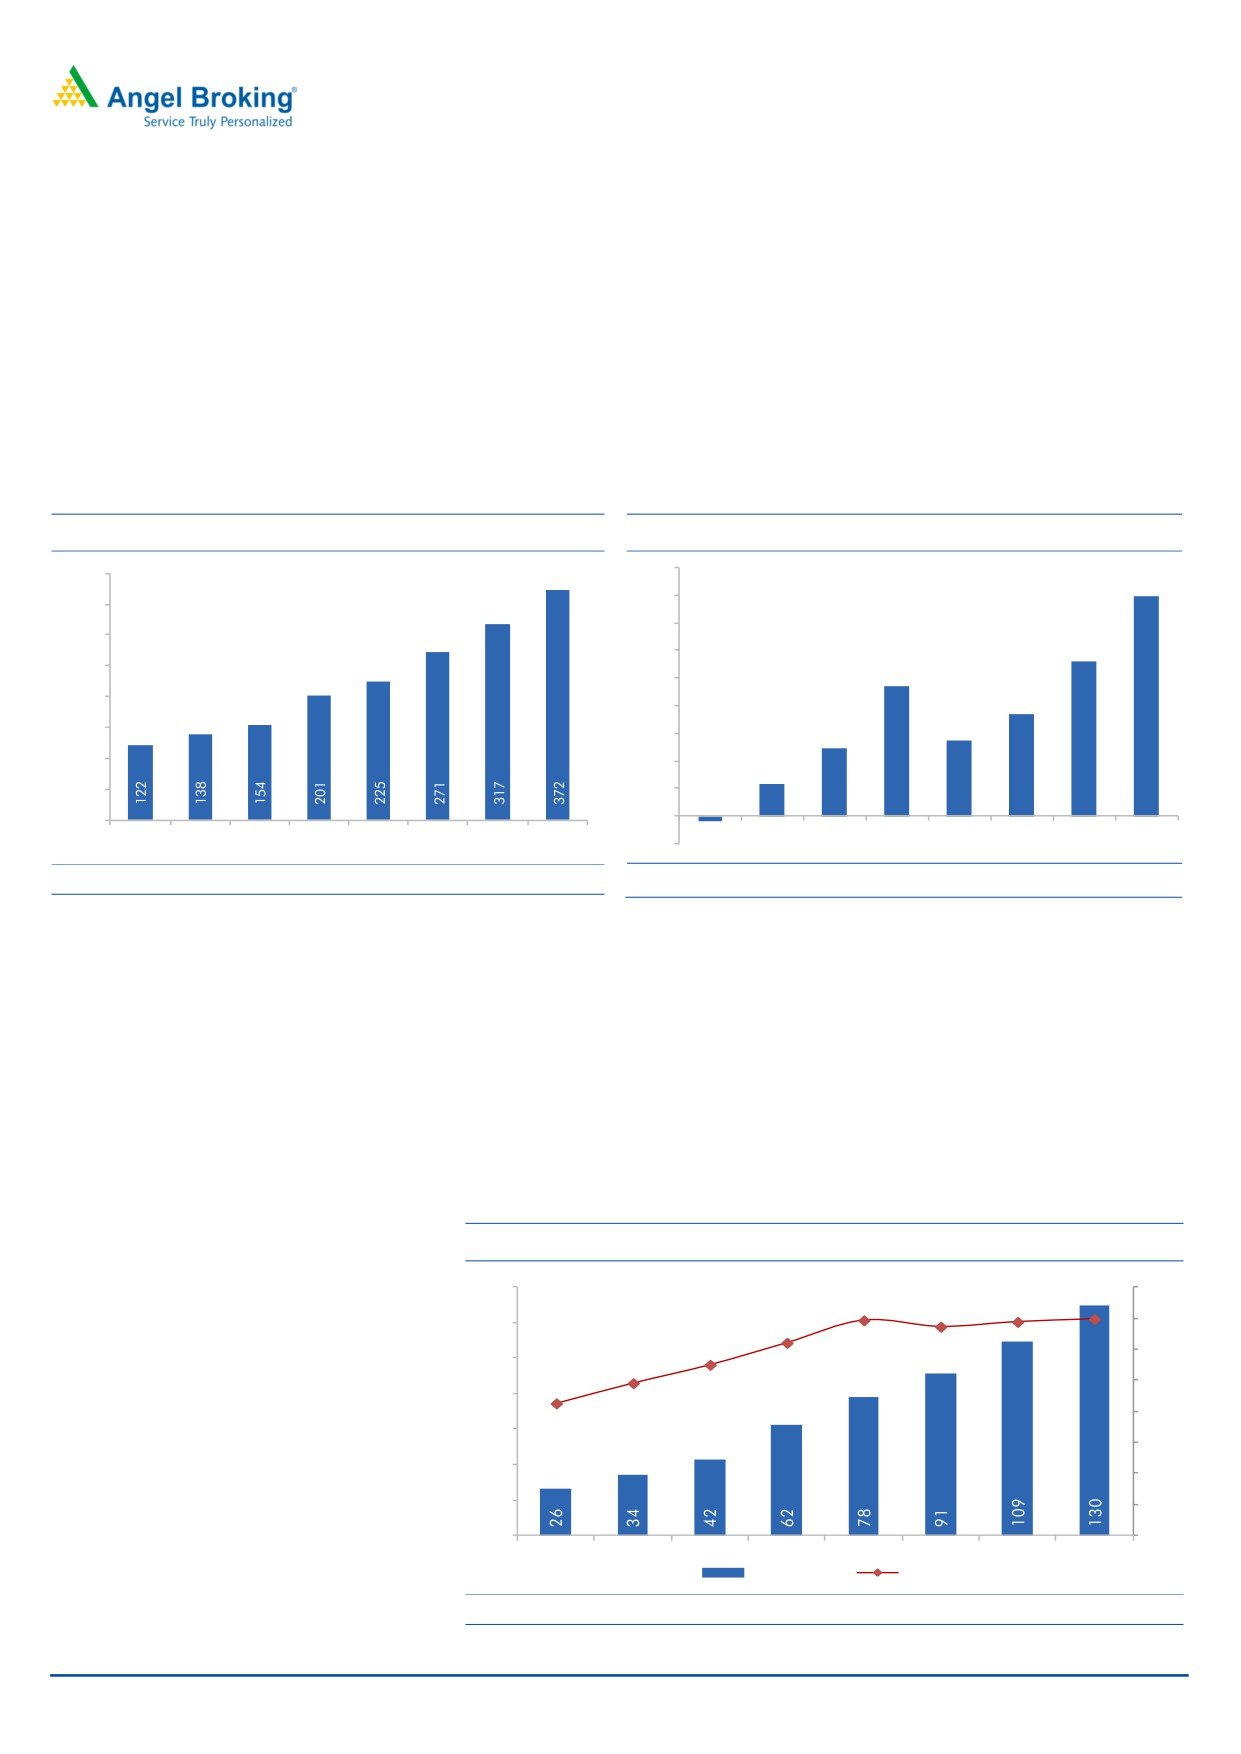
MBL has reported a healthy Revenue/EBITDA/PAT CAGR of 18.4%/28.1%/32.3%
respectively over FY2013-17. Advertising volume growth of 12.5% and price
growth of 5-6% has contributed to the increase in revenues. It has managed to
improve its EBITDA by ~909bps from 24.5% in FY2013 to 34.7% in FY2017, led
by efficiently managed stations and ability to charge premium rates compared to
peers in metro cities. PAT grew at a CAGR of 32.3% over FY2013-17, however,
margins declined amid rising in finance costs, as MBL had taken debt to fund news
stations.
Exhibit 13: Revenue Trend (` in cr)
Exhibit 14: PAT Trend (` in cr)
90
400
80
80
350
70
300
56
60
250
47
50
200
37
40
150
28
30
24
100
20
12
50
10
-2
-
-
FY12
FY13
FY14
FY15
FY16
FY17
FY18E FY19E
FY12
FY13
FY14
FY15
FY16
FY17
FY18E FY19E
-10
Source: Company, Angel Research
Source: Company, Angel Research
Historically, major costs for running a radio station are Staff Costs, Marketing,
Music Royalties, License fees, and other administration costs. These cost structures
continue to remain the same. Out of the above costs discussed, 75% of the cost
would not increase as a proportion to the increase in sales percentage. Hence, we
have seen EBITDA margin improvement trend in MBL. Moreover, we believe that
MBL would report a rise in margins over the next 3 to 4 years, as operating
leverage kicks in with stable costs and new stations allotted in Phase III have gone
live in 2HFY2017, which would add to the revenue, but cost for setting up a new
station has, however been done.
Exhibit 15: EBITDA Trend
140
40%
34.7%
34.4%
34.9%
33.6%
120
31.0%
35%
27.5%
30%
100
24.5%
21.3%
25%
80
20%
60
15%
40
10%
20
5%
0
0%
FY12
FY13
FY14
FY15
FY16
FY17
FY18E FY19E
EBITDA (`)
EBITDA (%)
Source: Company, Angel Research
July 20, 2017
6
Music Broadcast ltd | Initiating Coverage
Outlook & Valuation: We expect MBL to report Revenue/EBITDA/PAT CAGR of
17%/19.2%/47.6% respectively over FY2017-19E driven by launches of new
JPL Group Relationships, Experienced
stations, increase in advertising rates and improvement in utilization of radio
Team, Knowledge of Local Markets
stations. MBL is trading at relatively lower valuations compared to its peer ENIL on
& Credibility with Advertisers to support
FY19E, (MBL is trading at - P/E-26.2, P/B-3.1, EV/EBITDA-14.1 as compared to
growth
ENIL P/E-34.3, P/B-4.3, EV/EBITDA-18.6). Considering sustainable growth
opportunities over the next 5-7 years, most of the capex already through and
strong parentage, we initiate coverage on MBL with a BUY recommendation and a
Target Price of `434 (31x of FY19E EPS `14/-.)
Exhibit 16: Comparative Valuation vis-à-vis ENIL
P/E
P/B
EV/EBITDA
ROE (%)
FY17
FY18E
FY19E
FY17
FY18E
FY19E
FY17
FY18E
FY19E
FY17
FY18E
FY19E
ENIL
80.0
52.3
34.3
5.1
4.8
4.3
34.9
24.5
18.6
6.8
9.4
13.0
MBL
58.7
37.3
26.2
3.8
3.5
3.1
20.1
17.4
14.1
6.5
9.3
12.0
Source: Company, Angel Research, Bloomberg consensus of ENIL and CMP as on July 20, 2017
Key Risk
Slowdown in Indian economy would impact overall ad spends
A slowdown in the economy could affect the spending from the clients, which in
turn would affect the company’s overall earnings.
Increase in content price
Inability to effectively source music content from third party music production
entities/associations can increase the input costs for the company, and hence, may
result in the dip in margins.
Reduction in listenership numbers
Rising acceptance of data and continuous reduction in the cost of data could lead
to shift of listenership to digital platform/mobile applications (Hungama, Saavn,
Gaana) and options to download could risk the listenership in Metros and key
towns initially.
July 20, 2017
7
Music Broadcast ltd | Initiating Coverage
Company Background
Music Broadcast Limited (MBL) owns and operates FM radio stations under the
brand names Radio City and Radio Mantra. The company has 39 radio stations
and operates its radio stations in 37 Indian cities. Radio City is present in 12 out of
the top 15 cities in India by population. Radio City has been ranked Number One
in Mumbai, Bengaluru and Delhi in terms of number of listeners and has a total
number of 49.60mn listeners across all 23 cities (according to AZ Research). Music
Broadcast Limited operates as a subsidiary of Jagran Prakashan Limited. It also
operates 40 Web radio stations that offer Internet radio with live RJ hosted shows
through Planet Radio City in 8 languages. In addition, Music Broadcast Limited
operates 'Planet Radio City' mobile app that plays various stations such as 'Radio
City Freedom', 'Radio City Electronica', 'Radio City Metal', and 'Radio City Smaran'
in various languages on mobile and other smart devices.
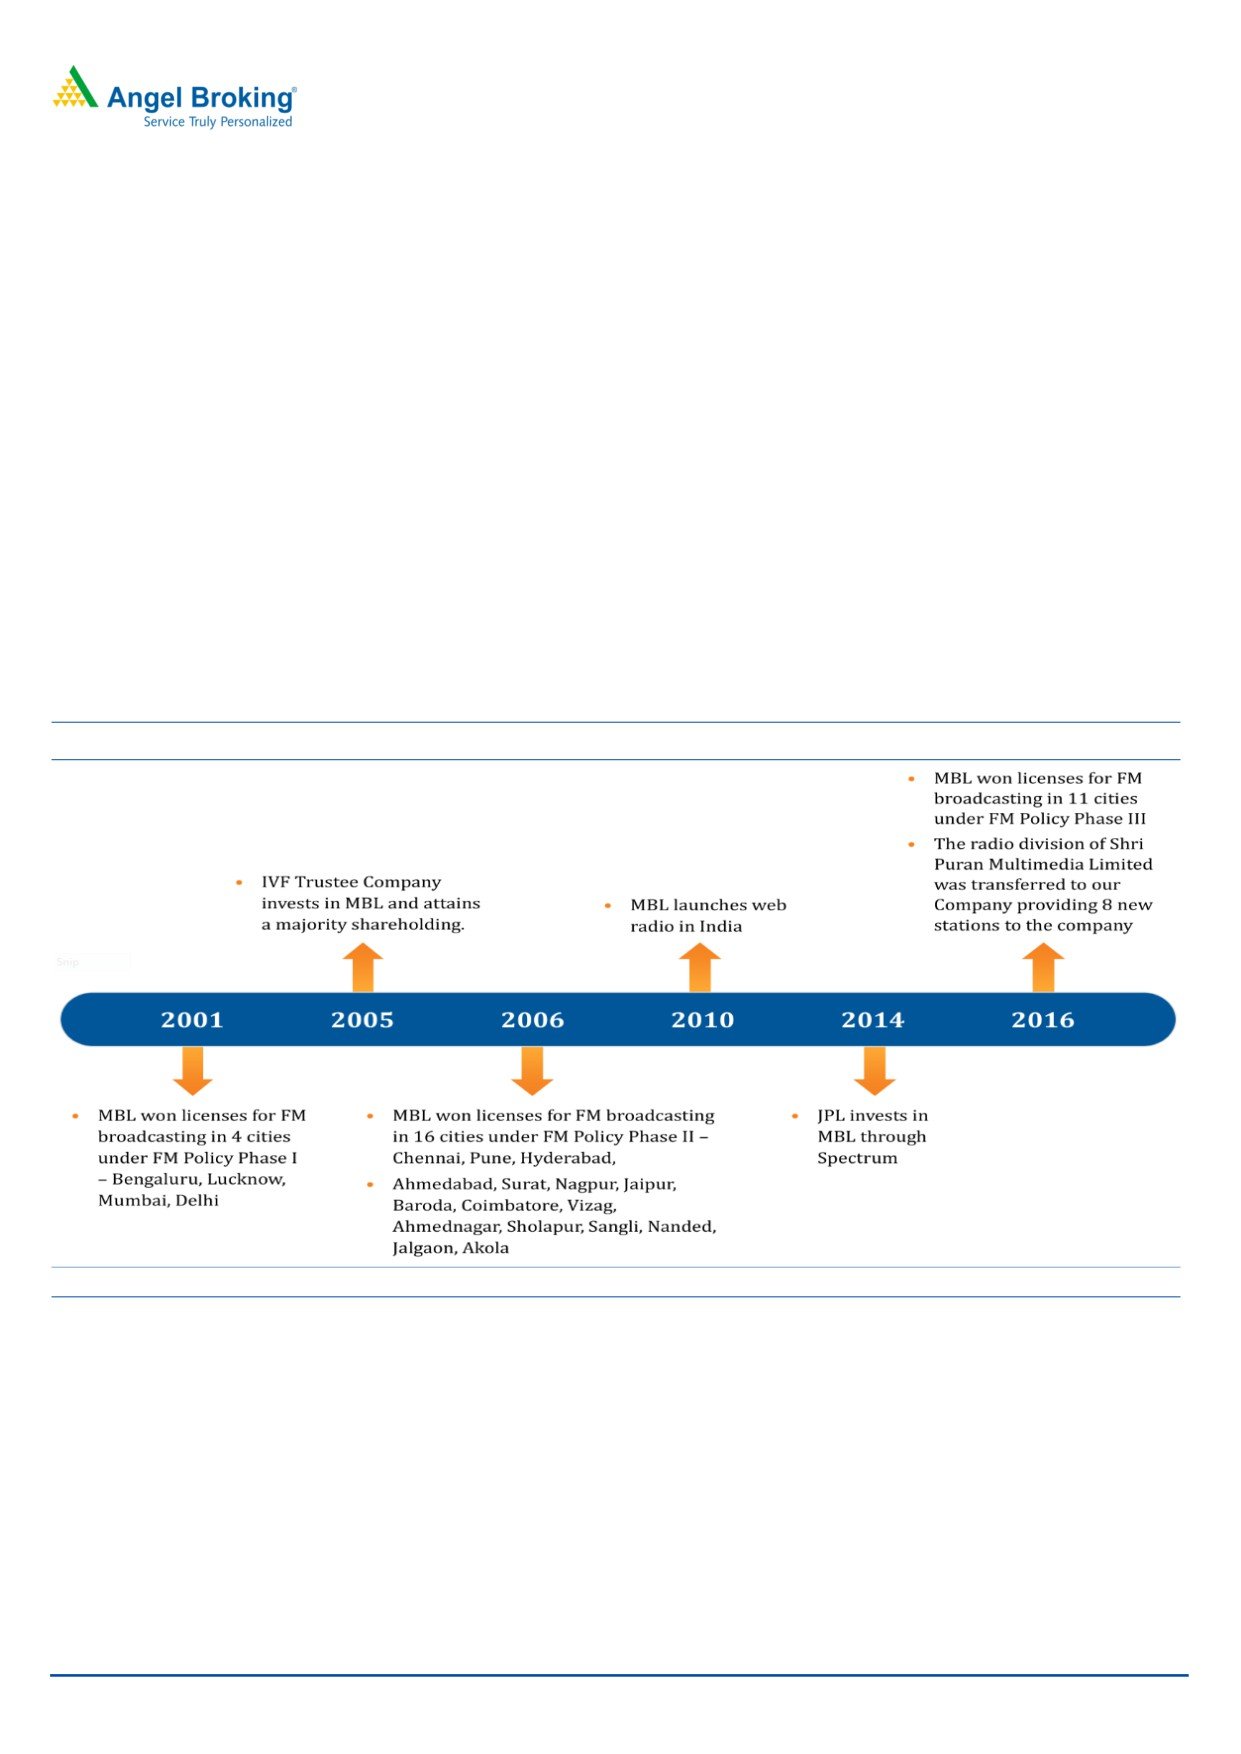
Exhibit 17: 15 years of Radio City - Growing along with the FM industry’s liberalization curve
Source: Company, Angel Research
July 20, 2017
8
Music Broadcast ltd | Initiating Coverage
Key management Personnel
APURVA PUROHIT, Director - BSc from Madras University and PGDMA from IIM
Bengaluru, she is the president of the Jagran group and handles the group’s
portfolio across several verticals including print, radio, digital and outdoor and
also accountable for any new businesses, in which the group may venture into in
the media space.
ABRAHAM THOMAS, CEO - Holds Bachelor’s degree in Pharmacy from the
University of Bombay and a Master’s diploma in Business Administration from the
Institute of Management, Development and Research, Pune. He is also on the
board of directors of One Network and Media Agnos. He has prior experience of
working at Garware Paints, Astro Broadcasting Corporation (BVI), Digital Radio
(Delhi) Broadcasting, MTV Networks India, SET India and Indian Express
Newspapers Bombay. He joined MBL on November 23, 2015.
PRASHANT DOMADIA, CFO - Holds Bachelor’s degree in Commerce from
University of Mumbai and is an associate member of Institute of Chartered
Accountants of India. He has prior experience of working with Viacom 18 Media,
Ratan S Mama & Co, Indian Hotel Company Limited and A. F. Ferguson & Co. He
joined MBL on March 13, 2008 and was appointed as CFO on November 23,
2015.
July 20, 2017
9
Music Broadcast ltd | Initiating Coverage
Income Statement
Y/E March (` cr)
FY2015
FY2016
FY2017P
FY2018E
FY2019E
Total operating income
201
225
271
317
372
% chg
30
12
20
17
18
Total Expenditure
139
147
180
208
242
License fees
9
17
19
22
26
Personnel
43
51
65
74
87
Others Expenses
86
79
96
111
129
EBITDA
62
78
91
109
130
% chg
47
25
17
19
19
(% of Net Sales)
31
35
34
34
35
Depreciation& Amortization
16
17
20
25
26
EBIT
47
61
72
84
104
% chg
73
32
17
17
24
(% of Net Sales)
23
27
26
26
28
Interest & other Charges
6
21
19
13
5
Other Income
7
15
4
13
20
(% of PBT)
14
27
8
16
17
Extraordinary Items
14
0
1
-
-
Share in profit of Associates
Recurring PBT
47
56
57
84
119
% chg
93
18
3
47
43
Tax
0
14
20
28
39
PAT (reported)
47
27
36
56
80
% chg
93
(42)
30
57
43
(% of Net Sales)
23
12
13
18
21
Basic & Fully Diluted EPS (Rs)
8
5
6
10
14
% chg
93
(42)
30
57
43
July 20, 2017
10
Music Broadcast ltd | Initiating Coverage
Balance Sheet Statement
Y/E March (` cr)
FY2015
FY2016
FY2017P FY2018E FY2019E
SOURCES OF FUNDS
Equity Share Capital
39
42
57
57
57
Reserves& Surplus
19
168
491
547
611
Shareholders’ Funds
58
210
548
604
668
Total Loans
288
236
168
55
55
Total Liabilities
345
446
717
659
723
APPLICATION OF FUNDS
Net Block
19
230
312
307
286
Capital Work-in-Progress
0
66
0
0
0
Investments
0
15
27
27
27
Current Assets
347
113
385
338
429
Inventories
0
0
0
0
0
Sundry Debtors
34
22
33
38
45
Cash
54
16
280
216
285
Loans & Advances
215
0
0
0
0
Other Assets
0
21
23
27
31
Current liabilities
52
44
45
50
57
Net Current Assets
294
69
340
288
373
Other Non Current Asset
32
66
38
38
38
Total Assets
345
446
717
659
723
July 20, 2017
11
Music Broadcast ltd | Initiating Coverage
Cash Flow Statement
Y/E March (` cr)
FY2015
FY2016
FY2017P FY2018E FY2019E
Profit before tax
47
56
57
84
119
Depreciation
16
17
20
25
26
Change in Working Capital
(5)
11
21
(12)
(15)
Interest / Dividend (Net)
6
19
19
13
5
Direct taxes paid
1
(11)
(20)
(28)
(39)
Others
1
(26)
-
-
-
Cash Flow from Operations
65
66
97
82
96
(Inc.)/ Dec. in Fixed Assets
(3)
(286)
(35)
(20)
(5)
(Inc.)/ Dec. in Investments
(198)
217
(12)
-
-
Cash Flow from Investing
(201)
(69)
(47)
(20)
(5)
Issue of Equity
-
-
303
-
-
Inc./(Dec.) in loans
200
83
(123)
-
-
Others
(40)
(111)
38
(127)
(21)
Cash Flow from Financing
160
(28)
218
(127)
(21)
Inc./(Dec.) in Cash
24
(31)
268
(64)
70
Opening Cash balances
19
43
13
280
216
Closing Cash balances
43
13
280
216
285
July 20, 2017
12
Music Broadcast ltd | Initiating Coverage
Key ratios
Y/E March
FY2015
FY2016
FY2017
FY2018E FY2019E
Valuation Ratio (x)
P/E (on FDEPS)
44.6
77.0
59.1
37.5
26.3
P/CEPS
33.5
47.7
38.0
25.9
19.9
P/BV
36.5
10.0
3.8
3.5
3.1
Dividend yield (%)
0.0
0.0
0.0
0.0
0.8
EV/Sales
11.6
9.9
6.8
6.0
4.9
EV/EBITDA
37.4
28.7
20.2
17.5
14.2
EV / Total Assets
6.7
5.0
2.6
2.9
2.5
Per Share Data (`)
EPS (Basic)
8.2
4.8
6.2
9.8
14.0
EPS (fully diluted)
8.2
4.8
6.2
9.8
14.0
Cash EPS
11.0
7.7
9.7
14.2
18.5
DPS
0.0
0.0
0.0
0.0
2.8
Book Value
10.1
36.8
96.1
105.9
117.1
Returns (%)
ROCE
13.6
16.0
10.0
12.8
14.5
Angel ROIC (Pre-tax)
16.0
17.5
17.5
20.1
25.3
ROE
81.7
13.0
6.5
9.3
12.0
Turnover ratios (x)
Inventory / Sales (days)
-
-
-
-
-
Receivables (days)
140
123
110
110
110
Payables (days)
62
36
44
44
44
Working capital cycle (ex-cash) (days)
79
87
66
66
66
July 20, 2017
13
Music Broadcast ltd | Initiating Coverage
Research Team Tel: 022 - 39357800
DISCLAIMER
Angel Broking Private Limited (hereinafter referred to as “Angel”) is a registered Member of National Stock Exchange of India Limited,
Bombay Stock Exchange Limited and Metropolitan Stock Exchange Limited. It is also registered as a Depository Participant with CDSL
and Portfolio Manager with SEBI. It also has registration with AMFI as a Mutual Fund Distributor. Angel Broking Private Limited is a
registered entity with SEBI for Research Analyst in terms of SEBI (Research Analyst) Regulations, 2014 vide registration number
INH000000164. Angel or its associates has not been debarred/ suspended by SEBI or any other regulatory authority for accessing
/dealing in securities Market. Angel or its associates/analyst has not received any compensation / managed or co-managed public
offering of securities of the company covered by Analyst during the past twelve months.
This document is solely for the personal information of the recipient, and must not be singularly used as the basis of any investment
decision. Nothing in this document should be construed as investment or financial advice. Each recipient of this document should
make such investigations as they deem necessary to arrive at an independent evaluation of an investment in the securities of the
companies referred to in this document (including the merits and risks involved), and should consult their own advisors to determine
the merits and risks of such an investment.
Reports based on technical and derivative analysis center on studying charts of a stock's price movement, outstanding positions and
trading volume, as opposed to focusing on a company's fundamentals and, as such, may not match with a report on a company's
fundamentals. Investors are advised to refer the Fundamental and Technical Research Reports available on our website to evaluate the
contrary view, if any.
The information in this document has been printed on the basis of publicly available information, internal data and other reliable
sources believed to be true, but we do not represent that it is accurate or complete and it should not be relied on as such, as this
document is for general guidance only. Angel Broking Pvt. Limited or any of its affiliates/ group companies shall not be in any way
responsible for any loss or damage that may arise to any person from any inadvertent error in the information contained in this report.
Angel Broking Pvt. Limited has not independently verified all the information contained within this document. Accordingly, we cannot
testify, nor make any representation or warranty, express or implied, to the accuracy, contents or data contained within this document.
While Angel Broking Pvt. Limited endeavors to update on a reasonable basis the information discussed in this material, there may be
regulatory, compliance, or other reasons that prevent us from doing so.
This document is being supplied to you solely for your information, and its contents, information or data may not be reproduced,
redistributed or passed on, directly or indirectly.
Neither Angel Broking Pvt. Limited, nor its directors, employees or affiliates shall be liable for any loss or damage that may arise from
or in connection with the use of this information.
Disclosure of Interest Statement
Music Broadcast Ltd
1. Financial interest of research analyst or Angel or his Associate or his relative
No
2. Ownership of 1% or more of the stock by research analyst or Angel or associates or relatives
No
3. Served as an officer, director or employee of the company covered under Research
No
4. Broking relationship with company covered under Research
No
Ratings (Based on expected returns
Buy (> 15%)
Accumulate (5% to 15%)
Neutral (-5 to 5%)
over 12 months investment period):
Reduce (-5% to -15%)
Sell (< -15)
July 20, 2017
14