2QFY2016 Result Update | Auto Ancillary
November 18, 2015
Motherson Sumi Systems
ACCUMULATE
CMP
`281
Performance Highlights
Target Price
`313
Y/E March - Consol. (` cr) 2QFY16 2QFY15
% chg (yoy) 1QFY16
% chg (qoq)
Investment Period
12 Months
Net Sales
9,198
8,017
14.7
9,385
(2.0)
EBITDA
957
729
31.3
838
14.2
EBITDA Margin (%)
10.4
9.1
130 bp
8.9
150 bp
Stock Info
Adjusted PAT
289
229
26.5
290
(0.3)
Sector
Auto Ancillary
Source: Company, Angel Research
Market Cap (` cr)
37,202
For 2QFY2016, Motherson Sumi Systems Ltd (MSS)’s results have come in ahead
Net Debt (` cr)
2,954
of estimates. The top-line grew strongly by 15% yoy led by robust growth in SMP
Beta
1.1
and pick up in the standalone business. Given the healthy revenue growth and
52 Week High / Low
396/217
soft commodity prices, the adj net profit grew at a faster pace of 27% yoy.
Avg. Daily Volume
268,937
Top-line growth remains strong: MSS maintained its double digit top-line growth
Face Value (`)
1
momentum, reporting sales of `9,198cr for 2QFY2016, implying a growth of
BSE Sensex
25,483
15%. The growth was led by SMP, whose revenues grew 18% yoy to `4,399cr,
Nifty
7,732
despite the depreciation in the Euro. Pick-up in order execution boosted growth.
(In Euro terms SMP grew 31% yoy). Standalone revenues grew 10% yoy to
Reuters Code
MOSS.BO
`1,393cr led by recovery in the passenger vehicle industry. However, SMR’s
Bloomberg Code
MSS@IN
revenue growth moderated to
3% (at
`2,424cr) impacted by the Euro
depreciation. But in Euro terms, SMR’s growth continued to remain strong
growing by 14%.
Shareholding Pattern (%)
Operating leverage along with soft commodity prices boost profitability: Given the
Promoters
65.6
robust double digit top-line growth and soft commodity prices, MSS’ operating
MF / Banks / Indian Fls
9.1
margins expanded 130bp yoy to reach 10.4%. Given the strong operating
FII / NRIs / OCBs
17.8
performance, MSS’ net profit grew strongly by 27% yoy to `289.3cr.
Indian Public / Others
7.5
Outlook and valuation: MSS continues to report improvement in its operating
performance, driven by its strategy of increasing the content per car, improvement
in utilization levels at the new plants and profitability improvement measures at
Abs. (%)
3m 1yr 3yr
SMP. However, the emission scandal at MSS largest customer, Volkswagen
Sensex
(8.4)
(9.5)
39.2
(Volkswagen currently accounts for ~40% of the topline) could have a near term
MSS
(17.6)
(4.3)
287.6
impact on the revenues as the brand takes a knock leading to loss of volumes.
The issue is likely to remain a key overhang on the stock, unless further clarity
emerges on the same. Nevertheless, we expect the company to sustain its strong
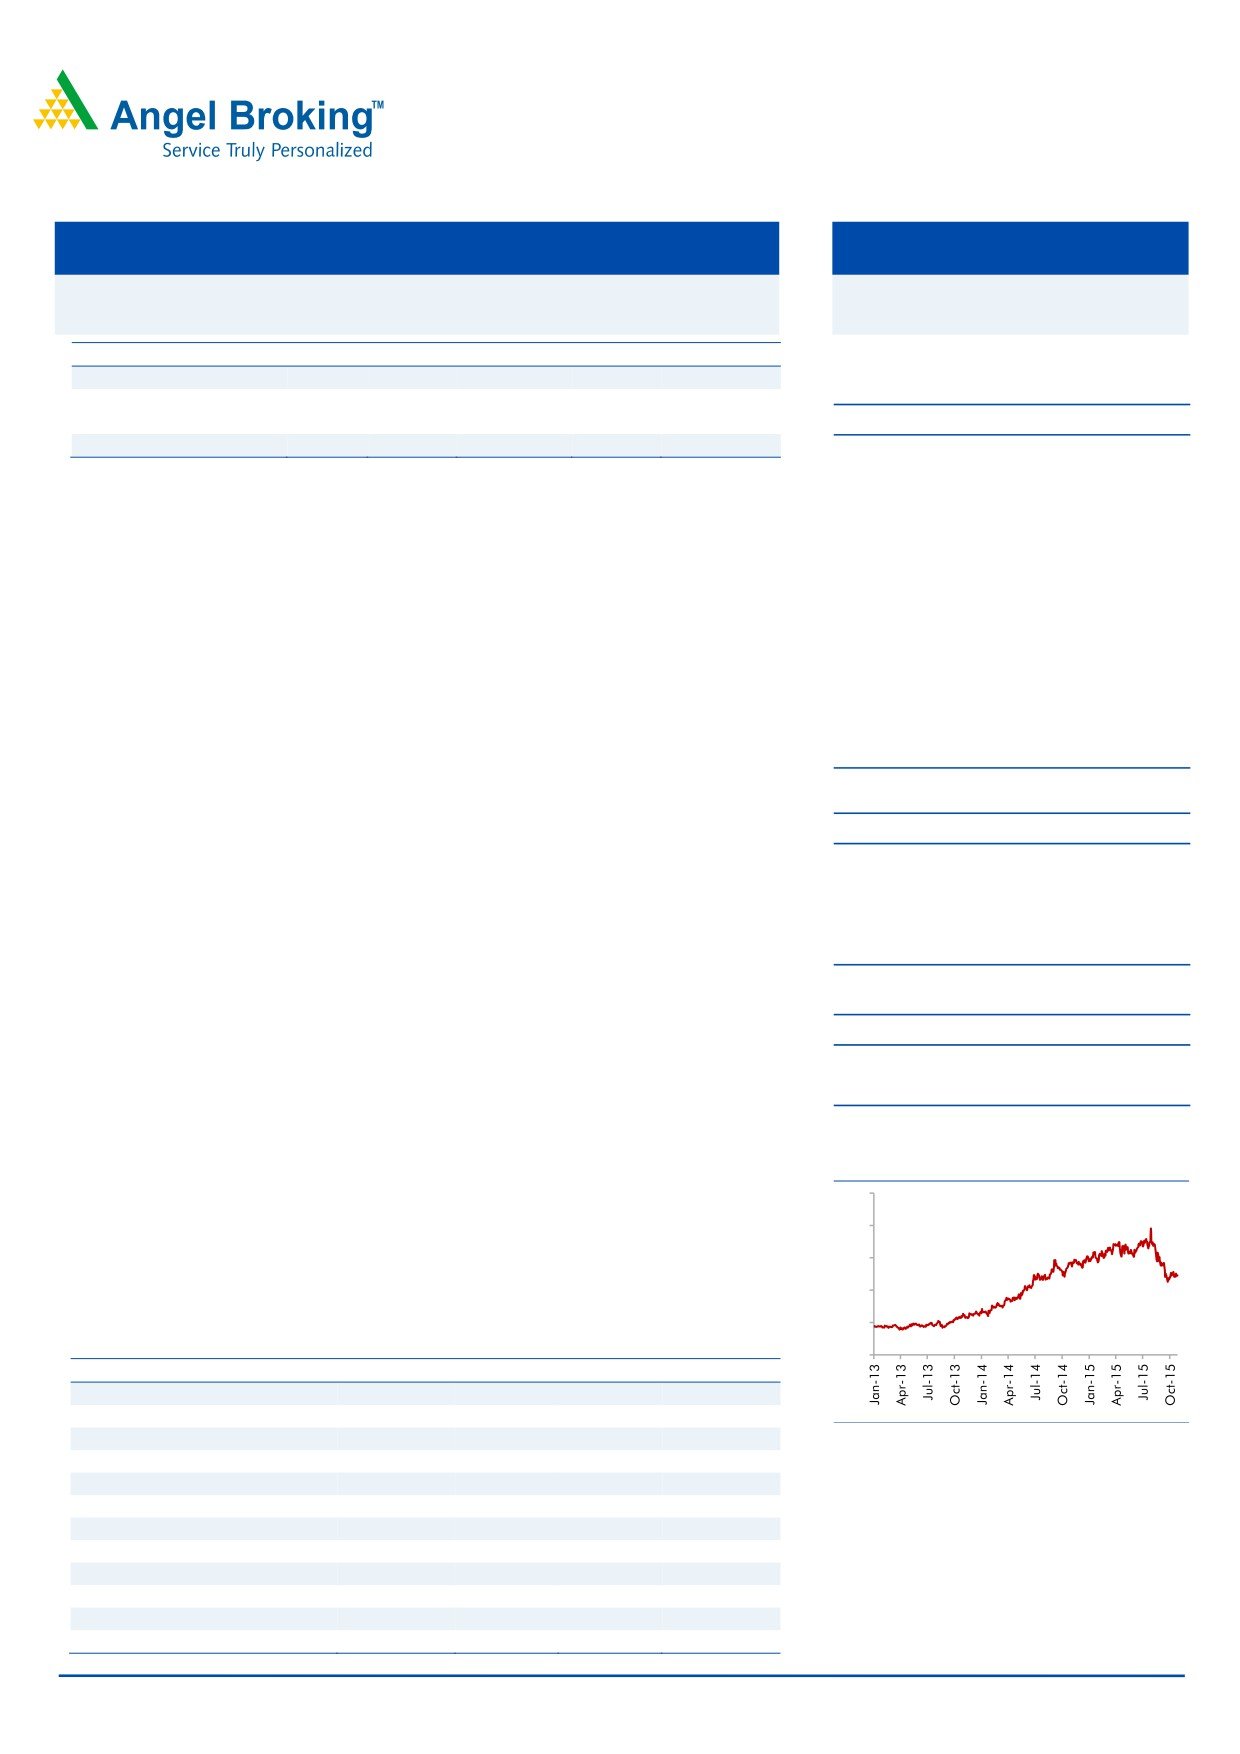
3-year price chart
performance in the long term through increased internal sourcing by subsidiaries
500
and improvement in utilization levels at the plants led by execution of new orders
400
(new order book currently stands at Euro 12.5 billion which gives a strong
outlook). We expect MSS to register a strong revenue and net profit CAGR of
300
~14% and ~27% respectively over FY2015-17E. Thus, we assign Accumulate
200
rating on the stock with a target price of `313 (based on 25x FY2017 earnings).
100
Key financials (Consolidated)
0
Y/E March (` cr)
FY2014
FY2015 FY2016E
FY2017E
Net Sales
30,428
34,585
39,343
45,100
% chg
20.2
13.7
13.8
14.6
Source: Company, Angel Research
Net Profit
765
1,027
1,333
1,654
% chg
72.1
34.3
29.7
24.1
EBITDA (%)
7.9
8.0
8.8
9.1
EPS (`)
8.7
11.6
10.1
12.5
P/E (x)
33.8
30.0
29.1
22.5
P/BV (x)
8.7
7.8
8.8
6.9
RoE (%)
29.2
32.7
35.5
34.6
RoCE (%)
20.5
20.5
23.5
24.8
Bharat Gianani
EV/Sales (x)
0.9
0.8
1.0
0.9
022-3935 7800 Ext: 6817
EV/EBITDA (x)
12.0
10.4
12.1
9.8
Source: Company, Angel Research
Please refer to important disclosures at the end of this report
1
Motherson Sumi Systems | 2QFY2016 Result Update
Exhibit 1: Quarterly financial performance (Consolidated)
Y/E March (` cr)
2QFY16
2QFY15
% chg (yoy)
1QFY16
% chg (qoq)
1HFY16
1HFY15
% chg (yoy)
Net Sales
9,198
8,017
14.7
9,385
(2.0)
18,582
16,408
13.3
Consumption of RM
5,478
4,846
13.0
5,759
(4.9)
11,236
10,082
11.5
(% of Sales)
59.6
60.5
61.4
60.5
61.4
Staff Costs
1,751
1,502
16.5
1,783
(1.8)
3,533
3,030
16.6
(% of Sales)
19.0
18.7
19.0
19.0
18.5
Other Expenses
1,012
940
7.7
1,005
0.7
2,017
1,840
9.6
(% of Sales)
11.0
11.7
10.7
10.9
11.2
Total Expenditure
8,240
7,288
13.1
8,546
(3.6)
16,787
14,951
12.3
Operating Profit
957
729
31.3
838
14.2
1,795
1,457
23.2
OPM (%)
10.4
9.1
8.9
9.7
8.9
Interest
65
96
(32.0)
68
(4.9)
133
158
(15.5)
Depreciation
270
237
13.9
235
15.0
505
456
10.6
Other Income
5
5
8.8
25
(78.5)
30
10
206.6
Foreign exchange difference
61
20
205.4
5
1061.1
66
67
(0.6)
PBT (excl. Extr. Items)
567
381
48.6
555
2.1
1,121
786
42.7
Extr. Income/(Expense)
2
124
25
27
124
PBT (incl. Extr. Items)
564
257
119.5
530
6.4
1,094
662
65.4
(% of Sales)
6.1
3.2
5.7
5.9
4.0
Provision for Taxation
182
109
67.4
164
10.9
345
261
32.4
(% of PBT)
32.2
42.2
30.9
31.6
39.4
PAT before minority interest (MI)
382
148
157.6
367
4.4
749
401
86.8
Minority interest
96
44
116.6
101
(5.1)
196
133
47.7
Share of profit/(loss) of associates
0
0
0
0
0
Reported net profit
287
104
174.7
266
8.0
553
268
106.1
Adjusted net profit
289
229
26.5
290
(0.3)
580
392
47.7
PATM (%)
3.1
2.9
3.1
3.1
2.4
Equity capital (cr)
132
88
88
132
88
Adjusted EPS (`)
2.2
2.6
3.3
4.4
4.4
Source: Company, Angel Research
Robust top-line growth continues despite currency impact: MSS maintained strong
double digit top-line growth, with the consolidated revenues growing strongly by
14.7% yoy to `9,198cr in 2QFY2016. The growth at key overseas subsidiaries viz
SMP and SMR was strong led by new client additions. They grew by 31% and 14%
in Euro terms, respectively. In INR terms the growth of SMP and SMR moderated to
18% and 3%, respectively, due to Euro devaluation. The standalone business
reported a healthy 10% growth led by recovery in passenger vehicle demand and
increasing content per vehicle. At the consolidated level, while India revenues grew
by 11% yoy, overseas revenues grew by 15% yoy, during the quarter.
November 18, 2015
2
Motherson Sumi Systems | 2QFY2016 Result Update
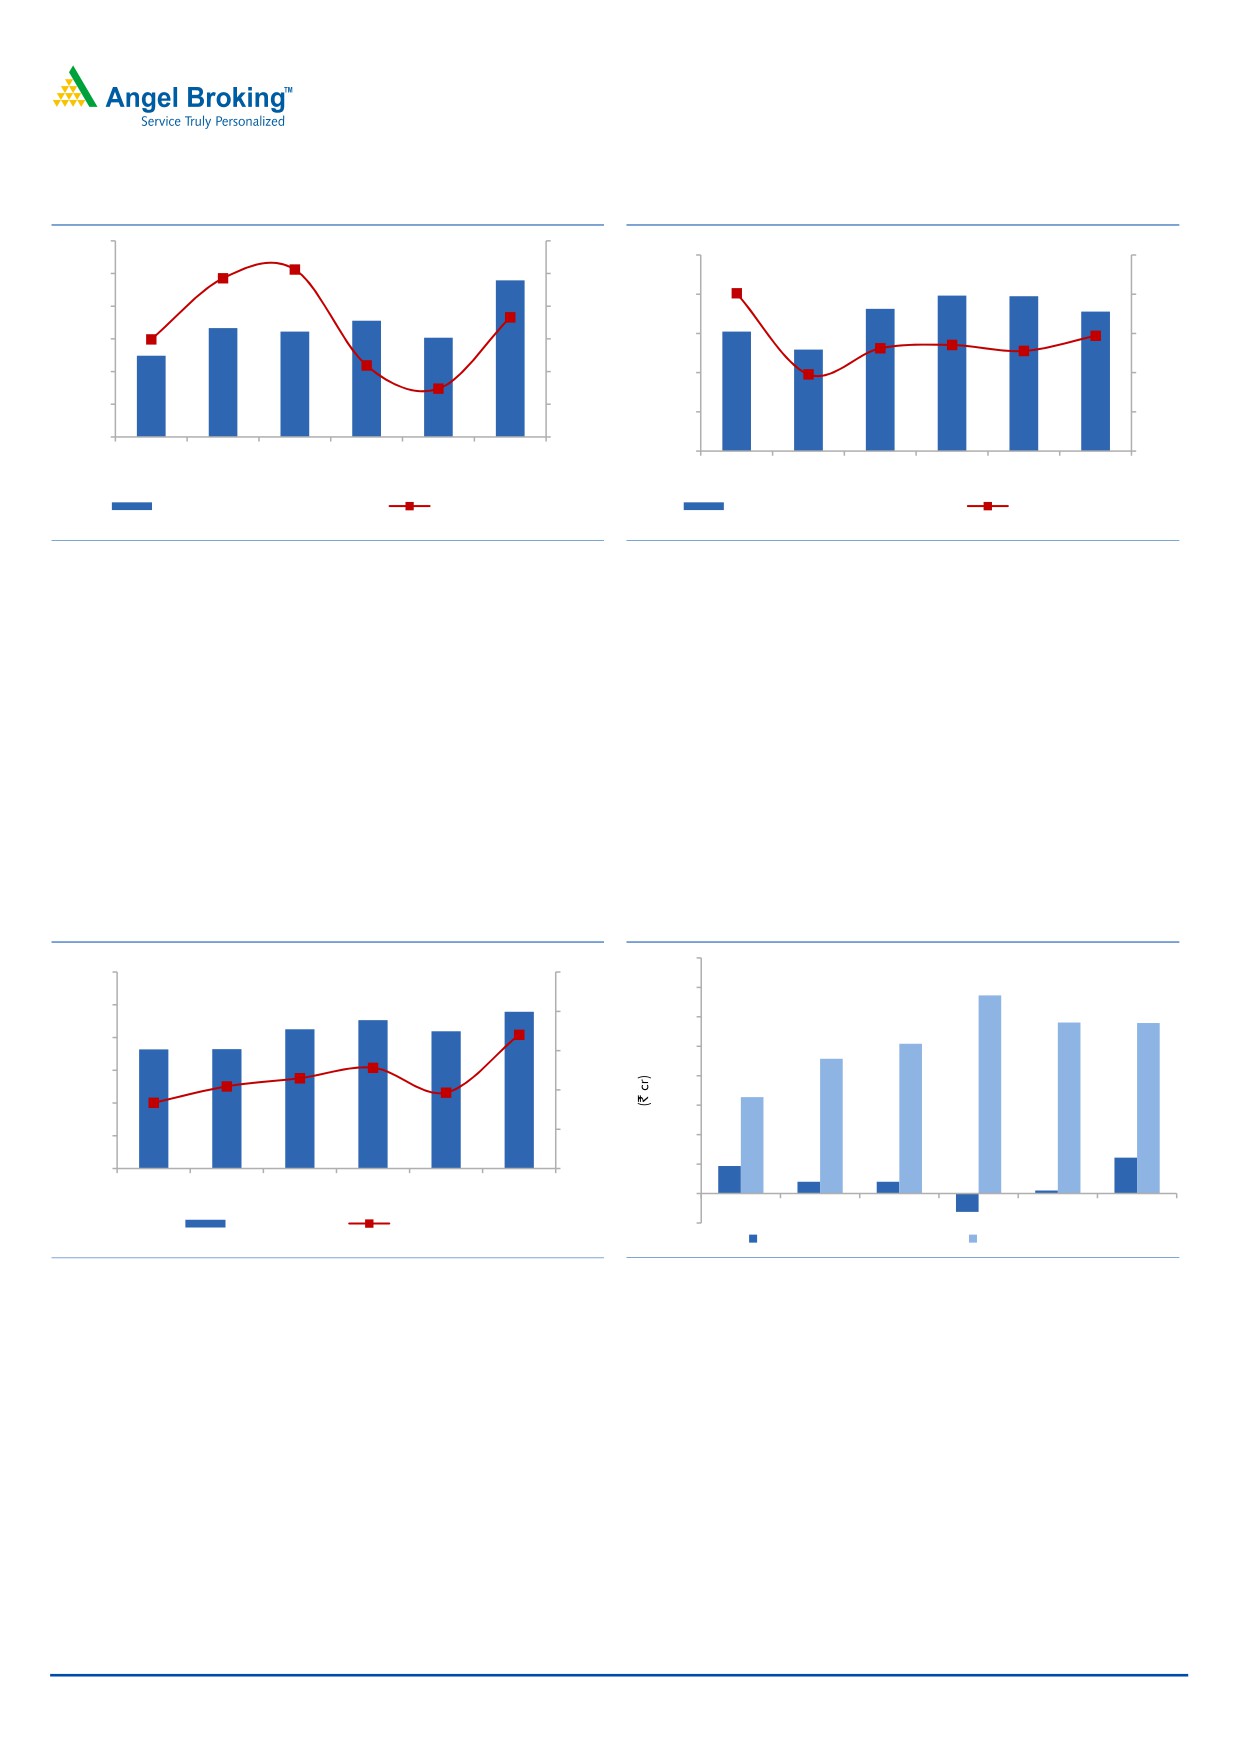
Exhibit 2: India revenues continue to recover
Exhibit 3: Overseas revenue growth remains strong
1,600
18
9,000
25
1,500
15
8,000
20
1,400
12
1,300
9
7,000
15
1,200
6
6,000
10
1,100
3
5,000
5
1,000
0
1QFY15
2QFY15
3QFY15
4QFY15
1QFY16
2QFY16
4,000
0
1QFY15
2QFY15
3QFY15
4QFY15
1QFY16
2QFY16
Within India revenues (` cr)
Growth yoy (%)
Outside India revenues (` cr)
Growth yoy (%)
Source: Company, Angel Research
Source: Company, Angel Research
Operating performance continues to improve: At the operating level, MSS reported
the highest operating margin of 10.4% in the last four years. The margins
improved 130bp yoy to reach the double-digit mark. Benign commodity prices
coupled with operating leverage led to margin improvement. Margins improved
across verticals. SMP’s margins at 6.7% improved 40bp yoy while SMR’s margins
at 9.6% improved 60bp on a yoy basis. Standalone business’ margins improved
160bp yoy to 19.6%.
During the quarter MSS registered a foreign exchange loss of `61cr. Adjusted for
the same, the bottom-line grew strongly by 26.5% yoy to `289cr.
Exhibit 4: EBITDA margin at four-year high level
Exhibit 5: Operating performance boosts Net profit
400
1,200
12
350
1,000
11
300
800
10
250
600
200
9
400
150
200
8
100
50
0
7
1QFY15
2QFY15
3QFY15
4QFY15
1QFY16
2QFY16
0
1QFY15
2QFY15
3QFY15
4QFY15
1QFY16
2QFY16
EBIDTA (` cr)
Margin (%)
(50)
Foreign exchange loss/(gain)
Adj Net Profit
Source: Company, Angel Research
Source: Company, Angel Research
November 18, 2015
3
Motherson Sumi Systems | 2QFY2016 Result Update
Exhibit 6: Standalone performance
Y/E March (` cr)
2QFY16 2QFY15
% chg (yoy) 1QFY16
% chg (qoq) 1HFY16 1HFY15
% chg (yoy)
Revenues
1,393
1,271
9.6
1,237
12.6
2,630
2,496
5.4
EBITDA
273
229
19.2
214
27.8
486
437
11.4
EBITDA margin (%)
19.6
18.0
17.3
18.5
17.5
Adj Net Profit
197
145
36.3
159
24.2
356
255
39.5
Source: Company, Angel Research
Exhibit 7: SMR performance
Y/E March (` cr)
2QFY16 2QFY15
% chg (yoy) 1QFY16
% chg (qoq) 1HFY16 1HFY15
% chg (yoy)
Revenues (Euro Mn)
335
293
14.3
365
(8.2)
700
588
19.0
Revenues
2,424
2,348
3.2
2,565
(5.5)
4,989
4,766
4.7
PBIDT
232
214
230
462
433
PBIDT margin (%)
9.6
9.1
5.0
9.0
6.7
9.3
9.1
1.9
Source: Company, Angel Research
Exhibit 8: SMP performance
Y/E March (` cr)
2QFY16 2QFY15
% chg (yoy) 1QFY16
% chg (qoq) 1HFY16 1HFY15
% chg (yoy)
Revenues (Euro Mn)
608
464
31.0
666
(8.7)
1274
995
28.0
Revenues
4,399
3,719
18.3
4,678
(6.0)
9,077
8,076
12.4
PBIDT
295
224
290
585
486
PBIDT margin (%)
6.7
6.0
11.3
6.2
8.2
6.4
6.0
7.1
Source: Company, Angel Research
November 18, 2015
4
Motherson Sumi Systems | 2QFY2016 Result Update
Investment arguments
Focus on increasing content per car to sustain leadership position: MSS' wide
product portfolio, global manufacturing presence, good relationships with
original equipment manufacturers (OEMs) and ability to provide end-to-end
solutions have enabled it to increase the content per car that it supplies to its
customers. Further, SMP’s acquisition has enhanced MSS' product offerings
significantly and strengthened its position as a key tier-I supplier globally.
Further, MSS is setting up manufacturing facilities in the US and China to cater
to its customer base which would results in robust growth going ahead.
Pick-up in order execution at SMR and SMP coupled with new orders to boost
performance: SMR and SMP have witnessed continuous improvement in
operating performance since being taken over by MSS and have bagged new
orders to be supplied over the life of the new models, which would be
launched in the near future. SMR and SMP currently have a huge order book
of Euro 12.5bn as of September 2015, which would help the company to
achieve its long term target of USD 18bn revenues by FY2020. MSS is
gradually progressing towards achieving its target of double-digit EBITDA
margins at the SMR front.
Exhibit 9: Five-year milestone set in FY2005
To cross US $1bn in revenue by FY2010
Achieve US $1.5bn topline
Achieved over 65% of
To achieve 60% of sales from outside India
sales from outside India
Largest customer constituted
Not more than 20% from one customer
15% of total turnover
RoCE 37% standalone &
To strive to maintain business RoCE of 40%
22% consolidated basis
To achieve dividend payout of 40% on
Achieved payout ratio of
consolidated profit
23% for FY2010
Source: Company, Angel Research
November 18, 2015
5
Motherson Sumi Systems | 2QFY2016 Result Update
Exhibit 10: Five-year milestone set in FY2010
To cross US $5bn in revenue by
Clocked US $5.5bn topline
FY2015
To attain RoCE of 40% on consolidated
Acheived RoCE of 41% for standalone.
basis
Consol RoCE stood at 26%
To acheive 70% of sales from outside
85% of sales is contributed by exports
India
Has presence in 25 countries thru
Global presence in 26-27 countries
JV/subsidiaries
To achieve dividend payout of 40% on
Achieved payout ratio of 30% for
consolidated profit
FY2015
Source: Company, Angel Research
Five year milestones set in 2015
MSS has set a target to attain turnover of USD 18 bn by FY20: This would be
achieved through increased sourcing for existing customers (specifically
targeting US and China markets), gaining new customers and through
acquisitions (inorganic route). MSS has planned a massive growth aim (the
revenue target points to a robust CAGR of 28% for the next five years).
To attain RoCE of 40% on consolidated basis: MSS aims to attain 40% RoCE
level by FY20. Improving subsidiary performance through enhanced capacity
utilization and cost control measures would enable MSS to achieve the return
targets.
3Cx15: In order to achieve more balanced and diversified growth, MSS has
proposed 3Cx15 which implies that no single customer, country or component
should constitute more than 15% of the turnover.
To achieve dividend payout ratio of 40%: In order to reward the shareholders,
MSS aims to reach a dividend payout ratio of 40% by FY20.
November 18, 2015
6
Motherson Sumi Systems | 2QFY2016 Result Update
Outlook and valuation
MSS continues to report improvement in its operating performance, driven by its
strategy of increasing the content per car, improvement in utilization levels at the
new plants and profitability improvement measures at SMP. However, the emission
scandal at MSS largest customer, Volkswagen (Volkswagen currently accounts for
~40% of the topline) could have a near term impact on the revenues as the brand
takes a knock leading to loss of volumes. The issue is likely to remain a key
overhang on the stock, unless further clarity emerges on the same. Nevertheless,
we expect the company to sustain its strong performance in the long term through
increased internal sourcing by subsidiaries and improvement in utilization levels at
the plants led by execution of new orders (new order book currently stands at Euro
12.5 billion which gives a strong outlook). We expect MSS to register a strong
revenue and net profit CAGR of ~14% and ~27% respectively over FY2015-17E.
Thus, we assign Accumulate rating on the stock with a target price of `313 (based
on 25x FY2017 earnings).
Company background
Motherson Sumi Systems (MSS), a JV between Samvardhana Motherson Group
(SMG, 36.9% stake) and Sumitomo Wiring Systems, Japan (25.3% stake), is the
world’s largest supplier of rear view mirrors and India’s biggest supplier of wiring
harness. MSS is considered to be a JV specialist (12 JVs) and has a successful
history of acquisitions, which have helped it expand its product portfolio, gain
access to technology and evolve into a leading global OEM supplier. MSS’ most
notable acquisitions include Visiocorp (now referred to as Samvardhana
Motherson Reflectec [SMR]) in FY2009, which is a global leader in automotive rear
view mirrors; and Peguform in FY2012, which is a leading supplier of door and
instrument panels and cockpit assemblies. The company is present across
25 countries and has over 145 manufacturing facilities worldwide.
November 18, 2015
7
Motherson Sumi Systems | 2QFY2016 Result Update
Profit and loss statement (Consolidated)
Y/E March (` cr)
FY2012
FY2013
FY2014
FY2015
FY2016E
FY2017E
Total operating income
14,777
25,312
30,428
34,585
39,343
45,100
% chg
76.5
71.3
20.2
13.7
13.8
14.6
Total expenditure
13,884
23,836
28,031
31,829
35,881
40,996
Net raw material costs
9,544
16,484
19,361
21,632
24,590
28,187
Other mfg costs
0
0
0
0
0
0
Employee expenses
2,317
4,283
5,106
6,365
7,082
8,073
Other
2,024
3,069
3,563
3,833
4,210
4,735
EBITDA
893
1,477
2,397
2,756
3,462
4,104
% chg
0.4
65.5
62.3
15.0
25.6
18.5
(% of total op. income)
6.0
5.8
7.9
8.0
8.8
9.1
Depreciation & amort.
380
715
817
921
1,035
1,186
EBIT
513
762
1,580
1,835
2,428
2,918
% chg
(20.1)
48.6
107.3
16.2
32.3
20.2
(% of total op. income)
3.5
3.0
5.2
5.3
6.2
6.5
Interest and other charges
165
250
294
318
305
305
Other income
145
322
311
464
525
593
Recurring PBT
493
834
1,596
1,982
2,647
3,206
% chg
(17.6)
69.4
91.3
24.2
33.6
21.1
Extraordinary items
(81)
0
0
(165)
(27)
0
PBT (reported)
412
834
1,596
1,817
2,620
3,206
Tax
215
384
499
526
811
982
(% of PBT)
52.3
46.0
31.3
28.9
30.6
30.6
PAT before MI
196
451
1,097
1,292
1,810
2,224
Minority interest
(63)
6
332
429
504
570
Reported PAT
260
444
765
862
1,306
1,654
ADJ. PAT
341
444
765
1,027
1,333
1,654
% chg
(2.6)
30.5
72.1
34.3
29.7
24.1
(% of total op. income)
2.3
1.8
2.5
3.0
3.4
3.7
Basic EPS (`)
3.0
5.0
8.7
9.8
9.9
12.5
Adj. EPS (`)
3.9
5.0
8.7
11.6
10.1
12.5
% chg
(2.6)
29.2
72.1
34.3
(13.5)
24.1
November 18, 2015
8
Motherson Sumi Systems | 2QFY2016 Result Update
Balance sheet statement (Consolidated)
Y/E March (` cr)
FY2012 FY2013 FY2014
FY2015
FY2016E
FY2017E
SOURCES OF FUNDS
Equity share capital
39
59
88
88
132
132
Reserves & surplus
1,833
2,230
2,871
3,236
4,058
5,256
Shareholders’ Funds
1,871
2,289
2,959
3,324
4,190
5,389
Minority interest
503
403
790
1,014
1,518
2,088
Total loans
4,129
4,071
3,995
4,910
4,710
4,710
Deferred tax liability
60
56
50
(45)
(45)
(45)
Other long term liabilities
164
239
208
309
309
309
Long term provisions
110
168
204
218
218
218
Total Liabilities
6,838
7,225
8,206
9,730
10,901
12,669
APPLICATION OF FUNDS
Gross block
9,432
10,743
12,634
12,644
14,572
16,704
Less: Acc. depreciation
4,740
5,466
6,715
6,515
7,550
8,736
Net Block
4,692
5,277
5,919
6,129
7,022
7,968
Capital work-in-progress
446
386
647
956
874
835
Investments
94
72
75
65
65
65
Long term loans and adv.
156
151
357
569
750
1,000
Other noncurrent assets
140
135
191
243
300
350
Current assets
6,439
6,719
8,056
9,419
10,057
11,385
Cash
456
594
906
1,892
1,681
1,783
Loans & advances
721
581
616
744
866
992
Other
5,262
5,544
6,533
6,783
7,511
8,610
Current liabilities
5,128
5,514
7,038
7,650
8,168
8,935
Net current assets
1,311
1,205
1,017
1,769
1,890
2,451
Misc. exp. not written off
0
0
0
0
0
0
Total Assets
6,838
7,225
8,206
9,730
10,901
12,669
November 18, 2015
9
Motherson Sumi Systems | 2QFY2016 Result Update
Cash flow statement (Consolidated)
Y/E March (` cr)
FY2012 FY2013 FY2014 FY2015 FY2016E FY2017E
Profit before tax
412
834
1,596
1,817
2,620
3,206
Depreciation
2,685
725
1,249
(200)
1,035
1,186
Change in working capital
(412)
245
499
234
(332)
(458)
Others
82
132
(56)
(32)
(58)
(50)
Direct taxes paid
(215)
(384)
(499)
(526)
(811)
(982)
Cash Flow from Operations
2,551
1,553
2,789
1,294
2,455
2,902
(Inc.)/Dec. in fixed assets
(5,667)
(1,250)
(2,152)
(319)
(1,846)
(2,093)
(Inc.)/Dec. in investments
(47)
22
(3)
10
0
0
(Inc.)/Dec. in loans and adv
(63)
5
(206)
(213)
(181)
(250)
Cash Flow from Investing
(5,777)
(1,223)
(2,362)
(522)
(2,027)
(2,343)
Issue of equity
0
20
29
0
44
0
Inc./(Dec.) in loans
2,987
(58)
(77)
916
(200)
0
Dividend paid (Incl. Tax)
(107)
(143)
(269)
(322)
(483)
(483)
Others
448
(10)
200
(380)
0
0
Cash Flow from Financing
3,328
(191)
(116)
214
(639)
(483)
Inc./(Dec.) in cash
103
139
312
986
(211)
76
Opening Cash balances
353
456
594
906
1,892
1,681
Closing Cash balances
456
594
906
1,892
1,681
1,756
November 18, 2015
10
Motherson Sumi Systems | 2QFY2016 Result Update
Key ratios
Y/E March
FY2012
FY2013
FY2014
FY2015
FY2016E
FY2017E
Valuation Ratio (x)
P/E (on FDEPS)
98.5
58.1
33.8
30.0
29.7
22.5
P/CEPS
40.0
22.3
16.3
14.5
16.6
22.5
P/BV
13.7
11.3
8.7
7.8
8.9
6.9
Dividend yield (%)
0.5
0.7
0.9
1.0
1.0
1.1
EV/Sales
1.7
1.1
0.9
0.8
1.0
0.9
EV/EBITDA
29.5
19.8
12.0
10.4
12.1
9.8
EV / Total Assets
4.3
4.0
3.5
3.0
3.8
3.2
Per Share Data (`)
EPS (Basic)
3.0
5.0
8.7
9.8
9.9
12.5
EPS (fully diluted)
3.9
5.0
8.7
11.6
10.1
12.5
Cash EPS
7.3
13.1
17.9
20.2
17.7
21.5
DPS
1.0
1.3
2.5
3.0
3.0
3.0
Book Value
21.3
25.8
33.6
37.7
31.7
40.5
Dupont Analysis
EBIT margin
3.5
3.0
5.2
5.3
6.2
6.5
Tax retention ratio
0.5
0.5
0.7
0.7
0.7
0.7
Asset turnover (x)
3.2
3.9
4.4
4.6
4.6
4.5
ROIC (Post-tax)
5.4
6.3
15.6
17.2
19.7
20.1
Cost of Debt (Post Tax)
3.0
3.3
5.0
5.1
4.4
4.5
Leverage (x)
1.2
1.7
1.2
0.9
0.8
0.6
Operating ROE
8.3
11.5
28.5
28.8
31.7
29.7
Returns (%)
ROCE (Pre-tax)
10.3
10.8
20.5
20.5
23.5
24.8
Angel ROIC (Pre-tax)
8.0
11.5
21.6
23.4
26.3
26.8
ROE
19.6
21.4
29.2
32.7
35.5
34.6
Turnover ratios (x)
Asset Turnover (Gross Block)
2.2
2.5
2.6
2.7
2.9
2.9
Inventory / Sales (days)
41
35
35
37
37
37
Receivables (days)
49
43
37
33
33
33
Payables (days)
80
72
70
72
77
75
WC cycle (ex-cash) (days)
16
11
4
(0)
0
4
Solvency ratios (x)
Net debt to equity
1.9
1.5
1.0
0.9
0.7
0.5
Net debt to EBITDA
4.0
2.3
1.3
1.1
0.9
0.7
Interest Coverage (EBIT / Int.)
3.1
3.1
5.4
5.8
8.0
9.6
November 18, 2015
11
Motherson Sumi Systems | 2QFY2016 Result Update
Research Team Tel: 022 - 39357800
DISCLAIMER
Angel Broking Private Limited (hereinafter referred to as “Angel”) is a registered Member of National Stock Exchange of India Limited,
Bombay Stock Exchange Limited and Metropolitan Stock Exchange of India Limited. It is also registered as a Depository Participant with
CDSL and Portfolio Manager with SEBI. It also has registration with AMFI as a Mutual Fund Distributor. Angel Broking Private Limited is
a registered entity with SEBI for Research Analyst in terms of SEBI (Research Analyst) Regulations, 2014 vide registration number
INH000000164. Angel or its associates has not been debarred/ suspended by SEBI or any other regulatory authority for accessing
/dealing in securities Market. Angel or its associates including its relatives/analyst do not hold any financial interest/beneficial
ownership of more than 1% in the company covered by Analyst. Angel or its associates/analyst has not received any compensation /
managed or co-managed public offering of securities of the company covered by Analyst during the past twelve months. Angel/analyst
has not served as an officer, director or employee of company covered by Analyst and has not been engaged in market making activity
of the company covered by Analyst.
This document is solely for the personal information of the recipient, and must not be singularly used as the basis of any investment
decision. Nothing in this document should be construed as investment or financial advice. Each recipient of this document should
make such investigations as they deem necessary to arrive at an independent evaluation of an investment in the securities of the
companies referred to in this document (including the merits and risks involved), and should consult their own advisors to determine
the merits and risks of such an investment.
Reports based on technical and derivative analysis center on studying charts of a stock's price movement, outstanding positions and
trading volume, as opposed to focusing on a company's fundamentals and, as such, may not match with a report on a company's
fundamentals.
The information in this document has been printed on the basis of publicly available information, internal data and other reliable
sources believed to be true, but we do not represent that it is accurate or complete and it should not be relied on as such, as this
document is for general guidance only. Angel Broking Pvt. Limited or any of its affiliates/ group companies shall not be in any way
responsible for any loss or damage that may arise to any person from any inadvertent error in the information contained in this report.
Angel Broking Pvt. Limited has not independently verified all the information contained within this document. Accordingly, we cannot
testify, nor make any representation or warranty, express or implied, to the accuracy, contents or data contained within this document.
While Angel Broking Pvt. Limited endeavors to update on a reasonable basis the information discussed in this material, there may be
regulatory, compliance, or other reasons that prevent us from doing so.
This document is being supplied to you solely for your information, and its contents, information or data may not be reproduced,
redistributed or passed on, directly or indirectly.
Neither Angel Broking Pvt. Limited, nor its directors, employees or affiliates shall be liable for any loss or damage that may arise from
or in connection with the use of this information.
Note: Please refer to the important ‘Stock Holding Disclosure' report on the Angel website (Research Section). Also, please refer to the
latest update on respective stocks for the disclosure status in respect of those stocks. Angel Broking Pvt. Limited and its affiliates may
have investment positions in the stocks recommended in this report.
Disclosure of Interest Statement
Motherson Sumi Systems
1. Analyst ownership of the stock
No
2. Angel and its Group companies ownership of the stock
No
3. Angel and its Group companies' Directors ownership of the stock
No
4. Broking relationship with company covered
No
Note: We have not considered any Exposure below ` 1 lakh for Angel, its Group companies and Directors
Ratings (Based on expected returns
Buy (> 15%)
Accumulate (5% to 15%)
Neutral (-5 to 5%)
over 12 months investment period):
Reduce (-5% to -15%)
Sell (< -15)
November 18, 2015
12