3QFY2017 Result Update | Footwear
February 01, 2017
Mirza International
BUY
CMP
`91
Performance Highlights
Target Price
`107
Quarterly Data
Investment Period
12 Months
(` cr)
3QFY17
3QFY16
% yoy
2QFY17
% qoq
Revenue
228
216
5.5
250
(8.9)
Stock Info
EBITDA
40
34
16.1
38
5.0
Sector
Footwear
Margin (%)
17.4
15.8
159bp
15.1
230bp
Market Cap (` cr)
1,079
Adj. PAT
17
15
13.8
16
5.0
Net Debt (` cr)
213
Source: Company, Angel Research
Beta
1.6
For 3QFY2017, Mirza International (MIL) posted results which were below our
52 Week High / Low
110/69
estimates on both, the top-line and the bottom-line fronts. Revenues de-grew by
Avg. Daily Volume
73,935
~6% yoy, lower than our estimate. However, on the operating front, the company
Face Value (`)
2
reported margin improvement on the back of lower raw material cost, which
BSE Sensex
28,142
therefore, lead to double digit profit growth on the bottom-line front.
Nifty
8,716
Top line de-grew by ~6%: The company’s top-line de-grew by ~6% yoy to
Reuters Code
MIRZ.BO
`228cr (below our estimate) on the back of lower growth in domestic as well as
Bloomberg Code
MRZI.IN
international markets.
Lower sales impacted the overall profitability: On the operating front, the
Shareholding Pattern (%)
company’s margin improved by 159bp yoy to 17.4%, primarily on account of
Promoters
73.8
lower raw material cost. The company reported ~14% yoy rise in its net profit to
MF / Banks / Indian Fls
0.3
`17cr on the back of healthy operating performance.
FII / NRIs / OCBs
0.5
Outlook and Valuation: We expect MIL to report a net revenue CAGR of ~7% to
Indian Public / Others
25.4
~`1,069cr over FY2016-18E on the back of strong growth in domestic branded
sales (owing to aggressive ad spends and addition in the number of EBOs &
multi-brand outlets [MBOs]) and healthy export revenues. On the bottom-line
Abs.(%)
3m
1yr
3yr
front, we expect a CAGR of ~8% to `90cr over the same period on the back
Sensex
(0.3)
12.2
35.9
of margin improvement. Thus, we maintain our Buy rating with the Target
MIL
(4.1)
(12.4)
235.8
Price of `107.
Key financials
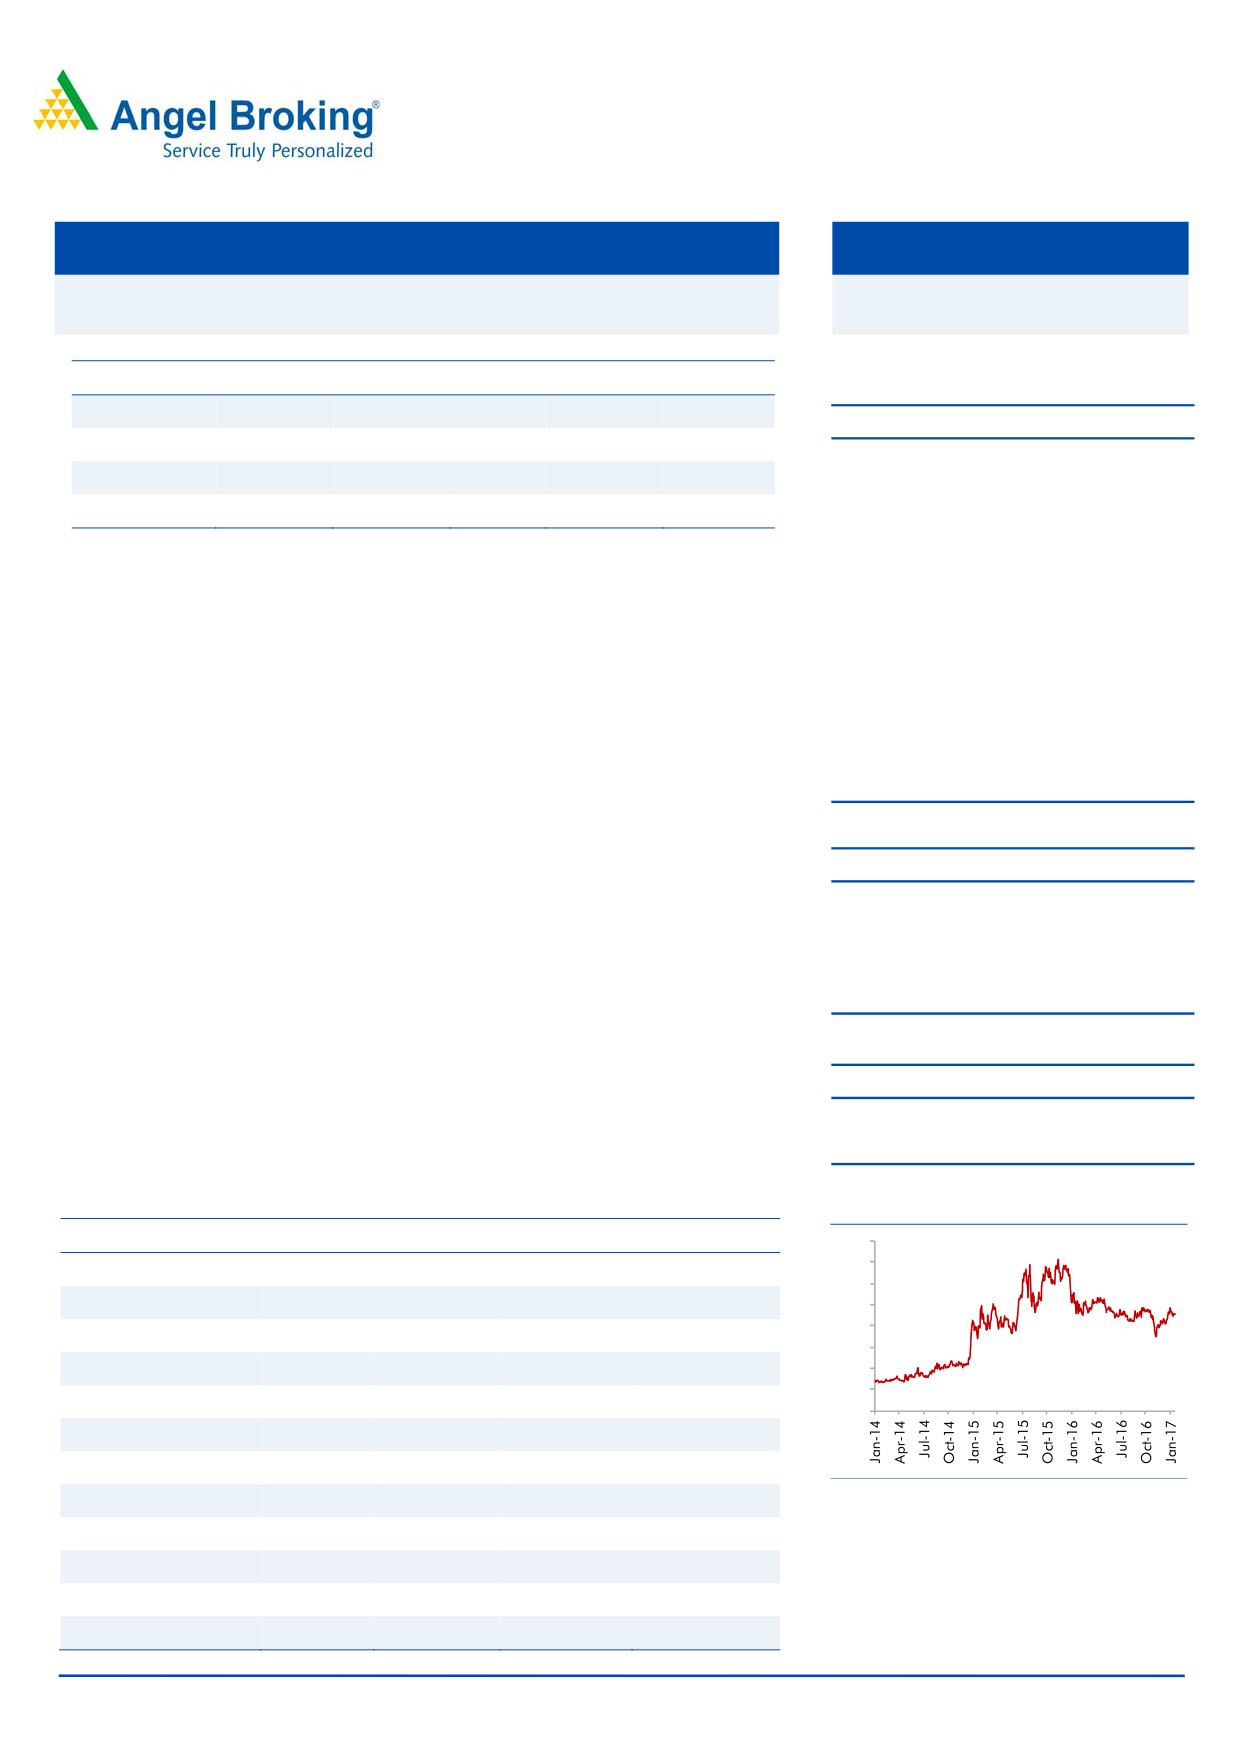
3-year price chart
Y/E March (` cr)
FY2015
FY2016
FY2017E
FY2018E
160
140
Net sales
919
927
963
1,069
120
% chg
29.9
0.9
3.9
11.0
100
80
Net profit
51
78
74
90
60
% chg
51.2
78.1
73.7
90.3
40
20
EBITDA margin (%)
15.5
18.5
17.2
18.0
0
EPS (`)
4.3
6.5
6.1
7.5
P/E (x)
21.2
13.9
14.7
12.0
Source: Company, Angel Research
P/BV (x)
3.6
2.6
2.2
1.9
RoE (%)
16.4
18.5
15.0
15.7
RoCE (%)
22.3
22.6
19.1
20.2
Amarjeet S Maurya
EV/Sales (x)
1.4
1.4
1.3
1.2
022-39357800 Ext: 6831
EV/EBITDA (x)
9.1
7.5
7.7
6.6
Source: Company, Angel Research, Note: CMP as of February 1, 2017
Please refer to important disclosures at the end of this report
1
Mirza International | 3QFY2017 Result Update
Exhibit 1: Quarterly performance
Y/E March (` cr)
3QFY17
3QFY16
% yoy
2QFY17
% qoq
9MFY17
9MFY16
% chg
Net Sales
228
216
5.5
250
(8.9)
731
721
1.3
Consumption of RM
121
118
2.4
146
(16.8)
414
423
(2.1)
(% of Sales)
53.2
54.8
58.3
56.6
58.6
Staff Costs
18
16
13.2
16
12.4
50
43
14.7
(% of Sales)
7.9
7.4
6.4
6.8
6.0
Other Expenses
49
47
2.9
50
(3.1)
146
137
6.7
(% of Sales)
21.4
22.0
20.2
20.0
18.9
Total Expenditure
188
182
3.5
212
(11.4)
609
603
1.1
Operating Profit
40
34
16.1
38
5.0
121
118
2.5
OPM
17.4
15.8
15.1
16.6
16.4
Interest
6.4
5
30.7
6.5
(1.2)
20
25
(22.3)
Depreciation
7.5
6
20.5
7.1
5.3
21
19
11.1
Other Income
-
-
-
-
2
PBT (excl. Ext Items)
26
23
11.7
24
6.6
80
75
6.6
Ext (Income)/Expense
PBT (incl. Ext Items)
26
23
11.7
24
6.6
80
75
6.6
(% of Sales)
11.3
10.7
9.7
11.0
10.5
Provision for Taxation
9
8
8
27
26
2.0
(% of PBT)
33.5
34.6
32.4
33
35
Reported PAT
17
15
13.8
16
5.0
54
49
9.0
PATM
7.5
7.0
6.5
7.3
6.8
Equity shares (cr)
12
12
12
12
12
FDEPS (`)
1.4
1.3
13.8
1.4
5.0
4.5
4.1
9.0
Source: Company, Angel Research
February 1, 2017
2
Mirza International | 3QFY2017 Result Update
Key investment arguments
Strong growth in domestic branded segment to drive overall growth
In the domestic branded segment, we expect the company to report a ~16%
CAGR over FY2016-18E to `235cr. We anticipate strong growth for the company
on the back of - (a) the company’s wide distribution reach through its 1,000+
outlets, including 120 exclusive brand outlets (EBOs) in 35+ cities, and the same
are expected to reach 200 over the next 2-3 years; and (b) strong brands (Red
Tape) in the shoes segment. Further, MIL is enhancing its brand visibility owing to
higher ad spends in FY2017. MIL has doubled its ad spends over the last five
years; ad spends as a proportion of branded product sales now stands at 9-10%.
Strong global footprint
MIL’s major export revenue comes from the UK (73%), followed by the US (14%)
and the balance from ROW. Export constitutes ~75% of the company’s total
revenue. The company is reasonably insulated in terms of client concentration. Its
clients include ASDA, River Island, Matalan, ASOS, Elan Polo, and Steve Madden
among others. In the UK, the company has a market share of ~25% in the men’s
leather footwear mid-segment category. We expect the company to report healthy
growth over the next 2-3 years on the back of recovery in the UK market, strong
growth in the US market and with it tapping newer international geographies like
the Middle East countries.
Genesis Footwear merger to boost margins
In FY2016, the company acquired Genesis Footwear, which has a better margin
profile than it. The deal resulted in MIL’s EPS increasing by ~4% and ROE
improving from 15.9% to 17.5%. Further, due to this merger, the company’s
capacity has increased from 5.4mn units to 6.4mn units. During FY2016, the
company reported net sales of `90cr, EBITDA margin of ~29%, and PAT of `20cr.
February 1, 2017
3
Mirza International | 3QFY2017 Result Update
Outlook and Valuation
We expect MIL to report a net revenue CAGR of ~7% to ~`1,069cr over FY2016-
18E on the back of strong growth in domestic branded sales (owing to aggressive
ad spends and addition in the number of EBOs & multi-brand outlets [MBOs]) and
healthy export revenues. On the bottom-line front, we expect a CAGR of ~8% to
`90cr over the same period on the back of margin improvement. Thus, we
maintain our Buy rating with a Target Price of `107
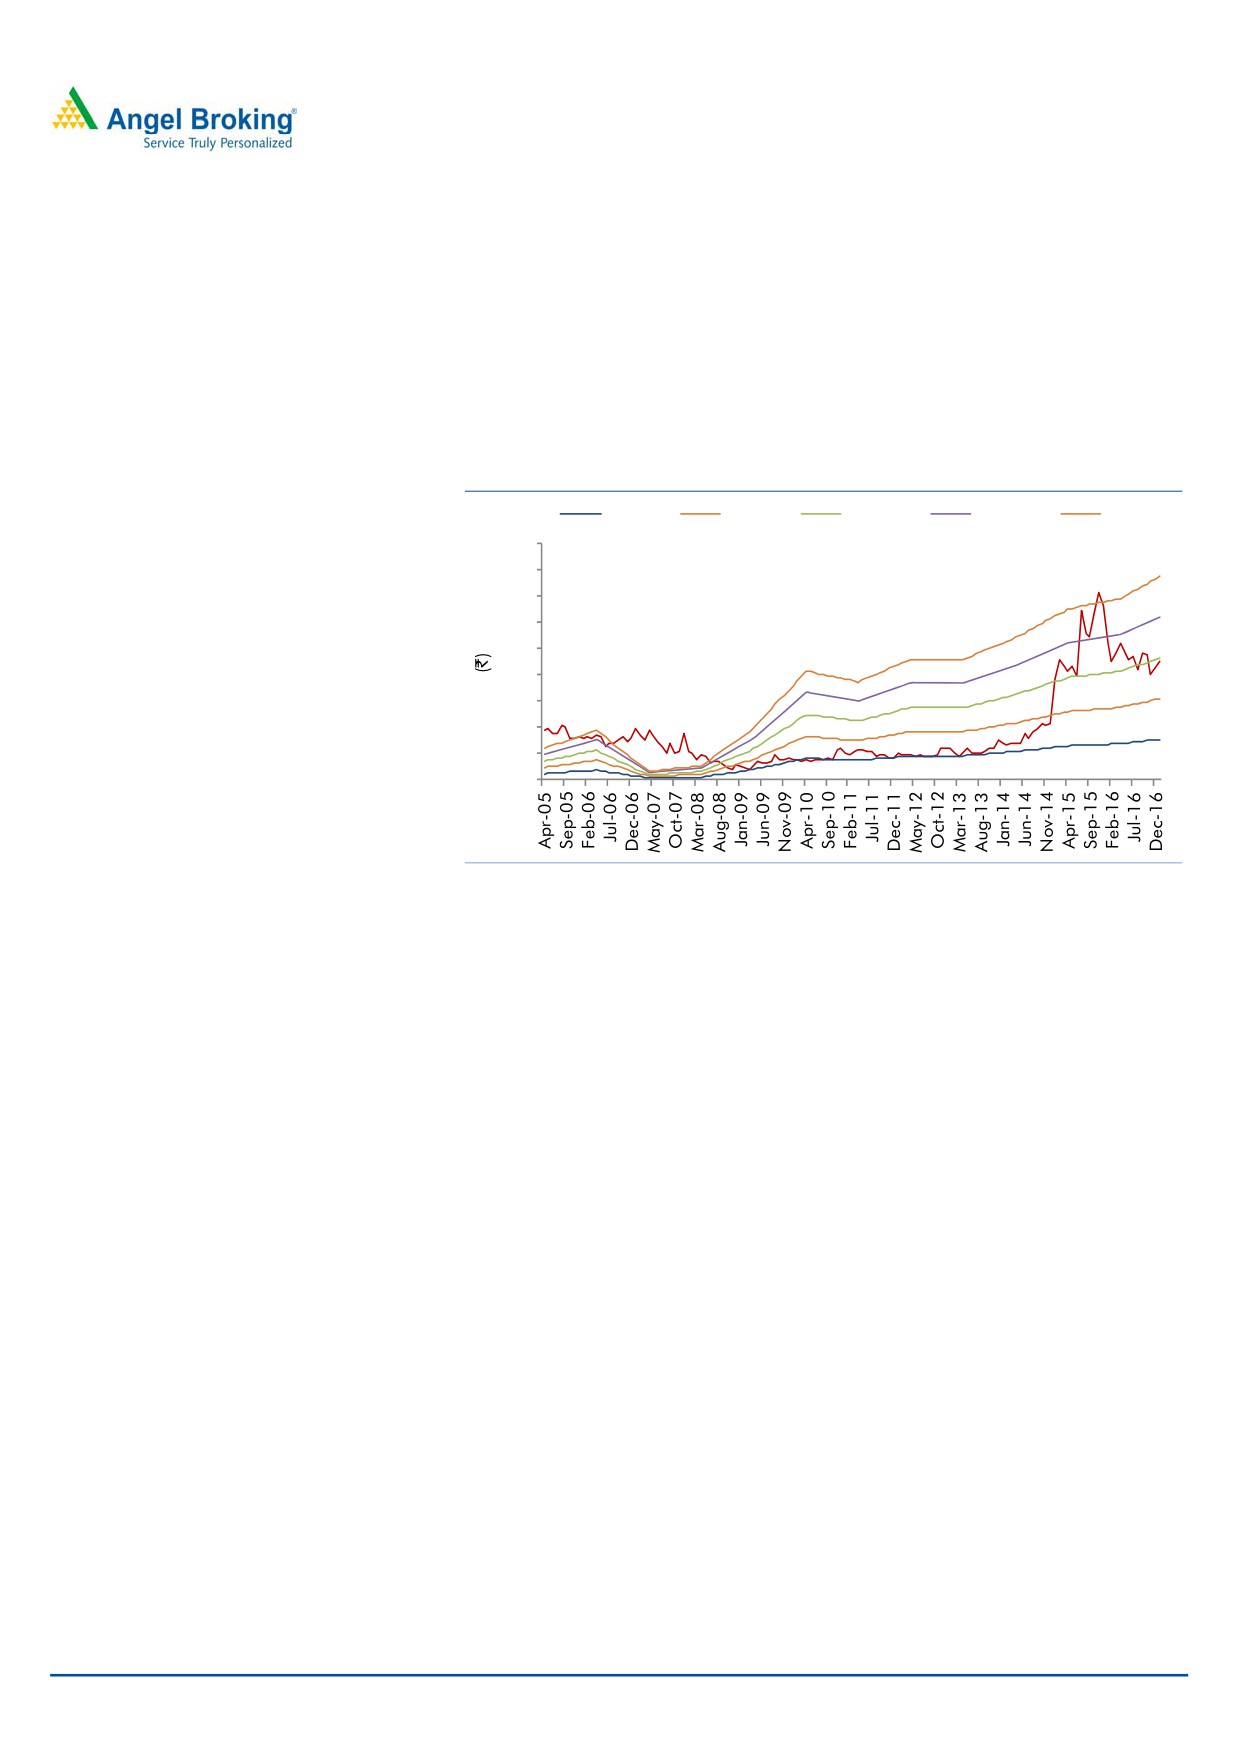
Exhibit 2: One year forward PE Chart
4x
8x
12x
16x
20x
180
160
140
120
100
80
60
40
20
0
Source: Company, Angel Research
Downside risks to our estimates
Any slowdown in global economy could hurt the company’s revenue (75% of
revenue comes from exports).
Volatility in USD and Euro exchange rate against INR can have negative
impact on margins.
February 1, 2017
4
Mirza International | 3QFY2017 Result Update
Company Background
MIL is an India-based company engaged in manufacturing and marketing leather
and leather footwear. The company’s operations are segmented as the Footwear
division and the Tannery division. Its Tannery division manufactures finished
leather from raw hides, wet blue and crust, and the Footwear division
manufactures finished leather shoes. The company exports its products to the
European Union, Germany, the United Kingdom, the United States, Italy, and
France among other geographies. It operates an in-house shoe production facility
and a design studio in London. Its brands include Red Tape and Oaktrak. The Red
Tape brand’s product portfolio includes men's footwear, women's footwear, shirts,
jackets, denims, tees, pants/shorts and accessories. Oaktrak is a brand of formal
footwear including casual and urban styles. Oaktrak is sold through independents,
small retailers and multiples.
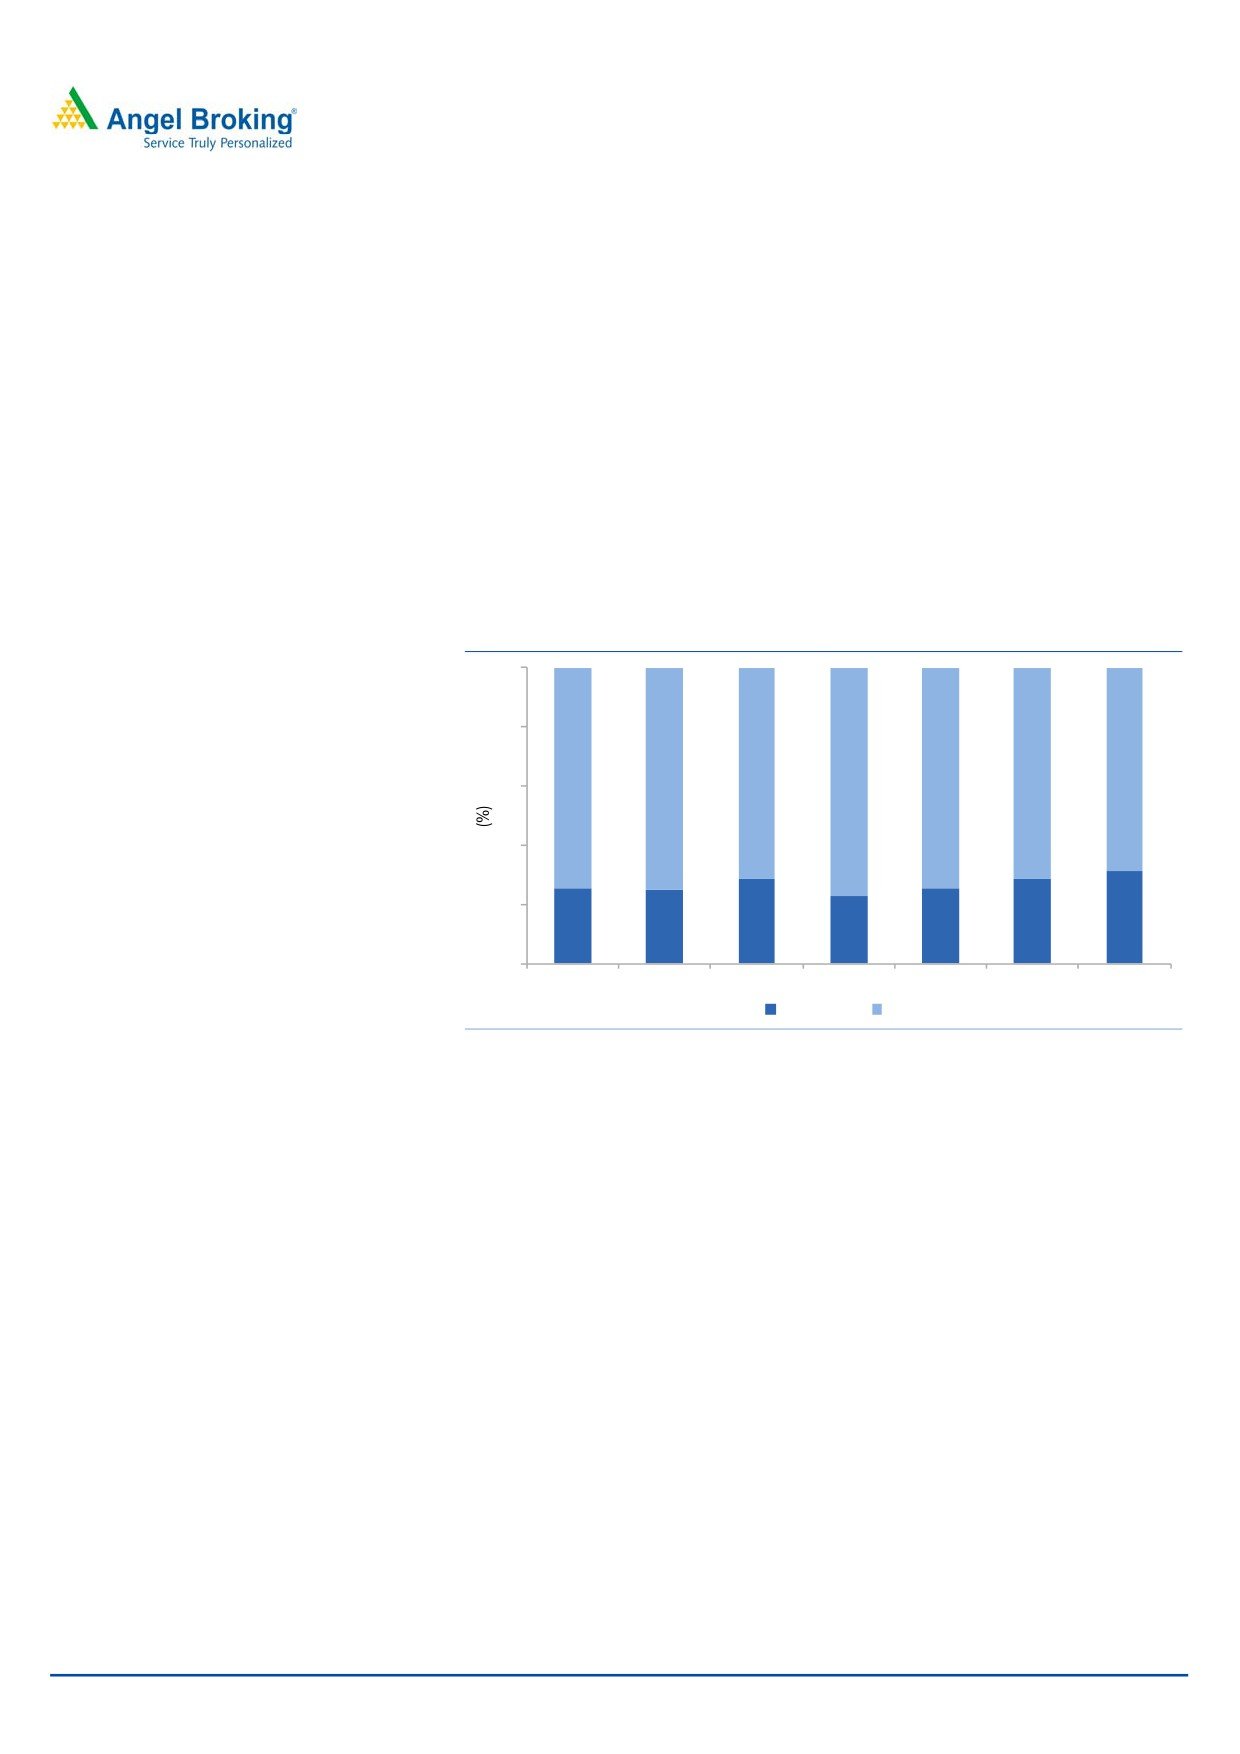
Exhibit 3: Historical revenue mix
100
80
72
71
69
74
75
77
75
60
40
20
28
29
31
26
25
23
25
0
FY2012
FY2013
FY2014
FY2015
FY2016
FY2017E FY2018E
Domestic
Exports
Source: Company, Angel Research
February 1, 2017
5
Mirza International | 3QFY2017 Result Update
Consolidated Profit & Loss Statement
Y/E March (` cr)
FY13
FY14
FY15
FY16
FY17E
FY18E
Total operating income
644
707
919
927
963
1,069
% chg
16.3
9.9
29.9
0.9
3.9
11.0
Total Expenditure
528
586
776
755
798
877
Cost of Materials
370
404
548
504
536
597
Personnel
33
37
46
59
65
77
Others Expenses
125
145
182
192
196
203
EBITDA
116
122
143
172
166
192
% chg
37.2
5.1
17.1
20.6
(3.7)
16.2
(% of Net Sales)
18.0
17.2
15.5
18.5
17.2
18.0
Depreciation& Amortisation
20
22
25
26
29
31
EBIT
96
100
118
146
137
162
% chg
38.7
4.0
18.3
23.9
(6.2)
18.1
(% of Net Sales)
14.9
14.1
12.8
15.8
14.2
15.1
Interest & other Charges
32
32
39
32
27
27
Other Income
-
-
-
2
-
-
Recurring PBT
64
68
79
116
110
135
% chg
27.6
5.3
16.1
47.2
(5.0)
22.5
Prior Period & Extraord. Exp./(Inc.)
-
-
-
-
-
-
PBT (reported)
64
68
79
116
110
135
Tax
21
24
28
38
36
44
(% of PBT)
32.5
36.0
35.0
32.6
33.0
33.0
PAT (reported)
43
43
51
78
74
90
Add: Share of earnings of asso.
-
-
-
-
-
-
ADJ. PAT
43
43
51
78
74
90
% chg
43.4
43.4
51.2
78.1
73.7
90.3
(% of Net Sales)
6.7
6.1
5.6
8.4
7.7
8.4
Basic EPS (`)
3.6
3.6
4.3
6.5
6.1
7.5
Fully Diluted EPS (`)
3.6
3.6
4.3
6.5
6.1
7.5
% chg
43.8
(0.1)
17.9
52.7
(5.6)
22.5
February 1, 2017
6
Mirza International | 3QFY2017 Result Update
Consolidated Balance Sheet
Y/E March (` cr)
FY13
FY14
FY15
FY16
FY17E
FY18E
SOURCES OF FUNDS
Equity Share Capital
19
19
19
24
24
24
Reserves& Surplus
233
268
294
398
467
552
Shareholders Funds
251
287
313
422
491
576
Minority Interest
-
-
-
-
-
-
Total Loans
167
212
218
225
225
225
Deferred Tax Liability
21
23
15
15
15
15
Total Liabilities
440
521
545
662
731
816
APPLICATION OF FUNDS
Gross Block
371
441
489
551
591
631
Less: Acc. Depreciation
119
133
181
207
236
266
Net Block
252
308
308
344
356
365
Capital Work-in-Progress
30
7
3
3
3
3
Investments
1
1
1
1
1
1
Current Assets
224
300
346
421
478
563
Inventories
138
192
225
262
277
313
Sundry Debtors
33
42
43
63
71
85
Cash
4
6
6
11
24
36
Loans & Advances
44
56
67
74
92
107
Other Assets
5
3
5
10
14
21
Current liabilities
68
97
115
110
110
118
Net Current Assets
156
203
231
311
369
445
Deferred Tax Asset
2
2
3
3
3
3
Mis. Exp. not written off
-
-
-
-
-
-
Total Assets
440
521
545
662
731
816
February 1, 2017
7
Mirza International | 3QFY2017 Result Update
Consolidated Cashflow Statement
Y/E March (` cr)
FY13
FY14
FY15
FY16
FY17E
FY18E
Profit before tax
64
68
79
116
110
135
Depreciation
20
22
25
26
29
31
Change in Working Capital
(8)
(48)
(19)
(74)
(45)
(64)
Interest / Dividend (Net)
31
32
39
32
27
27
Direct taxes paid
(19)
(24)
(28)
(38)
(36)
(44)
Others
0
(0)
1
-
-
-
Cash Flow from Operations
89
48
97
61
84
84
(Inc.)/ Dec. in Fixed Assets
(58)
(54)
(59)
(63)
(40)
(40)
(Inc.)/ Dec. in Investments
-
-
-
-
-
-
Cash Flow from Investing
(58)
(54)
(59)
(63)
(40)
(40)
Issue of Equity
-
-
-
36
-
-
Inc./(Dec.) in loans
1
45
6
8
-
-
Dividend Paid (Incl. Tax)
(5)
(5)
(5)
(5)
(5)
(5)
Interest / Dividend (Net)
(36)
(33)
(40)
(32)
(27)
(27)
Cash Flow from Financing
(39)
8
(39)
7
(32)
(32)
Inc./(Dec.) in Cash
(8)
2
(1)
6
13
12
Opening Cash balances
12
4
6
6
11
24
Closing Cash balances
4
6
6
11
24
36
February 1, 2017
8
Mirza International | 3QFY2017 Result Update
Key ratios
Y/E March
FY13
FY14
FY15
FY16
FY17E
FY18E
Valuation Ratio (x)
P/E (on FDEPS)
24.9
25.0
21.2
13.9
14.7
12.0
P/CEPS
17.1
16.5
14.3
10.4
10.6
9.0
P/BV
4.4
3.8
3.6
2.6
2.2
1.9
Dividend yield (%)
0.4
0.4
0.4
0.4
0.4
0.4
EV/Sales
1.9
1.8
1.4
1.4
1.3
1.2
EV/EBITDA
10.7
10.6
9.1
7.5
7.7
6.6
EV / Total Assets
2.5
2.1
2.0
1.7
1.5
1.4
Per Share Data (`)
EPS (Basic)
3.6
3.6
4.3
6.5
6.1
7.5
EPS (fully diluted)
3.6
3.6
4.3
6.5
6.1
7.5
Cash EPS
5.3
5.4
6.3
8.6
8.5
10.0
DPS
0.4
0.4
0.4
0.4
0.4
0.4
Book Value
20.4
23.4
25.3
34.4
40.1
47.2
Returns (%)
ROCE
22.9
20.0
22.3
22.6
19.1
20.2
Angel ROIC (Pre-tax)
23.2
20.3
22.5
23.0
19.8
21.2
ROE
17.3
15.1
16.4
18.5
15.0
15.7
Turnover ratios (x)
Asset Turnover (Gross Block)
1.7
1.6
1.9
1.7
1.6
1.7
Inventory / Sales (days)
78
99
89
103
105
107
Receivables (days)
18
22
17
25
27
29
Payables (days)
27
35
33
30
29
28
WC cycle (ex-cash) (days)
69
86
74
98
103
108
February 1, 2017
9
Mirza International | 3QFY2017 Result Update
Research Team Tel: 022 - 39357800
DISCLAIMER
Angel Broking Private Limited (hereinafter referred to as “Angel”) is a registered Member of National Stock Exchange of India Limited,
Bombay Stock Exchange Limited and Metropolitan Stock Exchange Limited. It is also registered as a Depository Participant with CDSL
and Portfolio Manager with SEBI. It also has registration with AMFI as a Mutual Fund Distributor. Angel Broking Private Limited is a
registered entity with SEBI for Research Analyst in terms of SEBI (Research Analyst) Regulations, 2014 vide registration number
INH000000164. Angel or its associates has not been debarred/ suspended by SEBI or any other regulatory authority for accessing
/dealing in securities Market. Angel or its associates/analyst has not received any compensation / managed or co-managed public
offering of securities of the company covered by Analyst during the past twelve months.
This document is solely for the personal information of the recipient, and must not be singularly used as the basis of any investment
decision. Nothing in this document should be construed as investment or financial advice. Each recipient of this document should
make such investigations as they deem necessary to arrive at an independent evaluation of an investment in the securities of the
companies referred to in this document (including the merits and risks involved), and should consult their own advisors to determine
the merits and risks of such an investment.
Reports based on technical and derivative analysis center on studying charts of a stock's price movement, outstanding positions and
trading volume, as opposed to focusing on a company's fundamentals and, as such, may not match with a report on a company's
fundamentals. Investors are advised to refer the Fundamental and Technical Research Reports available on our website to evaluate the
contrary view, if any.
The information in this document has been printed on the basis of publicly available information, internal data and other reliable
sources believed to be true, but we do not represent that it is accurate or complete and it should not be relied on as such, as this
document is for general guidance only. Angel Broking Pvt. Limited or any of its affiliates/ group companies shall not be in any way
responsible for any loss or damage that may arise to any person from any inadvertent error in the information contained in this report.
Angel Broking Pvt. Limited has not independently verified all the information contained within this document. Accordingly, we cannot
testify, nor make any representation or warranty, express or implied, to the accuracy, contents or data contained within this document.
While Angel Broking Pvt. Limited endeavors to update on a reasonable basis the information discussed in this material, there may be
regulatory, compliance, or other reasons that prevent us from doing so.
This document is being supplied to you solely for your information, and its contents, information or data may not be reproduced,
redistributed or passed on, directly or indirectly.
Neither Angel Broking Pvt. Limited, nor its directors, employees or affiliates shall be liable for any loss or damage that may arise from
or in connection with the use of this information.
Disclosure of Interest Statement
Mirza International
1. Financial interest of research analyst or Angel or his Associate or his relative
No
2. Ownership of 1% or more of the stock by research analyst or Angel or associates or relatives
No
3. Served as an officer, director or employee of the company covered under Research
No
4. Broking relationship with company covered under Research
No
Ratings (Based on expected returns
Buy (> 15%)
Accumulate (5% to 15%)
Neutral (-5 to 5%)
over 12 months investment period):
Reduce (-5% to -15%)
Sell (< -15)
February 1, 2017
10